Demographics of Montserrat

Last updated

This is demography of the population of Montserrat including population density, ethnicity, education level, health of the populace, economic status, religious affiliations and other aspects of the population.

Contents

Census population and average annual growth rate
YearPop.±%
1901 12,215    
1911 12,196−0.2%
1921 12,120−0.6%
1946 13,313+9.8%
1960 13,378+0.5%
1970 12,155−9.1%
1980 11,685−3.9%
1991 11,314−3.2%
2001 4,491−60.3%
2010 4,922+9.6%
2014 5,100+3.6%
2016 5,146+0.9%
Sources: [1] [2] [3] [4]

Population

Montserrat had a population of 7,119 in 1842. [5]

In 1995, the Soufriere Hills Volcano eruption caused two-thirds of the population of about 11,500 people to evacuate the island. [6] According to the 2001 census only 4,491 people were resident of Montserrat. The total local-born population was 69% while those born abroad were 31%. [1] According to The 2012 Revision of the World Population Prospects' medium fertility scenario, the anticipated mid-year population for 2014 is 5,100. [7]
note: Approximately two thirds of the population left the island following the resumption of volcanic activity in July 1995. According to the 2001 UK Census 7,983 Montserratian-born people were residing in the UK (almost twice the population of Montserrat itself). [8]

Vital statistics

Average population (x 1000)Live birthsDeathsNatural changeCrude birth rate (per 1000)Crude death rate (per 1000)Natural change (per 1000)
195013.540619720930.014.615.5
195114.143617725930.912.518.3
195214.542314827529.210.219.0
195314.642420322129.013.915.1
195414.642918024929.512.417.1
195514.342817325529.912.117.8
195613.939616623028.511.916.5
195713.437316221127.812.115.7
195812.937717220529.213.315.9
195912.539118420731.414.816.6
196012.135914121829.711.718.0
196111.933513619928.211.416.7
196211.832412819627.510.816.6
196311.834111722428.99.919.0
196411.836410725730.89.021.7
196511.838314723632.312.419.9
196611.832813918927.811.816.0
196711.836314821530.912.618.3
196811.732211520727.59.817.7
196911.726413812622.711.810.8
197011.630212118126.010.415.6
197111.626912314623.110.612.6
197211.731814417427.312.414.9
197311.729510718825.29.216.1
197411.730413117325.911.214.7
197511.82131288518.110.97.2
197611.8201287817.410.86.6
197711.92051386717.211.65.6
197811.91931474616.212.33.9
197911.923811612219.99.710.2
198011.922410312118.88.610.2
198111.923111711419.59.99.6
198211.726011414622.19.712.4
198311.626612414222.910.712.2
198411.524410414021.39.112.2
198511.323712411320.910.910.0
198611.22001237717.911.06.9
198711.0
198810.9
198910.8
199010.7
199110.8
199210.9
199310.9
199410.715014.0
199510.212612.3
19969.412813.7
19978.3678.2
19986.9334.8
19995.84559-147.810.2-2.4
20005.04852-49.610.4-0.8
20014.54750-310.411.1-0.7
20024.454441012.310.02.3
20034.54055-158.912.3-3.4
20044.64757-1010.112.4-2.3
20054.7856359413.212.40.8
20064.6554947210.19.70.4
20074.8194344-18.89.1-0.2
20084.87572452714.89.25.5
20095.039504469.98.71.2
20105.02062402212.48.04.4
20114.9244655-99.311.2-1.8
20124.9365344910.78.91.8
20134.9594145-48.39.1-0.8
20144.97650321810.06.43.6
20154849-1
201646433
2017553916
20184.649453879.78.21.5
20194.5194759-1210.413.1-2.7
20204,62650391110.88.42.4
20214,4584346-39.610.3-0.7
20224,4333558-237.913.1-5.2
20234,2942540-155.89.3-3.5

[9] [10] [11]

Structure of the population

Population by Sex and Age Group (Census 12.V.2011): [12]
Age GroupMaleFemaleTotal%
Total2 5462 3764 922100
0-41571443016.12
5-91461653116.32
10-141871723597.29
15-191791403196.48
20-244043652695.47
25-291541452996.07
30-341381602986.05
35-391721963687.48
40-441892174068.25
45-491961853817.74
50-541831483316.72
55-591811333146.38
60-641651102755.59
65-691301012314.69
70-7475701452.95
75-7961551162.36
80-844450941.91
85+37681052.13
Age groupMaleFemaleTotalPercent
0-1449048197119.73
15-641 7091 5513 26066.23
65+34734469114.04
Population Estimates by Sex and Age Group (01.VII.2020): [12]
Age GroupMaleFemaleTotal%
Total2 2842 3424 626100
0–41121322445.27
5–91091232325.02
10–141621593216.94
15–191251352605.62
20–241241142385.14
25–291671343016.51
30–341381833216.94
35–391231662896.25
40–441501673176.85
45–491561723287.09
50–541821853677.93
55–591711433146.79
60–641541342886.23
65-691481302786.01
70-74121922134.60
75-7977701473.18
80-843448821.77
85-892123440.95
90+1032420.91
Age groupMaleFemaleTotalPercent
0–1438341479717.23
15–641 4901 5333 02365.35
65+41139580617.42

Life Expectancy

Based on 2023 data: [13]

Only in Montserrat life expectancy for men is higher than for women. The difference is 1.8 years. [14]

Ethnic groups

Ethnic groups of Montserrat (2011) [15]
Ethnic groupspercent
African/Black
88.4%
Mixed
3.7%
Hispanic/Spanish
3%
Caucasian/White
2.7%
East Indian/Indian
1.5%
Other
0.7%

The vast majority of the population of Montserrat are of African descent (92.4% at the 2001 census) or mixed (2.9%). [1] There is also a European origin minority (3.0%; mostly descendants of Irish indentured servants or British colonists), East Indians (1.0%) groups. Out of 403 Amerindians at the 1980 census only 3 persons were left in 2001.

Religion

Religions in Montserrat (2001) [15]
Religionspercent
Anglican
21.8%
Methodist
17%
Pentecostal
14.1%
Roman Catholic
11.6%
Seventh-day Adventist
10.5%
Unspecified
10.8%
Other
6.5%
Church of God
3.7%
None
2.6%
Rastafarian
1.4%

See also

Related Research Articles

<span class="mw-page-title-main">Demographics of Antigua and Barbuda</span> National demographics

This article is a demography of the population of Antigua and Barbuda including population density, ethnicity, religious affiliations and other aspects of the population.

<span class="mw-page-title-main">Demographics of Botswana</span> Demographics of country

Demographic features of the population of Botswana include population density, ethnicity, education level, health of the populace, economic status, religious affiliations and other aspects.

<span class="mw-page-title-main">Demographics of Cameroon</span>

The demographic profile of Cameroon is complex for a country of its population. Cameroon comprises an estimated 250 distinct ethnic groups, which may be formed into five large regional-cultural divisions:

<span class="mw-page-title-main">Demographics of Gabon</span>

The Demographics of Gabon is the makeup of the population of Gabon. As of 2020, Gabon has a population of 2,225,287. Gabon's population is relatively young with 35.5% of its population under 15 years of age and only 4.3% of its population over 65 years old. Gabon has a nearly even split between males and females with 0.99 males for every female in the population. In the age range of 15–65, the ration is exactly 1 male to 1 female. The life expectancy of Gabon is lower than the world average. Gabon's population's life expectancy at birth is 53.11 years while the world average is 67.2 years as of 2010. Ethnically, the biggest group in Gabon are the Fang people with over 500,000 people, or about a third of Gabon's population, belonging to this ethnic group. The biggest religion in Gabon is Christianity, with between 55–75% of the population of Gabon being Christian.

<span class="mw-page-title-main">Demographics of Grenada</span> National demographics

The demography of the people of Grenada, Grenadians, includes population density, ethnicity, education level, health of the populace, economic status, religious affiliations and other aspects of the population.

<span class="mw-page-title-main">Demographics of India</span>

India is the most populous country in the world with one-sixth of the world's population. According to estimates from the United Nations (UN), India has overtaken China as the country with the largest population in the world, with a population of 1,425,775,850 at the end of April 2023.

<span class="mw-page-title-main">Demographics of Indonesia</span>

The population of Indonesia was 270.20 million according to the 2020 national census, an increase from 237.64 million in 2010. The official estimate as at mid 2022 was 275,773,800, increasing at a rate of 1.17% per year. Indonesia is the fourth most populous country in the world. Approximately 55% of Indonesia's population resides on Java, which is the most populous island in the world.

<span class="mw-page-title-main">Demographics of Iraq</span>

The Iraqi people are people originating from the country of Iraq.

<span class="mw-page-title-main">Demographics of Lesotho</span>

Demographic features of the population of Lesotho include population density, ethnicity, education level, health of the populace, economic status, religious affiliations and other aspects.

This is a demography of the population of Monaco, including population density, ethnicity, education level, health of the populace, economic status, religious affiliations and other aspects of the population.

<span class="mw-page-title-main">Demographics of Namibia</span>

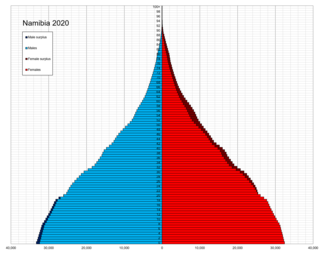
This is a demography of the population of Namibia including population density, ethnicity, education level, health of the populace, economic status, religious affiliations and other aspects of the population.

<span class="mw-page-title-main">Demographics of Eswatini</span>

Demographic features of the population of Eswatini include population density, ethnicity, education level, health of the populace, economic status, religious affiliations and other aspects of the population.

<span class="mw-page-title-main">Demographics of the United Arab Emirates</span>

Demographic features of the United Arab Emirates (UAE) include population density, vital statistics, immigration and emigration data, ethnicity, education levels, religions practiced, and languages spoken within the UAE.

<span class="mw-page-title-main">Demographics of Yemen</span>

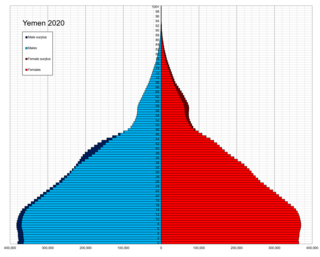
Demographic features of the population of Yemen include population density, ethnicity, education level, health of the populace, economic status, religious affiliations and other aspects of the population.

<span class="mw-page-title-main">Demographics of Zimbabwe</span>

Demographic features of the population of Zimbabwe include population density, ethnicity, education level, health of the populace, economic status, religious affiliations and other aspects of the population.

<span class="mw-page-title-main">Demographics of Azerbaijan</span>

This is a demography of the population of Azerbaijan including population density, ethnicity, education level, health of the populace, economic status, religious affiliations and other aspects of the population.

<span class="mw-page-title-main">Demographics of Bahrain</span>

The demographics of the population of Bahrain includes population density, ethnicity, education level, health of the populace, economic status, religious affiliations and other aspects of the population.

<span class="mw-page-title-main">Demographics of Bhutan</span>

This is a demography of the population of Bhutan including population density, ethnicity, education level, health of the populace, economic status, religious affiliations and other aspects of the population.

<span class="mw-page-title-main">Demographics of the State of Palestine</span>

Demographic features of the population of the area commonly described as Palestinian territories includes information on ethnicity, education level, health of the populace, economic status, religious affiliations and other aspects of that population.

References

  1. 1 2 3 "National Population Census Report 2001 - Montserrat" (PDF). Archived from the original (PDF) on 2016-03-31. Retrieved 2014-01-01.
  2. "CARICOM Statistics" (PDF). Archived from the original (PDF) on 2014-07-14. Retrieved 2014-06-07.
  3. "Montserrat Population (2023) - Worldometer". www.worldometers.info.
  4. "Montserrat population (2023) live — Countrymeters". countrymeters.info.
  5. The National Cyclopaedia of Useful Knowledge, Vol.IV. London: Charles Knight. 1848. p. 772.
  6. "Montserrat evacuation remembered". 2005-09-12. Retrieved 2021-06-28.
  7. "World Population Prospects - Population Division - United Nations". population.un.org.
  8. "Country-of-birth database". Organisation for Economic Co-operation and Development. Archived from the original on 2009-06-17. Retrieved 2008-09-20.
  9. United Nations. Demographic Yearbooks
  10. "Archived copy" (PDF). Archived from the original (PDF) on 2016-03-25. Retrieved 2016-03-17.{{cite web}}: CS1 maint: archived copy as title (link)
  11. "Social and Demographic Statistics". Statistics Department Montserrat. Retrieved 2024-05-20.
  12. 1 2 "UNSD — Demographic and Social Statistics". unstats.un.org. Retrieved 2023-05-10.
  13. "Life expectancy at birth - The World Factbook". www.cia.gov. Retrieved 2024-04-03.
  14. "List of Countries by Life Expectancy 2023 | life —— lines". 2024-01-22. Retrieved 2024-04-03.
  15. 1 2 "Central America and Caribbean :MONTSERRAT". CIA The World Factbook. 22 September 2021.