This is a demography of the population of The Bahamas including population density, ethnicity, education level, health of the populace, economic status, religious affiliations and other aspects of the population.
Year | Pop. | ±% |
---|---|---|
1845 | 26,491 | — |
1851 | 27,519 | +3.9% |
1861 | 35,487 | +29.0% |
1871 | 39,162 | +10.4% |
1881 | 43,521 | +11.1% |
1891 | 47,565 | +9.3% |
1901 | 53,735 | +13.0% |
1911 | 55,944 | +4.1% |
1921 | 53,031 | −5.2% |
1931 | 59,828 | +12.8% |
1943 | 68,846 | +15.1% |
1953 | 84,841 | +23.2% |
1963 | 130,220 | +53.5% |
1970 | 168,812 | +29.6% |
1980 | 209,505 | +24.1% |
1990 | 255,049 | +21.7% |
2000 | 303,611 | +19.0% |
2010 | 351,461 | +15.8% |
2022 | 399,314 | +13.6% |
Source: [1] |
Ninety percent of the Bahamian population identifies as being primarily of African ancestry. About two-thirds of the population lives on New Providence Island (the location of Nassau), and about half of the remaining one-third lives on Grand Bahama (the location of Freeport).
The islands were sparsely settled and a haven for pirates until the late 18th century, when thousands of British Loyalists were given compensatory land grants following the American Revolution. Many new settlers were from the Southern United States and brought slaves with them to cultivate plantations. At the turn of the 20th century, the total population was 53,000.
School attendance is compulsory between the ages of 5 and 16. There are 158 public schools and 52 private schools in the Bahamas catering to more than 66,000 students. The College of the Bahamas, established in Nassau in 1974, provides programmes leading to associate's degrees and bachelor's degrees; the college is now converting from a two-year to a four-year institution.
Average population | Live births | Deaths | Natural change | Crude birth rate (per 1000) | Crude death rate (per 1000) | Natural change (per 1000) | Total fertility rate [4] | Infant mortality rate [5] | |
---|---|---|---|---|---|---|---|---|---|
1935 | 64 000 | 2.000 | 1.121 | 879 | 31.3 | 17.5 | 13.7 | ||
1936 | 66 000 | 1.902 | 1.056 | 846 | 28.8 | 16.0 | 12.8 | ||
1937 | 67 000 | 2.084 | 914 | 1.170 | 31.1 | 13.6 | 17.5 | ||
1938 | 67 000 | 2.020 | 1.096 | 924 | 30.1 | 16.4 | 13.8 | ||
1939 | 68 000 | 2.040 | 1.066 | 974 | 30.0 | 15.7 | 14.3 | ||
1940 | 70 000 | 2.185 | 1.052 | 1.133 | 31.2 | 15.0 | 16.2 | ||
1941 | 71 000 | 2.312 | 920 | 1.392 | 32.6 | 13.0 | 19.6 | ||
1942 | 72 000 | 2.409 | 1.011 | 1.398 | 33.5 | 14.0 | 19.4 | ||
1943 | 70 000 | 2.502 | 1.043 | 1.459 | 35.7 | 14.9 | 20.8 | ||
1944 | 69 000 | 2.485 | 1.103 | 1.382 | 36.0 | 16.0 | 20.0 | ||
1945 | 71 000 | 2.174 | 1.326 | 848 | 30.6 | 18.7 | 11.9 | ||
1946 | 73 000 | 2.208 | 1.002 | 1.206 | 30.2 | 13.7 | 16.5 | ||
1947 | 74 000 | 2.415 | 987 | 1.428 | 32.6 | 13.3 | 19.3 | ||
1948 | 76 000 | 2.539 | 1.029 | 1.510 | 33.4 | 13.5 | 19.9 | ||
1949 | 77 000 | 2.646 | 1.052 | 1.594 | 34.4 | 13.7 | 20.7 | ||
1950 | 79 000 | 2.532 | 1.143 | 1.389 | 32.1 | 14.5 | 17.6 | ||
1951 | 80 000 | 2.739 | 963 | 1.776 | 34.2 | 12.0 | 22.2 | ||
1952 | 81 000 | 2.714 | 959 | 1.755 | 33.5 | 11.8 | 21.7 | ||
1953 | 83 000 | 3.056 | 903 | 2.153 | 36.8 | 10.9 | 25.9 | ||
1954 | 86 000 | 3.410 | 844 | 2.566 | 39.7 | 9.8 | 29.8 | ||
1955 | 89 000 | 2.844 | 857 | 1.987 | 32.0 | 9.6 | 22.3 | ||
1956 | 92 000 | 3.290 | 849 | 2.441 | 35.8 | 9.2 | 26.5 | ||
1957 | 96 000 | 3.126 | 764 | 2.362 | 32.6 | 8.0 | 24.6 | ||
1958 | 100 000 | 3.029 | 1.095 | 1.934 | 30.3 | 11.0 | 19.3 | ||
1959 | 104 000 | 3.154 | 1.000 | 2.154 | 30.3 | 9.6 | 20.7 | ||
1960 | 110 000 | 3.359 | 805 | 2.554 | 30.5 | 7.3 | 23.2 | ||
1961 | 115 000 | 3.734 | 1.024 | 2.710 | 32.5 | 8.9 | 23.6 | ||
1962 | 121 000 | 3.468 | 821 | 2.647 | 28.7 | 6.8 | 21.9 | ||
1963 | 127 000 | 4.584 | 1.030 | 3.554 | 35.8 | 8.0 | 27.8 | ||
1964 | 134 000 | 4.805 | 987 | 3.818 | 35.9 | 7.4 | 28.5 | ||
1965 | 140 000 | 4.439 | 1.098 | 3.341 | 31.7 | 7.8 | 23.9 | ||
1966 | 146 000 | 4.573 | 1.067 | 3.506 | 31.1 | 7.3 | 23.9 | ||
1967 | 153 000 | 4.275 | 1.212 | 3.063 | 27.9 | 7.9 | 20.0 | ||
1968 | 159 000 | 4.220 | 1.023 | 3.197 | 26.5 | 6.4 | 20.1 | ||
1969 | 164 000 | 4.306 | 1.097 | 3.209 | 26.1 | 6.6 | 19.4 | ||
1970 | 169 000 | 4.262 | 1.054 | 3.208 | 25.1 | 6.2 | 18.9 | ||
1971 | 174 000 | 5.334 | 948 | 4.386 | 30.7 | 5.4 | 25.2 | ||
1972 | 178 000 | 4.745 | 1.115 | 3.630 | 26.7 | 6.3 | 20.4 | ||
1973 | 181 000 | 4.419 | 1.109 | 3.310 | 24.3 | 6.1 | 18.2 | ||
1974 | 185 000 | 4.382 | 1.032 | 3.350 | 23.7 | 5.6 | 18.1 | ||
1975 | 189 000 | 4.033 | 1.106 | 2.927 | 21.3 | 5.9 | 15.5 | ||
1976 | 193 000 | 5.295 | 976 | 4.319 | 27.4 | 5.1 | 22.4 | ||
1977 | 197 000 | 4.871 | 1.067 | 3.804 | 24.7 | 5.4 | 19.3 | ||
1978 | 202 000 | 4.362 | 1.077 | 3.285 | 21.7 | 5.4 | 16.3 | ||
1979 | 206 000 | 4.809 | 1.211 | 3.598 | 23.3 | 5.9 | 17.5 | ||
1980 | 211 000 | 5.035 | 1.338 | 3.697 | 24.0 | 6.4 | 17.6 | ||
1981 | 215 000 | 5.251 | 1.127 | 4.124 | 24.4 | 5.2 | 19.2 | ||
1982 | 220 000 | 5.293 | 1.185 | 4.108 | 24.2 | 5.4 | 18.8 | ||
1983 | 225 000 | 5.280 | 1.104 | 4.176 | 23.6 | 4.9 | 18.6 | ||
1984 | 230 000 | 5.177 | 1.150 | 4.027 | 22.6 | 5.0 | 17.6 | ||
1985 | 235 000 | 5.584 | 1.341 | 4.243 | 24.0 | 5.8 | 18.2 | ||
1986 | 239 000 | 4.770 | 1.407 | 3.363 | 20.0 | 5.9 | 14.1 | ||
1987 | 243 000 | 4.331 | 1.376 | 2.955 | 17.9 | 5.7 | 12.2 | ||
1988 | 248 000 | 4.943 | 1.319 | 3.624 | 20.1 | 5.4 | 14.7 | ||
1989 | 252 000 | 4.971 | 1.459 | 3.512 | 19.9 | 5.8 | 14.0 | ||
1990 | 256 000 | 6.117 | 1.343 | 4.774 | 23.9 | 5.2 | 18.6 | ||
1991 | 261 000 | 6.192 | 1.335 | 4.857 | 23.7 | 5.1 | 18.6 | ||
1992 | 266 000 | 6.759 | 1.462 | 5.297 | 25.4 | 5.5 | 19.9 | ||
1993 | 271 000 | 6.674 | 1.493 | 5.181 | 24.6 | 5.5 | 19.1 | ||
1994 | 276 000 | 6.104 | 1.538 | 4.566 | 22.1 | 5.6 | 16.6 | ||
1995 | 280 000 | 6.253 | 1.638 | 4.615 | 22.3 | 5.8 | 16.5 | 19.0 | |
1996 | 284 000 | 5.913 | 1.537 | 4.376 | 20.8 | 5.4 | 15.4 | 18.4 | |
1997 | 287 000 | 6.022 | 1.670 | 4.352 | 21.0 | 5.8 | 15.2 | 16.4 | |
1998 | 290 000 | 5.880 | 1.800 | 4.080 | 20.3 | 6.2 | 14.1 | 14.0 | |
1999 | 293 000 | 5.367 | 1.644 | 3.723 | 18.3 | 5.6 | 12.7 | 15.8 | |
2000 | 298 000 | 5.287 | 1.825 | 3.462 | 17.8 | 6.1 | 11.6 | 14.8 | |
2001 | 303 000 | 5.353 | 1.609 | 3.744 | 17.7 | 5.3 | 12.4 | 12.7 | |
2002 | 309 000 | 5.216 | 1.827 | 3.389 | 16.9 | 5.9 | 11.0 | 16.7 | |
2003 | 316 000 | 5.054 | 1.730 | 3.324 | 16.0 | 5.5 | 10.5 | 17.2 | |
2004 | 322 000 | 5.154 | 1.655 | 3.499 | 16.1 | 5.1 | 11.0 | 17.3 | |
2005 | 328.320 | 5.548 | 1.824 | 3.724 | 17.1 | 5.6 | 11.5 | 2.05 | 19.6 |
2006 | 333.060 | 5.296 | 1.730 | 3.566 | 16.0 | 5.2 | 10.8 | 1.93 | 18.1 |
2007 | 337.920 | 5.854 | 1.798 | 4.056 | 17.5 | 5.4 | 12.1 | 2.14 | 17.6 |
2008 | 342.830 | 5.480 | 1.863 | 3.617 | 16.2 | 5.5 | 10.7 | 2.00 | 17.9 |
2009 | 347.780 | 5.348 | 1.981 | 3.367 | 15.6 | 5.7 | 9.9 | 2.03 | 21.1 |
2010 | 351.461 | 5.049 | 2.023 | 3.026 | 14.4 | 5.8 | 8.6 | 1.94 | 19.8 |
2011 | 357.750 | 5.000 | 2.127 | 2.873 | 14.0 | 5.9 | 8.1 | 1.69 | 16.2 |
2012 | 362.590 | 4.345 | 1.937 | 2.408 | 12.0 | 5.3 | 6.7 | 1.76 | 19.1 |
2013 | 367.430 | 3.935 | 2.062 | 1.873 | 10.7 | 5.6 | 5.1 | 1.73 | 22.7 |
2014 | 372.380 | 4.155 | 2.132 | 2.023 | 11.3 | 5.8 | 5.5 | 1.69 | 19.4 |
2015 | 373.630 | 4.253 | 2.243 | 2.010 | 11.5 | 6.1 | 5.4 | 1.57 | 20.6 |
2016 | 378.040 | 4.093 | 2.288 | 1.805 | 11.0 | 6.1 | 4.9 | 1.50 | 16.0 |
2017 | 382.460 | 4.017 | 2.372 | 1.645 | 10.7 | 6.3 | 4.4 | 1.42 | |
2018 | 386.870 | 2.491 | 6.4 | ||||||
2019 | 391.260 | 2.639 | 6.7 | ||||||
2020 | 395.640 | 3.016 | 7.6 | ||||||
2021 | 400.000 | 3.649 | 9.1 |
Age group | Male | Female | Total | % |
---|---|---|---|---|
Total | 179 850 | 188 540 | 368 390 | 100 |
0-4 | 16 670 | 15 660 | 32 330 | 8.78 |
5-9 | 16 400 | 15 090 | 31 490 | 8.55 |
10-14 | 14 990 | 14 730 | 29 720 | 8.07 |
15-19 | 15 170 | 15 320 | 30 490 | 8.28 |
20-24 | 14 780 | 15 250 | 30 030 | 8.15 |
25-29 | 13 090 | 13 780 | 26 870 | 7.29 |
30-34 | 12 780 | 13 000 | 25 780 | 7.00 |
35-39 | 13 100 | 13 720 | 26 820 | 7.28 |
40-44 | 13 480 | 14 480 | 27 960 | 7.59 |
45-49 | 12 890 | 13 860 | 26 750 | 7.26 |
50-54 | 11 760 | 12 570 | 24 330 | 6.60 |
55-59 | 8 670 | 9 570 | 18 240 | 4.95 |
60-64 | 6 030 | 6 830 | 12 860 | 3.49 |
65-69 | 4 260 | 5 080 | 9 340 | 2.54 |
70-74 | 3 030 | 3 860 | 6 890 | 1.87 |
75-79 | 1 800 | 2 480 | 4 280 | 1.16 |
80-84 | 586 | 1 747 | 2 333 | 0.63 |
85-89 | 243 | 873 | 1 116 | 0.30 |
90+ | 121 | 640 | 761 | 0.21 |
Age group | Male | Female | Total | Percent |
0-14 | 48 060 | 45 480 | 93 540 | 25.39 |
15-64 | 121 750 | 128 380 | 250 130 | 67.90 |
65+ | 10 040 | 14 680 | 24 720 | 6.71 |
Age Group | Male | Female | Total | % |
---|---|---|---|---|
Total | 186 480 | 198 860 | 385 340 | 100 |
0–4 | 14 910 | 14 150 | 29 060 | 7.54 |
5–9 | 14 290 | 14 070 | 28 360 | 7.36 |
10–14 | 15 800 | 16 100 | 31 900 | 8.28 |
15–19 | 15 860 | 16 230 | 32 090 | 8.33 |
20–24 | 15 760 | 15 890 | 31 650 | 8.21 |
25–29 | 15 040 | 14 980 | 30 020 | 7.79 |
30–34 | 12 960 | 13 530 | 26 490 | 6.87 |
35–39 | 12 980 | 14 410 | 27 390 | 7.11 |
40–44 | 13 490 | 14 670 | 28 160 | 7.31 |
45–49 | 13 630 | 15 020 | 28 650 | 7.43 |
50–54 | 11 970 | 13 170 | 25 140 | 6.52 |
55–59 | 10 670 | 12 000 | 22 670 | 5.88 |
60–64 | 7 370 | 8 900 | 16 270 | 4.22 |
65-69 | 4 870 | 5 950 | 10 820 | 2.81 |
70-74 | 3 200 | 4 090 | 7 290 | 1.89 |
75-79 | 2 020 | 2 890 | 4 910 | 1.27 |
80+ | 1 660 | 2 810 | 4 470 | 1.16 |
Age group | Male | Female | Total | Percent |
0–14 | 45 000 | 44 320 | 89 320 | 23.20 |
15–64 | 129 730 | 138 800 | 268 530 | 69.69 |
65+ | 11 750 | 15 740 | 27 490 | 7.13 |
Graphs are unavailable due to technical issues. There is more info on Phabricator and on MediaWiki.org. |
Demographic statistics according to the World Population Review in 2022. [8]
Demographic statistics according to the CIA World Factbook, unless otherwise indicated. [9]
Protestant 69.9% (includes Baptist 34.9%, Anglican 13.7%, Pentecostal 8.9% Seventh Day Adventist 4.4%, Methodist 3.6%, Church of God 1.9%, Brethren 1.6%), Roman Catholic 12%, other Christian 13% (includes Jehovah's Witness 1.1%), other 0.6%, none 1.9%, unspecified 2.6% (2010 est.)
According to The World Factbook, the Bahamas has an HIV/AIDS prevalence rate of 1.9% (2017 est.) [10]
male: 73.2 years female: 79.14 years (2022 est.)
Period | Life expectancy in Years | Period | Life expectancy in Years |
---|---|---|---|
1950–1955 | 60.0 | 1985–1990 | 70.2 |
1955–1960 | 62.0 | 1990–1995 | 71.1 |
1960–1965 | 63.7 | 1995–2000 | 71.7 |
1965–1970 | 65.2 | 2000–2005 | 73.2 |
1970–1975 | 66.6 | 2005–2010 | 74.3 |
1975–1980 | 67.9 | 2010–2015 | 75.1 |
1980–1985 | 69.1 |
Source: UN World Population Prospects [11]
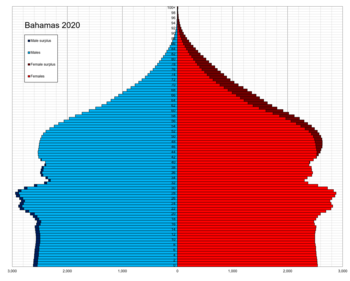
This article is a demography of the population of Antigua and Barbuda including population density, ethnicity, religious affiliations and other aspects of the population.
Demographic features of the population of Botswana include population density, ethnicity, education level, health of the populace, economic status, religious affiliations and other aspects.
The demographic profile of Cameroon is complex for a country of its population. Cameroon comprises an estimated 250 distinct ethnic groups, which may be formed into five large regional-cultural divisions:
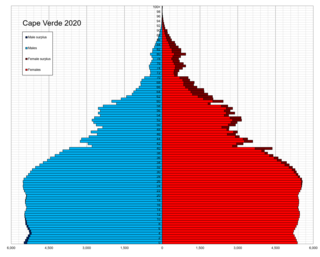
Demographic features of the population of Cape Verde include population density, ethnicity, education level, health of the populace, economic status, religious affiliations and other aspects of the population.
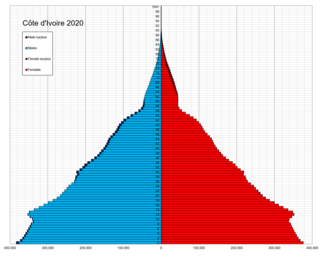
Demographic features of the population of Ivory Coast include population density, ethnicity, education level, health of the populace, economic status, religious affiliations and other aspects of the population.
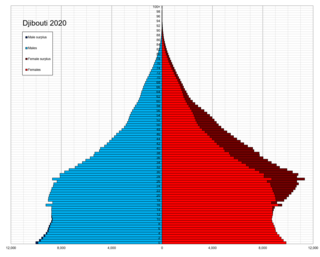
Demographic features of Djibouti include population density, ethnicity, education level, health, economic status, religious affiliations and other aspects.
This is a demography of the population of Dominica including population density, ethnicity, religious affiliations and other aspects of the population.
This is a demography of the population of the Dominican Republic including population density, ethnicity, education level, health of the populace, economic status, religious affiliations and other aspects of the population.
The demography of the population of Grenada includes population density, ethnicity, education level, health of the populace, economic status, religious affiliations and other aspects of the population.
Haiti is the eighty-fifth most populous country in the world, with an estimated population of 11,123,178 as of July 2018. However the last census done in Haiti was in 2003, and the population recorded was 8,812,245. According to population DNA tests, approximately 80% of the population of Haiti is Afro-Haitian. Within Black Haitian DNA the composition is approximately 95% African, 5% European or mixed European. This is evidenced in DNA ancestry read outs where the average Haitian consistently tests at nearly 100 percent SSA DNA. The remaining population of Haiti is primarily composed of Mulattoes, Europeans, Asians, and Arabs. Hispanic residents in Haiti are mostly Cuban and Dominican. About two-thirds of Haitian people live in rural areas.
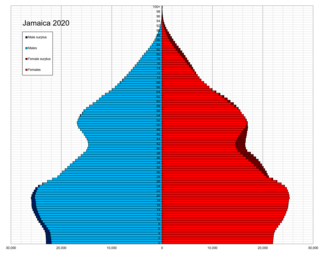
Jamaica is an island country in the Caribbean. The country had a population of 2,825,352 in 2023, the fourth largest in the region.
Demographic features of the population of Lesotho include population density, ethnicity, education level, health of the populace, economic status, religious affiliations and other aspects.
Mauritian society includes people from many different ethnic groups as well as a significant population of mixed-race people who have ancestry from more than one ethnic group. A majority of the republic's residents are the descendants of people from India. Mauritius also contains substantial populations from continental Africa, China, France, and the East African island nation of Madagascar. Mauritius had a population of 1,235,260 according to the final results of the 2022 Census. The population on the island of Mauritius was 1,191,280, and that of Rodrigues island was 43,650 ; Agalega island total population of 330. Mauritius has the second highest population density in Africa. According to the 2022 census, the average age of the population was 38 years. 2022 Census indicated that: The proportion of children aged below 15 years went down from 20.7% in 2011 to 15.4% in 2022; The share of persons aged 60 years and over has risen from 12.7% in 2011 to 18.7% in 2022.
Demographic features of the population of Rwanda include population density, ethnicity, education higher level, health of the populace, economic status, religious affiliations and other aspects.
Demographic features of the population of São Tomé and Príncipe include population density, ethnicity, education level, health of the populace, economic status, religious affiliations and other aspects.
Demographic features of the population of Seychelles include population density, ethnicity, education level, health of the populace, economic status, religious affiliations and other aspects of the population.
Demographic features of the population of Eswatini include population density, ethnicity, education level, health of the populace, economic status, religious affiliations and other aspects of the population.
Venezuela is a country in South America. The Venezuelan people comprise a combination of heritages, primarily Native American and European. The historically present Native American, Spanish colonists, and African slaves have all contributed to varying degrees. Later, waves of European groups migrated to Venezuela in the 20th century, influencing many aspects of Venezuelan life, including its culture, language, food, and music though small in number.
This is a demography of Barbados including population density, ethnicity, education level, health of the populace, economic status, religious affiliations and other aspects of the population.
The demographic characteristics of the population of The Gambia are known through national censuses, conducted in ten-year intervals and analyzed by The Gambian Bureau of Statistics (GBOS) since 1963. The latest census was conducted in 2013. The population of The Gambia at the 2013 census was 1.8 million. The population density is 176.1 per square kilometer, and the overall life expectancy in The Gambia is 64.1 years. Since the first census of 1963, the population of The Gambia has increased every ten years by an average of 43.2 percent. Since 1950s, the birth rate has constantly exceeded the death rate; the natural growth rate is positive. The Gambia is in the second stage of demographic transition. In terms of age structure, The Gambia is dominated by 15- to 24-year-old segment (57.6%). The median age of the population is 19.9 years, and the gender ratio of the total population is 0.98 males per female.