The economy of Papua New Guinea (PNG) is largely underdeveloped with the vast majority of the population living below the poverty line.[18] However, according to the Asian Development Bank its GDP is expected to grow 3.4% in 2022 and 4.6% in 2023.[19] It is dominated by the agricultural, forestry, and fishing sector and the minerals and energy extraction sector. The agricultural, forestry, and fishing sector accounts for most of the labour force of PNG while the minerals and energy extraction sector, including gold, copper, oil and natural gas is responsible for most of the export earnings.[20][18]
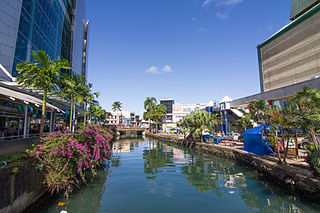
PNG's GDP growth has been driven by the extraction industries and real GDP growth per capita has averaged 4% since mid-2000.[21] The GDP Growth rate for PNG in 2021 was at 1.3%.[22] The country has made significant progress investing proceeds from oil and gas in infrastructure building. As a result, its major cities like Port Moresby and Lae have received increased international investor attention, giving rise to an unprecedented building boom[23] to exploit the opportunities presented by the country's rise as a regional economic leader in the South Pacific region. This is well supported by its strategic location as a gateway from the Pacific to Asia, as well as its comparatively huge landmass and demographic profile (almost 7 times that of the rest of the smaller Pacific Island nations)
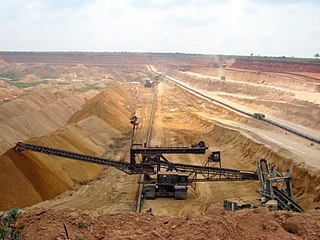
The International Monetary Fund has reported[24] that despite PNG's poverty, it is richly endowed with natural resources, but exploitation has been hampered by the rugged terrain and the high cost of developing infrastructure.[25] Agriculture provides a subsistence livelihood for the bulk of the population. Mineral deposits, including oil, copper, and gold, account for 72% of export earnings.
Budgetary support from Australia and development aid under World Bank auspices continue to sustain the economy.[26] Australia is PNG's largest aid donor, and will provide $479.2 million of aid in 2023.[27] In June 2021 the World Bank approved a US$100 million (PGK 352 million equivalent) operation to support Papua New Guinea in its response to COVID-19, and to lay important foundations for a sustainable recovery.[28]
Economy
According to the Investment Promotion Authority of Papua New Guinea the major economic sectors are agriculture and livestock, forestry, mining and petroleum, tourism and hospitality, fisheries and marine resources, manufacturing, retailing and wholesaling, building and construction, transport and telecommunications, and finance and business trade.[22] The economy generally can be separated into subsistence and market sectors, although the distinction is blurred by smallholder cash cropping of coffee, cocoa, and copra. About 75% of the country's population relies primarily on the subsistence economy. The minerals, timber, and fish sectors are dominated by foreign investors. Manufacturing is limited, and the formal labour sector consequently also is limited.[29]
In 1999, mineral production accounted for 26.3% of gross domestic product. Government revenues and foreign exchange earning minerals. Copper and gold mines are currently in production at Porgera, Ok Tedi, Misima, Lihir, Simberi[30] and Hidden Valley.[31] As of 2014, talks of resuming mining operations in the Panguna mine have also resurfaced, with the Autonomous Bougainville Government and National Government of Papua New Guinea expressing interest in restarting mining operations in the area.[32]
New nickel, copper and gold projects have been identified and are awaiting a rise in commodity prices to begin development. At early 2011, there are confirmation that Mount Suckling project has found at least two new large highly prospective porphyry bodies at Araboro Creek and Ioleu Creek.[33] A consortium led by Chevron is producing and exporting oil from the Southern Highlands Province of Papua New Guinea. In 2001, it expects to begin the commercialization of the country's estimated 640km³ (23 trillion cubic feet) of natural gas reserves through the construction of a gas pipeline from Papua New Guinea to Queensland, Australia. The project was shelved.
In 2019, the country was the 8th largest world producer of cobalt,[34] and the 15th largest world producer of gold.[35] In the production of silver, in 2017 the country produced 90 tons.[36]
The agricultural, forestry, and fishing sector accounts for most of the labour force of PNG. Agriculture currently accounts for 25% of GDP and supports more than 80% of the population. Most agriculture is subsistence, while cash crops are exported. The main crops by value are coffee, oil, cocoa, copra, tea, rubber, and sugar. The timber industry was not active in 1998, due to low world prices, but rebounded in 1999. About 40% of the country is covered with timber rich trees, and a domestic woodworking industry has been slow to develop. Fish exports are confined primarily to shrimp, although fishing boats of other nations catch tuna in Papua New Guinea waters under license.
Papua New Guinea has the largest yam market in Asia.[37]
Papua New Guinea produced in 2021:
3.0 million tons of palm oil (7th largest world producer);
1.8 million tons of coconut (7th largest world producer);
In addition to smaller productions of other agricultural products, like natural rubber (7.7 thousand tons) and tea (5.5 thousand tons).[38]
Industry
In general, the Papua New Guinea economy is highly dependent on imports for manufactured goods. Its industrial sector—exclusive of mining—accounts for only 9% of GDP and contributes little to exports. Small-scale industries produce beer, soap, concrete products, clothing, paper products, matches, ice cream, canned meat, fruit juices, furniture, plywood, and paint. The small domestic market, relatively high wages, and high transport costs are constraints to industrial development.
Telecommunications
Until the second half of 2007, information and communication technology (ICT) services in Papua New Guinea (PNG) were limited to urban centres under the monopoly operator, Telikom PNG (Mitchel 2008). Thereafter, the Irish owned utility Digicel entered the mobile market and expanded mobile signal coverage across the country enabling connectivity to many people — the mobile phone penetration rate reached 41 per cent by 2014, marking a substantial change in the communications landscape.[39] PNG has 42.68 mobile phone users per 100 population, estimated in 2017.[40] PNG has a low level of broadband uptake, estimated in 2017 at 0.213 per 100 population.[41]
Energy
Particularly in rural areas there is reliance on traditional sources of biomass energy for cooking.
Electricity
Access to electricity
By 2017, only 50.42% of the rural population had access to electricity.[42] 80.23% of the urban population in 2017 had access to electricity.[43] Limitations in the transmission and distribution infrastructure lead to frequent outages in urban centers.[44]
PNG Power Ltd (PPL) operates three separate grids. There are two main large grids, the Port Moresby system serving the National Capital District and the large Ramu grid that extends into the highlands. Also, PPL operates the small Gazelle Peninsula Grid powered mainly by a 10 MW run-of-river hydro plant.[46]
Entities and institutions
The Electricity Commission (ELCOM) was privatised with the passage of the Electricity Commission (Privatization) Act 2002. PNG Power Limited (PPL) is a vertically integrated utility responsible for generation, transmission, distribution and retailing of electricity throughout Papua New Guinea.
Electricity generation by source
Renewable energy
A study by Bloomberg New Energy Finance ranked PNG in the top 10 for potential renewable resources, with about 2.5 GW of these but only 2% of it exploited.[47]
Hydroelectric projects
The Yonki Dam project, which commenced operation in 1991, on the Ramu River has generation capacity of 77 MW (103,000hp) (Ramu 1) plus proposed additional capacity of 18 MW.
Proposed projects
The list of intended projects include the US$2 billion Ramu 2 hydro project on the Ramu River to be built under a public-private partnership with Shenzhen Energy Group.[48]
Edevu Dam is to be constructed by PNG Hydro Development Ltd (PNGHDL) to generate 50 Megawatts (MW).[49]
Consultants to PNG Power have conducted feasibility studies for the Naoro Brown hydroelectricity Project which would supply up to 80MW of electricity to the Port Moresby grid.[50]
Transport in Papua New Guinea is in many cases heavily limited by the mountainous terrain. The capital, Port Moresby, is not linked by road to any of the other major towns and many highland villages can only be reached by light aircraft or on foot.
Papua New Guinea has no major railways, but some mine sites have disused tracks.
The Bank of Papua New Guinea (BPNG) is the central bank of Papua New Guinea. Its main function is to issue currency and to act as the banker and financial agent to the Government. It is also in charge of regulating banking and other financial services and manages the gold, foreign exchange and any other international reserves of Papua New Guinea.
BPNG is engaged in developing policies to promote financial inclusion and is a member of the Alliance for Financial Inclusion, which had been formed in 2008. In 2013, BPNG made a Maya Declaration Commitment[52] to create an enabling environment for building an inclusive financial sector in Papua New Guinea.[53]
The currency of Papua New Guinean, issued by the BPNG, is the kina, which was introduced on 19 April 1975 to replace the Australian dollar.
Trade and investment
In 2014, Papua New Guinea's merchandise exports were:
Major source countries for merchandise imports include Australia (34.4%), Singapore (14.3%), the European Union (8.3%), China (6.9%), and Japan (6.4%).
Petroleum, mining machinery and aircraft have been the primary U.S. exports to Papua New Guinea. In 1999, as mineral exploration and new minerals investments declined, as did United States exports. Crude oil is the largest U.S. import from Papua New Guinea, followed by gold, cocoa, coffee, and copper ore.
U.S. companies are active in developing Papua New Guinea's mining and petroleum sectors. Chevron operates the Kutubu and Gobe oil projects and is developing its natural gas reserves. A 5,000–6,000 m³ (30,000–40,000 barrel) per day oil refinery project in which there is an American interest also is under development in Port Moresby.
Papua New Guinea is highly dependent on foreign aid. Australia has been the largest bilateral aid donor to PNG, providing $A506 million ($US376 million) in 2016.[55] Budgetary support, which has been provided in decreasing amounts since independence, was phased out in 2000, with aid concentrated on project development.
By mid-1999, Papua New Guinea's economy was in crisis. Although its agricultural sector had recovered from the 1997 drought and timber prices were rising as most Asian economies recovered from their 1998 slump, Papua New Guinea's foreign currency earnings suffered from low world mineral and petroleum prices. Estimates of minerals in exploration expenditure in 1999 were one-third of what was spent in 1997. The resulting lower foreign exchange earnings, capital flight, and general government mismanagement resulted in a precipitous drop in the value of Papua New Guinea's currency, the kina, leading to a dangerous decrease in foreign currency reserves. The kina has floated since 1994. Economic activity decreased in most sectors; imports of all kinds shrunk; and inflation, which had been over 21% in 1998, slowed to an estimated annual rate of 8% in 1999.
Citing the previous government's failure to successfully negotiate acceptable commercial loans or bond sales to cover its budget deficit, the government formed by Sir Mekere Morauta in July 1999 successfully requested emergency assistance from the International Monetary Fund and the World Bank. With assistance from the Fund and the Bank, the government has made considerable progress toward macroeconomic stabilization and economic reform.
As of 2019, although statistics show that an economic recovery is underway, Papua New Guinea's economy is still struggling.
Main indicators
The following table shows the main economic indicators in 1980–2017.[56]
Year
GDP (in bil. US$ PPP)
GDP per capita (in US$ PPP)
GDP (in bil. US$ nominal)
GDP growth (real)
Inflation (in Percent)
Government debt (in% of GDP)
1980
10.1
1,067
4.1
−2.3%
12.1%
...
1985
11.9
1,323
3.3
3.6%
3.7%
...
1990
15.4
1,462
4.8
−3.0%
7.0%
...
1995
23.4
2,067
7.1
−3.4%
17.3%
36%
2000
29.6
2,056
5.2
−2.5%
15.6%
42%
2005
13.2
2,280
7.3
3.9%
1.8%
32%
2006
13.9
2,348
8.4
2.3%
2.4%
26%
2007
15.9
2,348
9.5
11.1%
0.9%
23%
2008
16.1
2,617
11.7
−0.3%
10.8%
22%
2009
17.3
2,600
11.6
6.8%
6.9%
22%
2010
19.3
2,891
14.3
10.1%
5.1%
17%
2011
20.0
2,830
18.0
1.1%
4.4%
16%
2012
21.3
2,861
21.3
4.6%
4.5%
19%
2013
22.4
2,954
21.3
3.8%
5.0%
25%
2014
25.7
3,313
23.2
12.5%
5.2%
27%
2015
28.0
3,540
21.7
9.0%
6.0%
29%
2016
29.1
3,597
20.8
2.4%
6.7%
32%
Statistics
Household income or consumption by percentage share: lowest 10%: 4.3% highest 10%: 36% (2008)
Labour force: 2.078 million
Electricity – production: 2,200 GWh (2008)
Electricity – production by source: fossil fuel: 67.78% hydro: 32.22% nuclear: 0% other: 0% (2008)
The economy of Botswana is currently one of the world's fastest growing economies, averaging about 5% per annum over the past decade. Growth in private sector employment averaged about 10% per annum during the first 30 years of the country's independence. After a period of stagnation at the turn of the 21st century, Botswana's economy registered strong levels of growth, with GDP growth exceeding 6–7% targets. Botswana has been praised by the African Development Bank for sustaining one of the world's longest economic booms. Economic growth since the late 1960s has been on par with some of Asia's largest economies. The government has consistently maintained budget surpluses and has extensive foreign-exchange reserves.
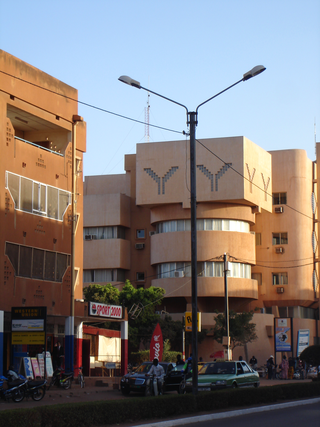
The economy of Burkina Faso is based primarily on subsistence farming and livestock raising. Burkina Faso has an average income purchasing-power-parity per capita of $1,900 and nominal per capita of $790 in 2014. More than 80% of the population relies on subsistence agriculture, with only a small fraction directly involved in industry and services. Highly variable rainfall, poor soils, lack of adequate communications and other infrastructure, a low literacy rate, and a stagnant economy are all longstanding problems of this landlocked country. The export economy also remained subject to fluctuations in world prices.
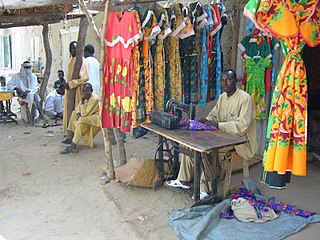
The economy of Chad suffers from the landlocked country's geographic remoteness, drought, lack of infrastructure, and political turmoil. About 85% of the population depends on agriculture, including the herding of livestock. Of Africa's Francophone countries, Chad benefited least from the 50% devaluation of their currencies in January 1994. Financial aid from the World Bank, the African Development Bank, and other sources is directed largely at the improvement of agriculture, especially livestock production. Because of lack of financing, the development of oil fields near Doba, originally due to finish in 2000, was delayed until 2003. It was finally developed and is now operated by ExxonMobil. In terms of gross domestic product, Chad ranks 147th globally with $11.051 billion as of 2018.
The economy of the Central African Republic is $2.321 billion by gross domestic product as of 2019, with an estimated annual per capita income of just $805 as measured by purchasing power parity in 2019.
The economy of the Democratic Republic of the Congo has declined drastically around the 1980s, despite being home to vast potential in natural resources and mineral wealth; their gross domestic product is $69.474 billion as of 2023.
The economy of Ethiopia is a mixed and transition economy with a large public sector. The government of Ethiopia is in the process of privatizing many of the state-owned businesses and moving toward a market economy. The banking, telecommunication and transportation sectors of the economy are dominated by government-owned companies.
The economy of Kyrgyzstan is heavily dependent on the agricultural sector. Cotton, tobacco, wool, and meat are the main agricultural products, although only tobacco and cotton are exported in any quantity. According to Healy Consultants, Kyrgyzstan's economy relies heavily on the strength of industrial exports, with plentiful reserves of gold, mercury and uranium. The economy also relies heavily on remittances from foreign workers. Following independence, Kyrgyzstan was progressive in carrying out market reforms, such as an improved regulatory system and land reform. In 1998, Kyrgyzstan was the first Commonwealth of Independent States (CIS) country to be accepted into the World Trade Organization. Much of the government's stock in enterprises has been sold. Kyrgyzstan's economic performance has been hindered by widespread corruption, low foreign investment and general regional instability. Despite those issues, Kyrgyzstan is ranked 70th on the ease of doing business index.
The economy of Laos is a lower-middle income developing economy. Being one of the socialist states, the Lao economic model resembles the Chinese socialist market and/or Vietnamese socialist-oriented market economies by combining high degrees of state ownership with openness to foreign direct investment and private ownership in a predominantly market-based framework.
The economy of Libya depends primarily on revenues from the petroleum sector, which represents over 95% of export earnings and 60% of GDP. These oil revenues and a small population have given Libya one of the highest nominal per capita GDP in Africa.
The economy of Mali is based to a large extent upon agriculture, with a mostly rural population engaged in subsistence agriculture.
The economy of Rwanda has undergone rapid industrialisation due to a successful governmental policy. It has a mixed economy. Since the early-2000s, Rwanda has witnessed an economic boom, which improved the living standards of many Rwandans. The Government's progressive visions have been the catalyst for the fast transforming economy. The President of Rwanda, Paul Kagame, has noted his ambition to make Rwanda the "Singapore of Africa". The industrial sector is growing, contributing 16% of GDP in 2012.
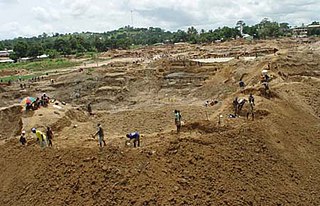
The economy of Sierra Leone is $4.082 billion by gross domestic product as of 2018. Since the end of the Sierra Leone Civil War in 2002, the economy is gradually recovering with a gross domestic product growth rate between 4 and 7%. In 2008 it in PPP ranked between 147th by World Bank, and 153rd by CIA, largest in the world.
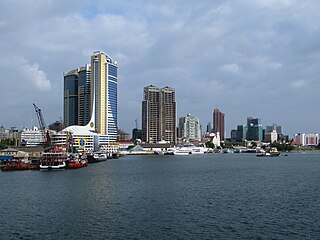
The economy of Tanzania is a lower-middle income economy that is overwhelmingly dependent on agriculture. Tanzania's economy has been transitioning from a planned economy to a market economy since 1985. Although total GDP has increased since these reforms began, GDP per capita dropped sharply at first, and only exceeded the pre-transition figure in around 2007.
The economy of Togo has struggled greatly. The International Monetary Fund (IMF) ranks it as the tenth poorest country in the world, with development undercut by political instability, lowered commodity prices, and external debts. While industry and services play a role, the economy is dependent on subsistence agriculture, with industrialization and regional banking suffering major setbacks.
The economy of Uruguay features an export-oriented agricultural sector and a well-educated workforce, along with high levels of social spending. Tourism and banking are also prominent sectors; Uruguay acts as a regional hub for international finance and tourism. The country also has a history and representation of advanced workers-rights protection, with unions and the eight-hour work-day protected at the beginning of the 20th century.
The economy of Madagascar is US$9.769 billion by gross domestic product as of 2020, being a market economy and is supported by an agricultural industry and emerging tourism, textile and mining industries. Malagasy agriculture produces tropical staple crops such as rice and cassava, as well as cash crops such as vanilla and coffee.
The economy of Fiji is one of the most developed among the Pacific islands. Nevertheless, Fiji is a developing country endowed with forest, mineral and fish resources. The country has a large agriculture sector heavily based on subsistence agriculture. Sugar exports and the tourism industry are the main sources of foreign exchange. There are also light manufacturing and mining sectors.
The economy of Guyana is one of the fastest growing in the world with a gross domestic product (GDP) growth of 19.9% in 2021. In 2023, Guyana had a per capita gross domestic product of Int$60,648 and an average GDP growth of 4.2% over the previous decade. Guyana's economy was transformed in 2015 with the discovery of an offshore oil field in the country’s waters about 120 miles from Georgetown. Making the first commercial grade crude oil draw in December 2019, sending it abroad for refining.
The Kina is the currency of Papua New Guinea. It is divided into 100 toea. The name Kina is derived from Kuanua language of the Tolai region, referring to a callable pearl shell used widely for trading in both the Coastal and Highlands areas of the country.
The economy of Ivory Coast is stable and currently growing, in the aftermath of political instability in recent decades. The Ivory Coast's economy is largely market-based and depends heavily on the agricultural sector. Almost 70% of the Ivorian people are engaged in some form of agricultural activity. GDP per capitaArchived 4 May 2012 at the Wayback Machine grew 82% in the 1960s, reaching a peak growth of 360% in the 1970s, but this proved unsustainable and it shrank by 28% in the 1980s and a further 22% in the 1990s. This decline, coupled with high population growth, resulted in a steady fall in living standards. The Gross national product per capita, now rising again, was about US$727 in 1996. It was substantially higher two decades before.
↑ World Bank, International Telecommunication Union, World Telecommunication/ICT Development Report. "Mobile Cellular subscriptions". World Bank Open Data. World Bank. Retrieved 5 May 2020.{{cite web}}: CS1 maint: multiple names: authors list (link)
↑ World Bank, International Telecommunication Union, World Telecommunication/ICT Development Report. "Fixed Broadband Subscriptions". World Bank Open Data. World Bank. Retrieved 5 May 2020.{{cite web}}: CS1 maint: multiple names: authors list (link)
This page is based on this Wikipedia article Text is available under the CC BY-SA 4.0 license; additional terms may apply. Images, videos and audio are available under their respective licenses.