Leicester East | |
---|---|
Borough constituency for the House of Commons | |
County | Leicestershire |
Electorate | 74,377 (December 2010) [1] |
Current constituency | |
Created | 1974 |
Member of Parliament | Claudia Webbe (Independent) |
Seats | One |
Created from | Leicester South East Leicester North East |
1918–1950 | |
Seats | One |
Created from | Leicester |
Replaced by | Leicester South East Leicester North East |
Leicester East is a constituency [n 1] represented in the House of Commons of the UK Parliament since December 2019 by Claudia Webbe, who was elected as a Labour MP, but now sits as an Independent due to her suspension and subsequent expulsion from the party in November 2021 after she was convicted of harassment. [2] [3]
1918–1950: The County Borough of Leicester wards of Belgrave, Latimer, Spinney Hill, and West Humberstone.
1974–1983: The County Borough of Leicester wards of Belgrave, Charnwood, Evington, Humberstone, and Latimer.
1983–2010: The City of Leicester wards of Belgrave, Charnwood, Coleman, Evington, Humberstone, Latimer, Rushey Mead, Thurncourt, and West Humberstone.
2010–2024: The City of Leicester wards of Belgrave, Charnwood 1, Coleman, Evington, Humberstone & Hamilton, Latimer, Rushey Mead, and Thurncourt.
1 Further to a local government boundary review which became effective in May 2015, [4] the newly created Troon ward replaced the old Charnwood ward covering the Northfields Estate and the adjacent Industrial Estate Area to the north, of which it takes its name.
Following the 2023 Periodic Review of Westminster constituencies, which came into effect for the 2024 general election, the constituency was adjusted slightly to bring the electorate within the permitted range by transferring polling district EVF in Evington ward to Leicester South. [5]
This is an urban seat in the commercial and engineering centre of Leicester. The seat excludes the heart of the city centre, skirting its tightly planned ring road. A golf course is situated in the southeast and a large municipal garden in the northwest of the boundaries.
Leicester East has an extremely high South Asian population. Almost a third of the population are Hindu and the majority of others of Asian ethnicity are of Muslim or Sikh faiths. Those of mixed ethnicities are gradually increasing – to 3.1% of the population in 2011.
The bulk of the eastern outskirts are relatively compact and much of the remainder of the county by the 21st century has become transformed economically into a retirement and commuter belt for the city and its railway links. The division's south-west quarter is within normal walking distance of all parts of Leicester City Centre and the seat is served by buses and cycle routes into the city centre.
Leicester East | |
---|---|
Racial makeup (2021) [6] | |
• Asian | 68.6% |
• White | 20.3% |
• Other | 4.1% |
• Black | 4.1% |
• Mixed | 2.9% |
The seat was created in 1918 and for the next four years was served by Sir Gordon Hewart KC, who resigned to become Lord Chief Justice of England and Wales. In 1950 the area was divided between Leicester North East and Leicester South East, which also covered part of the present Charnwood seat and Rutland and Melton.
The constituency was re-created in 1974.
Leicester East has been won by the Labour Party's candidate in 10 of 11 elections since it was re-created. Its MP from 1987 to 2019, Keith Vaz, won an absolute majority of votes from the 1992 general election onward. The 2015 result made the seat the 37th-safest of Labour's 232 seats by percentage majority. [7] Leicester East was narrowly won by Conservative candidate Peter Bruinvels at the height of his party's popularity in 1983; [n 2] the following election saw Labour's Keith Vaz regain the seat; he had held it at every election thereafter, and since 1992 had always won by margins of over 20% and 11,000 votes until standing down at the 2019 general election. Vaz won his highest majority ever, 22,428 votes (42.8%), in 2017. In 2019 Labour held the seat with a substantially reduced majority of 6,019, down from 22,428 – a swing of 15%.
The candidate fielded by the Conservative Party has been runner-up in every election save for Bruinvels' win in 1983. The candidate of UKIP for the first time took third place in 2015, her 2010 counterpart having won 1.5% of the vote and the party not having stood before. The pro-UKIP swing between 2010 and 2015 elections, of 7.4%, was less than the national average of 9.5%. Susan Cooper was 1.8% away from second place in 2005, giving the best result of a Liberal Democrat to date, attracting just under one fifth of the vote.
Turnout in the recreated seat has ranged between 78.7% in 1992 to 62.1% in 2001.
Year | Member [8] | Party | |
---|---|---|---|
1918 | Sir Gordon Hewart | Liberal | |
1922 by-election | George Banton | Labour | |
1922 | Arthur Evans | National Liberal | |
1923 | George Banton | Labour | |
1924 | John Loder | Conservative | |
1929 | Frank Wise | Labour | |
1931 | Abraham Lyons | Conservative | |
1945 | Terence Donovan | Labour | |
1950 | constituency abolished | ||
Feb 1974 | constituency recreated | ||
Tom Bradley | Labour | ||
1981 | SDP | ||
1983 | Peter Bruinvels | Conservative | |
1987 | Keith Vaz | Labour | |
2019 | Claudia Webbe | Labour | |
2020 | Independent |
Party | Candidate | Votes | % | ±% | |
---|---|---|---|---|---|
Labour | Rajesh Agrawal [9] | ||||
Liberal Democrats | Zuffar Haq [10] | ||||
Green | Mags Lewis [11] | ||||
Conservative | Shivani Raja [12] | ||||
Reform UK | Raj Solanki [13] | ||||
Independent [n 3] | Claudia Webbe [15] | ||||
Majority | |||||
Turnout |
Party | Candidate | Votes | % | ±% | |
---|---|---|---|---|---|
Labour | Claudia Webbe | 25,090 | 50.8 | –16.2 | |
Conservative | Bhupendra Dave | 19,071 | 38.6 | +14.4 | |
Liberal Democrats | Nitesh Dave | 2,800 | 5.7 | +3.1 | |
Brexit Party | Tara Baldwin | 1,243 | 2.5 | N/A | |
Green | Melanie Wakley | 888 | 1.8 | -0.2 | |
Independent | Sanjay Gogia | 329 | 0.7 | N/A | |
Majority | 6,019 | 12.2 | –30.6 | ||
Turnout | 49,421 | 63.0 | –4.4 | ||
Labour hold | Swing | –15.3 | |||
Party | Candidate | Votes | % | ±% | |
---|---|---|---|---|---|
Labour | Keith Vaz | 35,116 | 67.0 | +5.9 | |
Conservative | Edward Yi He | 12,688 | 24.2 | +1.2 | |
Independent | Sujata Barot | 1,753 | 3.3 | N/A | |
Liberal Democrats | Nitesh Dave | 1,343 | 2.6 | 0.0 | |
Green | Melanie Wakley | 1,070 | 2.0 | –1.1 | |
Independent | Ian Fox | 454 | 0.9 | N/A | |
Majority | 22,428 | 42.8 | +4.6 | ||
Turnout | 52,424 | 67.4 | +3.7 | ||
Labour hold | Swing | +2.3 | |||
Party | Candidate | Votes | % | ±% | |
---|---|---|---|---|---|
Labour | Keith Vaz | 29,386 | 61.1 | +7.4 | |
Conservative | Kishan Devani | 11,034 | 23.0 | –1.5 | |
UKIP | Susanna Steptoe | 4,290 | 8.9 | +7.4 | |
Green | Nimit Jethwa | 1,468 | 3.1 | +1.5 | |
Liberal Democrats | Dave Raval | 1,233 | 2.6 | –11.6 | |
TUSC | Michael Barker | 540 | 1.1 | N/A | |
Independent | Tom Darwood | 117 | 0.2 | N/A | |
Majority | 18,352 | 38.2 | +8.9 | ||
Turnout | 48,599 | 63.7 | –2.1 | ||
Labour hold | Swing | +4.5 | |||
Party | Candidate | Votes | % | ±% | |
---|---|---|---|---|---|
Labour | Keith Vaz | 25,804 | 53.8 | −5.0 | |
Conservative | Jane Hunt | 11,722 | 24.4 | +4.6 | |
Liberal Democrats | Ali Asghar | 6,817 | 14.2 | −2.3 | |
BNP | Colin Gilmore [19] | 1,700 | 3.5 | N/A | |
Green | Mo Taylor [20] | 733 | 1.5 | N/A | |
UKIP | Felicity Ransome | 725 | 1.5 | N/A | |
Unity For Peace And Socialism | Avtar Sadiq | 494 | 1.0 | N/A | |
Majority | 14,082 | 29.3 | –9.6 | ||
Turnout | 47,995 | 65.8 | +3.9 | ||
Labour hold | Swing | −4.8 | |||
Party | Candidate | Votes | % | ±% | |
---|---|---|---|---|---|
Labour | Keith Vaz | 24,015 | 58.1 | +0.5 | |
Conservative | Suella Fernandes | 8,139 | 19.7 | −4.8 | |
Liberal Democrats | Susan Cooper | 7,052 | 17.1 | +4.8 | |
Veritas | Colin Brown | 1,666 | 4.0 | N/A | |
Socialist Labour | Valerie Smalley | 434 | 1.1 | −1.0 | |
Majority | 15,876 | 38.4 | +5.3 | ||
Turnout | 41,306 | 62.2 | +0.1 | ||
Labour hold | Swing | +2.6 | |||
In 2005 this seat bucked the national trend as there was a swing to Labour whereas the national swing was 2.5% to the Conservatives.
Party | Candidate | Votes | % | ±% | |
---|---|---|---|---|---|
Labour | Keith Vaz | 23,402 | 57.6 | −7.9 | |
Conservative | John Mugglestone | 9,960 | 24.5 | +0.5 | |
Liberal Democrats | Harpinder Athwal | 4,989 | 12.3 | +5.3 | |
Socialist Labour | David Roberts | 837 | 2.1 | +1.1 | |
BNP | Clive Potter | 772 | 1.9 | N/A | |
Independent | Shirley Bennett | 701 | 1.7 | +1.5 | |
Majority | 13,442 | 33.1 | –8.4 | ||
Turnout | 40,661 | 62.1 | −7.0 | ||
Labour hold | Swing | –4.2 | |||
Party | Candidate | Votes | % | ±% | |
---|---|---|---|---|---|
Labour | Keith Vaz | 29,083 | 65.50 | +9.2 | |
Conservative | Simon Milton | 10,661 | 24.01 | –9.7 | |
Liberal Democrats | Jay Matabudul | 3,105 | 6.99 | −1.1 | |
Referendum | Philip Iwaniw | 1,015 | 2.29 | N/A | |
Socialist Labour | Sohan Singh Sidhu | 436 | 0.98 | N/A | |
Independent | Neil Slack | 102 | 0.23 | N/A | |
Majority | 18,422 | 41.49 | +18.9 | ||
Turnout | 44,402 | 69.11 | |||
Labour hold | Swing | +9.4 | |||
Party | Candidate | Votes | % | ±% | |
---|---|---|---|---|---|
Labour | Keith Vaz | 28,123 | 56.3 | +10.1 | |
Conservative | Jeffery C. Stevens | 16,807 | 33.7 | −8.8 | |
Liberal Democrats | Sheila A. Mitchell | 4,043 | 8.1 | −3.3 | |
Green | Murray R. Frankland | 453 | 0.9 | N/A | |
Independent | Dennis J. Taylor | 308 | 0.6 | N/A | |
Natural Law | ASK Mahaldar | 186 | 0.4 | N/A | |
Majority | 11,316 | 22.6 | +18.9 | ||
Turnout | 49,920 | 78.7 | +0.1 | ||
Labour hold | Swing | +9.5 | |||
Party | Candidate | Votes | % | ±% | |
---|---|---|---|---|---|
Labour | Keith Vaz | 24,074 | 46.2 | +9.2 | |
Conservative | Peter Bruinvels | 22,150 | 42.5 | +3.6 | |
SDP | Aileen Ayres | 5,935 | 11.4 | –9.7 | |
Majority | 1,924 | 3.7 | N/A | ||
Turnout | 52,159 | 78.59 | |||
Labour gain from Conservative | Swing | ||||
Party | Candidate | Votes | % | ±% | |
---|---|---|---|---|---|
Conservative | Peter Bruinvels | 19,117 | 38.9 | –2.3 | |
Labour | Patricia Hewitt | 18,184 | 37.0 | –9.9 | |
SDP | Tom Bradley | 10,362 | 21.1 | N/A | |
Independent | RV Ganatra | 970 | 2.0 | N/A | |
BNP | RL Sutton | 459 | 0.9 | N/A | |
Majority | 933 | 1.9 | N/A | ||
Turnout | 49,092 | 73.2 | –2.4 | ||
Conservative gain from Labour | Swing | +3.8 | |||
Party | Candidate | Votes | % | ±% | |
---|---|---|---|---|---|
Labour | Tom Bradley | 23,844 | 46.9 | +2.1 | |
Conservative | M Waterhouse | 20,988 | 41.3 | +4.8 | |
Liberal | B Andrews | 4,623 | 9.1 | –3.2 | |
National Front | BJ Calver | 1,385 | 2.7 | –3.7 | |
Majority | 2,856 | 5.6 | –2.6 | ||
Turnout | 50,840 | 75.6 | +3.3 | ||
Labour hold | Swing | +1.4 | |||
Party | Candidate | Votes | % | ±% | |
---|---|---|---|---|---|
Labour | Tom Bradley | 20,688 | 44.8 | +0.1 | |
Conservative | KG Reeves | 16,877 | 36.5 | –8.3 | |
Liberal | W Capstick | 5,668 | 12.3 | N/A | |
National Front | A Reed-Herbert | 2,967 | 6.4 | −1.1 | |
Majority | 3,811 | 8.3 | +5.4 | ||
Turnout | 46,200 | 72.3 | –5.5 | ||
Labour hold | Swing | +4.2 | |||
Party | Candidate | Votes | % | ±% | |
---|---|---|---|---|---|
Labour | Tom Bradley | 23,474 | 47.7 | N/A | |
Conservative | K.G. Reeves | 22,061 | 44.8 | N/A | |
National Front | K. Sanders | 3,662 | 7.5 | N/A | |
Majority | 1,413 | 2.9 | N/A | ||
Turnout | 49,199 | 77.8 | N/A | ||
Labour win (new seat) |
Party | Candidate | Votes | % | ±% | |
---|---|---|---|---|---|
Labour | Terence Donovan | 28,414 | 56.94 | ||
Conservative | Abraham Lyons | 15,182 | 30.42 | ||
Liberal | David Goodwillie Galloway | 6,306 | 12.64 | ||
Majority | 13,232 | 26.52 | N/A | ||
Turnout | 49,902 | 76.05 | |||
Labour gain from Conservative | Swing | ||||
Party | Candidate | Votes | % | ±% | |
---|---|---|---|---|---|
Conservative | Abraham Lyons | 20,442 | 49.28 | ||
Labour | Frederick Gould | 17,532 | 42.62 | ||
Liberal | Frederick Lawson | 3,509 | 8.46 | N/A | |
Majority | 2,910 | 6.66 | |||
Turnout | 41,483 | 70.18 | |||
Conservative hold | Swing | ||||
Party | Candidate | Votes | % | ±% | |
---|---|---|---|---|---|
Conservative | Abraham Lyons | 30,265 | 68.67 | ||
Labour | Frank Wise | 13,811 | 31.33 | ||
Majority | 16,454 | 37.34 | N/A | ||
Turnout | 44,076 | 79.10 | |||
Conservative gain from Labour | Swing | ||||
Party | Candidate | Votes | % | ±% | |
---|---|---|---|---|---|
Labour | Frank Wise | 22,533 | 50.8 | +1.5 | |
Unionist | John Loder | 13,801 | 31.1 | −19.6 | |
Liberal | Frederick Lawson | 8,054 | 18.1 | N/A | |
Majority | 8,732 | 19.7 | N/A | ||
Turnout | 44,388 | 81.6 | +2.0 | ||
Registered electors | 54,364 | ||||
Labour gain from Unionist | Swing | +1.6 | |||
Party | Candidate | Votes | % | ±% | |
---|---|---|---|---|---|
Unionist | John Loder | 16,090 | 50.7 | +22.7 | |
Labour | George Banton | 15,669 | 49.3 | +4.5 | |
Majority | 421 | 1.4 | N/A | ||
Turnout | 31,759 | 79.6 | +3.5 | ||
Registered electors | 39,906 | ||||
Unionist gain from Labour | Swing | +9.1 | |||
Party | Candidate | Votes | % | ±% | |
---|---|---|---|---|---|
Labour | George Banton | 13,162 | 44.8 | −2.9 | |
Unionist | Arthur Evans | 8,247 | 28.0 | N/A | |
Liberal | James Henderson-Stewart | 7,998 | 27.2 | −25.1 | |
Majority | 4,915 | 16.8 | N/A | ||
Turnout | 29,407 | 76.1 | −0.8 | ||
Registered electors | 38,658 | ||||
Labour gain from National Liberal | Swing | +11.1 | |||
Party | Candidate | Votes | % | ±% | |
---|---|---|---|---|---|
National Liberal | Arthur Evans | 15,164 | 52.3 | N/A | |
Labour | George Banton | 13,850 | 47.7 | +20.6 | |
Majority | 1,314 | 4.6 | N/A | ||
Turnout | 29,014 | 76.9 | +11.3 | ||
Registered electors | 37,749 | ||||
National Liberal gain from Liberal | Swing | N/A | |||
Party | Candidate | Votes | % | ±% | |
---|---|---|---|---|---|
Labour | George Banton | 14,062 | 52.9 | +25.8 | |
National Liberal | Albert E. Marlow | 8,710 | 32.7 | −40.2 | |
Liberal | Ronald Wilberforce Allen | 3,825 | 14.4 | N/A | |
Majority | 5,352 | 20.2 | N/A | ||
Turnout | 26,597 | 71.3 | +5.7 | ||
Registered electors | 37,319 | ||||
Labour gain from National Liberal | Swing | +33.0 | |||
Party | Candidate | Votes | % | ±% | |
---|---|---|---|---|---|
C | Liberal | Gordon Hewart | 18,024 | 72.9 | |
Labour | George Banton | 6,697 | 27.1 | ||
Majority | 11,327 | 45.8 | |||
Turnout | 24,721 | 65.6 | |||
Registered electors | 37,687 | ||||
Liberal win (new seat) | |||||
Cindicates candidate endorsed by the coalition government. |
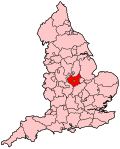
Leicester South is a constituency, recreated in 1974, represented in the House of Commons of the UK Parliament since 2011 by Jonathan Ashworth of the Labour Co-op Party. A previous version of the seat existed between 1918 and 1950. Except for a 2004 by-election when it was won by the Liberal Democrats, Leicester South has been held by the Labour Party since 1987.
Southampton Test is a constituency represented in the House of Commons of the UK Parliament since 1997 by Alan Whitehead, a member of the Labour Party.
Rutland and Melton was a county constituency spanning Leicestershire and Rutland, represented in the House of Commons of the Parliament of the United Kingdom from 1983 to 2024. It elected one Member of Parliament (MP) by the first-past-the-post system of election. For its entire existence, the seat elected members of the Conservative Party.
Bolton North East is a constituency represented in the House of Commons of the UK Parliament since 2019 by Mark Logan, an MP who defected to the Labour Party in May 2024.
Brighton Kemptown is a constituency represented in the House of Commons of the UK Parliament since 2017 by Lloyd Russell-Moyle, an Independent, after being suspended by the Labour Party in May 2024. The seat is often referred to as Brighton Kemptown and Peacehaven by local political parties, and will formally adopt that name following the 2024 general election.
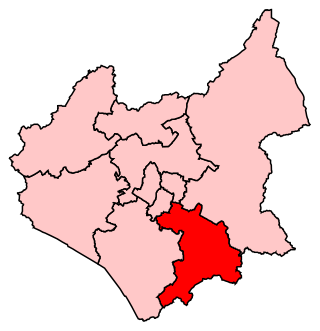
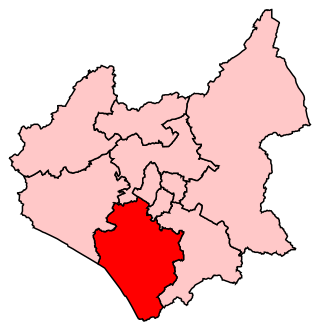
Harborough is a constituency covering the south east of Leicestershire represented in the House of Commons of the UK Parliament since 2017 by Neil O'Brien of the Conservative Party.
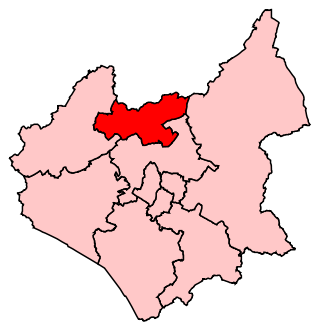
Charnwood was a constituency of the House of Commons in the UK Parliament from 1997 to 2024.
North East Derbyshire is a constituency created in 1885 represented in the House of Commons of the UK Parliament since 2017 by Lee Rowley of the Conservative Party. This was the first time a Conservative candidate had been elected since 1935.
Loughborough is a constituency in Leicestershire represented in the House of Commons of the UK Parliament since 2019 by Jane Hunt, a Conservative. From 2010 until 2019, it was represented by Nicky Morgan, who served in the governments of David Cameron and Boris Johnson. In 2020, she was elevated to the Peerage and became a member of the House of Lords. The constituency is a considered a bellwether, as it has reflected the national result at every general election since February 1974.
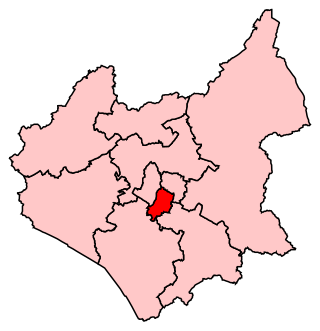
Leicester West is a constituency represented in the House of Commons of the UK Parliament since 2010 by Liz Kendall of the Labour Party. Along with the other two Leicester seats, it was held by Labour at the 2017 general election. Since its creation in 1918 the seat has sided with parties from the left wing of politics.
Stoke-on-Trent South is a constituency created in 1950, and represented in the House of Commons of the UK Parliament since 2017 by Jack Brereton, a Conservative. The local electorate returned a Labour MP in every election until 2017, when Brereton became its first Conservative MP. The seat is non-rural and in the upper valley of the Trent covering half of the main city of the Potteries, a major ceramics centre since the 17th century.
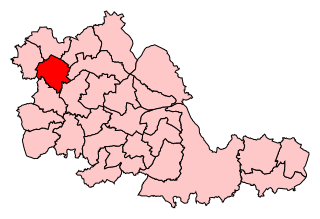
Wolverhampton South East is a borough constituency represented in the House of Commons of the Parliament of the United Kingdom. It elects one Member of Parliament (MP) by the first past the post system of election.
Erith and Thamesmead is a constituency created in 1997 and represented in the House of Commons of the UK Parliament since 2019 by Abena Oppong-Asare of the Labour Party.
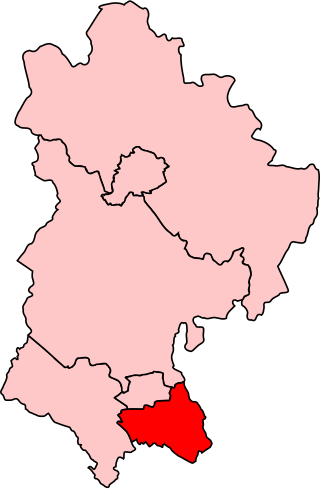
Luton South is a constituency in Bedfordshire represented in the House of Commons of the UK Parliament since 2019 by Rachel Hopkins, a member of the Labour Party.
Stevenage is a constituency in Hertfordshire represented in the House of Commons of the UK Parliament since 2010 by Stephen McPartland, a member of the Conservative Party.
Greenwich and Woolwich is a constituency represented in the House of Commons of the UK Parliament since 2015 by Matthew Pennycook of the Labour Party.
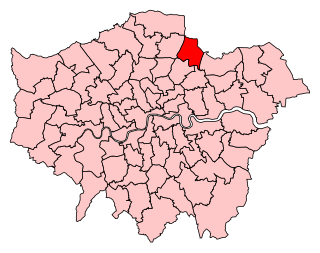
Chingford and Woodford Green is a constituency in North East London represented in the House of Commons of the UK Parliament by Sir Iain Duncan Smith of the Conservative Party since its creation in 1997.
South Leicestershire is a constituency represented in the House of Commons of the UK Parliament since 2015 by Alberto Costa, a member of the Conservative Party.
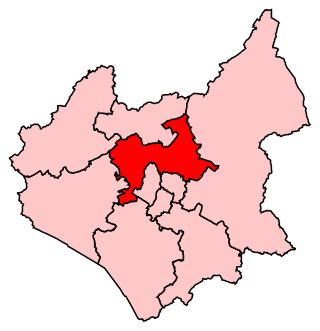
Mid Leicestershire is a constituency of the House of Commons in the UK Parliament. It will first be contested at the 2024 general election.