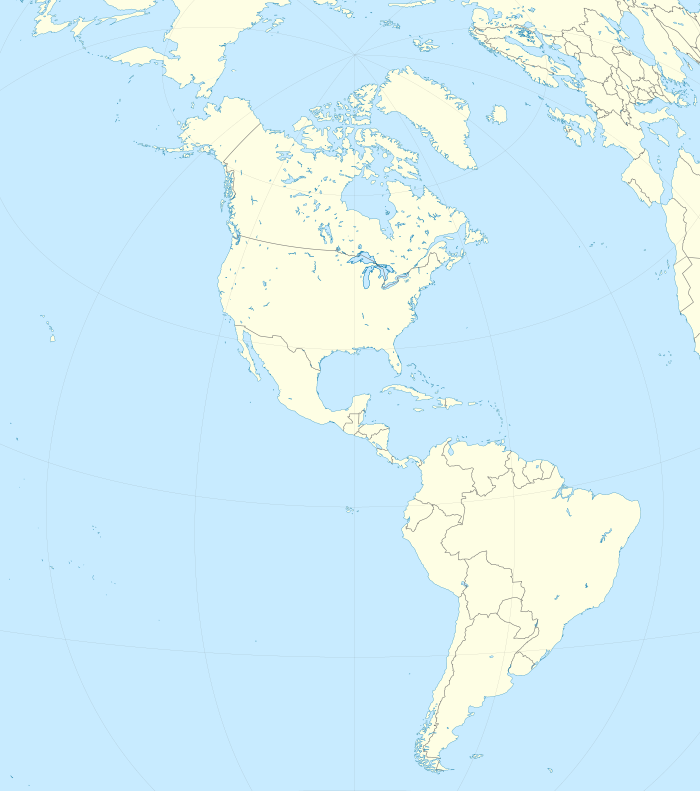
Map
The countries and territories have a net average monthly salary of:
Purple | above $3,000 |
Blue | $1,000 to $2,999 |
Green | $500 to $999 |
Yellow | below $500 |
This is the map and list of American countries by monthly net (after taxes) average wage. The chart below reflects the average (mean) wage as reported by various data providers. The salary distribution is right-skewed, therefore more than 50% of people earn less than the average net salary. These figures have been shrunk after the application of the income tax. In certain countries, actual incomes may exceed those listed in the table due to the existence of grey economies. In some countries, social security, contributions for pensions, public schools, and health are included in these taxes.
The countries and territories have a net average monthly salary of:
Purple | above $3,000 |
Blue | $1,000 to $2,999 |
Green | $500 to $999 |
Yellow | below $500 |
| State | Gross (Local Currency) | Net (Local Currency) | Net (US$) |
|---|---|---|---|
| | CAD 6,218 [1] | CAD 4,420 [2] | $3,204 |
| | DKK 58,141 [3] | DKK 32,559 [4] | $4,665 |
| | USD 6,539 [5] | USD 4,838 [6] | $4,838 |
| State | Net (Local Currency) | Net (US$) |
|---|---|---|
| | ARS 148,343 | $425 [7] |
| | BSD 1,858 [8] | $1,864 |
| | BZD 952 [9] | $474 |
| | BOB 2,749 [10] | $397 |
| | BRL 2,082 [11] | $423 |
| | CLP 555,858 [12] | $609 |
| | COP 1,390,853 [13] | $345 |
| | CRC 453,282 [14] | $847 |
| | XCD 1,167 [15] | $432 |
| | DOP 22,984 [16] | $404 |
| | USD 514 [17] | $514 |
| | USD 425 | $425 [18] |
| | GTQ 3,838 [19] | $491 |
| | GYD 89,883 [20] | $430 |
| | JMD 102,551 [21] | $656 |
| | MXN 12,805 [22] | $725 |
| | NIO 9,590 | $263 [23] |
| | PAB 783 | $783 [24] |
| | PYG 2,473,778 [25] | $332 |
| | PEN 1,419 [26] | $373 |
| | USD 2,210 [27] | $2,210 |
| | SRD 10,348 | $273 [28] |
| | UYU 44,746 [29] | $1,122 |

Gross domestic product (GDP) is a monetary measure of the market value of all the final goods and services produced in a specific time period by a country or countries. GDP is most often used by the government of a single country to measure its economic health. Due to its complex and subjective nature, this measure is often revised before being considered a reliable indicator.

Per capita income (PCI) or average income measures the average income earned per person in a given area in a specified year.
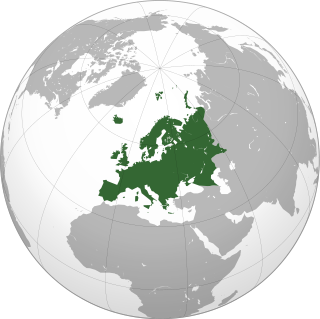
This page compares the sovereign states of Europe on economic, financial and social indicators.
Household income is a measure of the combined incomes of all people sharing a particular household or place of residence. It includes every form of income, e.g., salaries and wages, retirement income, near cash government transfers like food stamps, and investment gains.
Income in India discusses the financial state in India. With rising economic growth and prosperity, India's income is also rising rapidly. As an overview, India's per capita net national income or NNI was around 1.97 lakh rupees in 2022. The per-capita income is a crude indicator of the prosperity of a country. In contrast, the gross national income at constant prices stood at over 128 trillion rupees. The same year, GRI growth rate at constant prices was around 6.6 percent. While GNI and NNI are both indicators for a country's economic performance and welfare, the GNI is related to the GDP or the Gross Domestic Product plus the net receipts from abroad, including wages and salaries, property income, net taxes and subsidies receivable from abroad. On the other hand, the NNI of a country is equal to its GNI net of depreciation.
This is a comparison between Argentine provinces and countries by gross domestic product (PPP) per capita. All data is for the year 2008.