Economy of Nicaragua

Last updated

Economy of Nicaragua
Managuani.jpg
Currency Nicaraguan córdoba (NIO, C$)
Calendar year
Trade organizations
WTO, CAFTA-DR
Country group
Statistics
PopulationIncrease2.svg 6.75 million (2024) [3]
GDP
  • Increase2.svg $18.83 billion (nominal, 2024) [3]
  • Increase2.svg $54.89 billion (PPP, 2024) [3]
GDP rank
GDP growth
Increase2.svg3.5% (2024 est.) [3]
GDP per capita
  • Increase2.svg $2,599 (nominal, 2024) [3]
  • Increase2.svg $7,642 (PPP, 2024) [3]
GDP per capita rank
GDP by sector
Decrease Positive.svg 5% (2024) [3]
Population below poverty line
Decrease Positive.svg 24.9% (2016 est.) [4]
Steady2.svg 46.2 high (2022 est.) [5]
Labor force
  • Increase2.svg 3,264,024 (2023 est.) [8]
  • Increase2.svg 62.4% (2023 est.) [9]
Labor force by occupation
UnemploymentDecrease Positive.svg 6.8% (2024) [3]
Main industries
food processing, chemicals, machinery and metal products, knit and woven apparel, petroleum refining and distribution, beverages, footwear, wood, electric wire harness manufacturing, mining
External
ExportsIncrease2.svg $6.95 billion (2021) [10]
Export goods
coffee, beef, gold, sugar, peanuts, shrimp and lobster, tobacco, cigars, automobile wiring harnesses, textiles, apparel
Main export partners
ImportsIncrease2.svg $8.65 billion (2021) [11]
Import goods
consumer goods, machinery and equipment, raw materials, petroleum products
Main import partners
FDI stock
  • Steady2.svg N/A
  • Steady2.svg Abroad: N/A
Increase2.svg −$694 million (2017 est.) [4]
Increase Negative.svg $11.31 billion (31 December 2017 est.) [4]
Public finances
Increase Negative.svg 33.3% of GDP (2017 est.) [4] [note 1]
−2% (of GDP) (2017 est.) [4]
Revenues3.871 billion (2017 est.) [4]
Expenses4.15 billion (2017 est.) [4]
Increase2.svg $2.758 billion (31 December 2017 est.) [4]
Main data source: CIA World Fact Book
All values, unless otherwise stated, are in US dollars.

The economy of Nicaragua is focused primarily on the agricultural sector. Nicaragua itself is the least developed country in Central America, and the second poorest in the Americas by nominal GDP. In recent years, under the administrations of Daniel Ortega, the Nicaraguan economy has expanded somewhat, following the Great Recession, when the country's economy actually contracted by 1.5%, due to decreased export demand in the American and Central American markets, lower commodity prices for key agricultural exports, and low remittance growth. The economy saw 4.5% growth in 2010 thanks to a recovery in export demand and growth in its tourism industry. [12] Nicaragua's economy continues to post growth, with preliminary indicators showing the Nicaraguan economy growing an additional 5% in 2011. [13] Consumer Price inflation have also curtailed since 2008, when Nicaragua's inflation rate hovered at 19.82%. [14] In 2009 and 2010, the country posted lower inflation rates, 3.68% and 5.45%, respectively. [14] Remittances are a major source of income, equivalent to 15% of the country's GDP, which originate primarily from Costa Rica, the United States, and European Union member states. Approximately one million Nicaraguans contribute to the remittance sector of the economy.

Contents

In early 2004, Nicaragua secured some $4.5 billion in foreign debt reduction under the International Monetary Fund and World Bank Heavily Indebted Poor Countries initiative. In April 2006, the US-Central America Free Trade Agreement went into effect, expanding export opportunities for Nicaragua's agricultural and manufactured goods. Textiles and apparel account for nearly 60% of Nicaragua's exports. In October 2007, the IMF approved an additional poverty reduction and growth facility program in support of the government's economic plans. Nicaragua relies on international economic assistance to meet internal- and external-debt financing obligations, although foreign donors curtailed this funding in response to widespread allegations of electoral fraud in Nicaragua's November 2008 elections.

Economic history

Nicaragua inflation rate 1980-1993 Nicaragua inflation rate 1980-1993.webp
Nicaragua inflation rate 1980-1993

Nicaragua's economy was devastated in the 1980s by the Contra War, which saw the destruction of much of the country's infrastructure. At the same time, the US staged an economic blockade from 1985 onward.

Following the civil war, Nicaragua began free market reforms, privatizing more than 350 state companies and commencing a general trend of economic growth. Inflation has been reduced from 33,603% during the later years of the Sandinista period and 55,000% during the first year of the Chamorro government to more normal levels, averaging an annual rate of 9.5% over the 2000-2010 decade (based on World Bank figures).

Growth was slow (3%) in 2001 due to a combination of factors (a global recession, a series of bank failures, low coffee prices, and a drought), and in 2009 the economy actually contracted 1.5% in reaction to the 2008–2012 global recession). But even with the recessions, growth has averaged 3.4% between 2001 and 2011 (based on World Bank figures).

Economy

Unemployment was 6.4%. [15] Nicaragua suffers from persistent trade and budget deficits and a high debt-service burden, leaving it highly dependent on foreign assistance—which represented almost 25% of GDP in 2001.

One of the key engines of economic growth has been production for export. Although traditional products such as coffee, meat, and sugar continued to lead the list of Nicaraguan exports, the fastest growth is now in nontraditional exports: textile and apparel; gold; seafood; and new agricultural products such as peanuts, sesame, melons, and onions. In 2007, exports topped US$1 billion for the first time in Nicaraguan history. [16]

Nicaragua is primarily an agricultural country, but construction, mining, fisheries, and general commerce also have been expanding during the last few years. Foreign private capital inflows topped $300 million in 1999 but, due to economic and political uncertainty, fell to less than $100 million in 2001. In the last 12 years, tourism has grown 394%, [17] the rapid growth has led it to become Nicaragua's second largest source of foreign capital. Less than three years ago, the nation's tourism budget was U.S. $400,000; today, it is over $2 million. [17] Nicaragua's economy has also produced a construction boom, [18] the majority of which is in and around Managua.

Nicaragua faces a number of challenges in stimulating rapid economic growth. An International Monetary Fund (IMF) program is currently being followed, with the aim of attracting investment, creating jobs, and reducing poverty by opening the economy to foreign trade. This process was boosted in late 2000 when Nicaragua reached the decision point under the Heavily Indebted Poor Countries (HIPC) debt relief initiative. However, HIPC benefits were delayed because Nicaragua subsequently fell "off track" from its IMF program. The country also has been grappling with a string of bank failures that began in August 2000. Moreover, Nicaragua continues to lose international reserves due to its growing fiscal deficits.

The country is still a recovering economy and it continues to implement further reforms, on which aid from the IMF is conditional. In 2005, finance ministers of the leading eight industrialized nations (G8) agreed to forgive some of Nicaragua's foreign debt, as part of the HIPC program. According to the World Bank Nicaragua's GDP was around $4.9 US billion dollars. Recently, in March 2007, Poland and Nicaragua signed an agreement to write off $30.6 million which was borrowed by the Nicaraguan government in the 1980s. [19]

The U.S. is the country's largest trading partner, providing 25% of Nicaragua's imports and receiving about 60% of its exports. About 25 wholly or partly owned subsidiaries of U.S. companies operate in Nicaragua. The largest of those operations are in the energy, communications, manufacturing, fisheries, and shrimp farming sectors. Opportunities exist for expanded foreign investments in those sectors, as well as in tourism, mining, franchising, and the distribution of imported consumer, manufacturing, and agricultural goods. There also are copper mines in northeastern Nicaragua.

Gross Domestic Product (GDP) in purchasing power parity (PPP) in 2012 was estimated at US$20.04 billion, and GDP per capita in PPP at US$3,300, making Nicaragua the second poorest country in the Western Hemisphere. [20] The service sector is the largest component of GDP at 56.7%, followed by the industrial sector at 25.8%(2012). Agriculture represents 17.5% of GDP and it's the largest percentage in a Central American country. Nicaraguan labor force is estimated at 2.961 million of which 28% is occupied in agriculture, 19% in the industry sector and 53% in the service sector (2012).

Agriculture and food production

Food and agriculture
ProductWorld rank1
Coffee, green4
Beans, Dry17
Groundnuts in Shell30
Indigenous cattle meat30
Plantains32
Sesame Seed32
Sugar Cane32
Pineapples33
Castor Beans37
Cocoa beans41
Cassava48
Oranges49
Soybeans50
1Source: FAO (2005) Major Food and Agricultural Commodities and Producers

Coffee became Nicaragua's principal crop in the 1870s, a position it still held in 1992 despite the growing importance of other crops. Cotton gained importance in the late 1940s, and in 1992 was the second biggest export earner. In the early 20th century, Nicaraguan governments were reluctant to give concessions to the large United States banana companies, and bananas never attained the level of prominence in Nicaragua that they reached in Nicaragua's Central American neighbors; bananas were grown in the country, however, and were generally the third largest export earner in the post-World War II period. Beef and animal byproducts, the most important agricultural export for the three centuries before the coffee boom of the late 19th century, were still important commodities in 1992.

From the end of World War II to the early 1960s, the growth and diversification of the agricultural sector drove the nation's economic expansion. From the early 1960s until the increased fighting in 1977 caused by the Sandinista revolution, agriculture remained a robust and significant part of the economy, although its growth slowed somewhat in comparison with the previous postwar decades. Statistics for the next fifteen years, however, show stagnation and then a drop in agricultural production.

The agricultural sector declined precipitously in the 1980s. Until the late 1970s, Nicaragua's agricultural export system generated 40 percent of the country's GDP, 60 percent of national employment, and 80 percent of foreign exchange earnings. Throughout the 1980s, the Contras destroyed or disrupted coffee harvests as well as other key income-generating crops. Private industry stopped investing in agriculture because of uncertain returns. Land was taken out of production of export crops to expand plantings of basic grain. Many coffee plants succumbed to disease.

In 1989, the fifth successive year of decline, farm production declined by roughly 7 percent in comparison with the previous year. Production of basic grains fell as a result of Hurricane Joan in 1988 and a drought in 1989. By 1990 agricultural exports had declined to less than half the level of 1978. The only bright spot was the production of nontraditional export crops such as sesame, tobacco, and African palm oil.

Services

The service sector was estimated to account for 56.8% of the country's GDP, and employs 52% of the active population. [20] This section includes transportation, commerce, warehousing, restaurant and hotels, arts and entertainment, health, education, financial and banking services, telecommunications as well as public administration and defense.

Tourism in Nicaragua is one of the most important industries in the country. It is the second largest source of foreign exchange for the country and is predicted to become the first largest industry in 2007. [21] The growth in tourism has positively affected the agricultural, commercial, finance, and construction industries as well.

Current economic outlook

Nicaragua has ratified Free Trade Agreements with major markets such as the United States, the Dominican Republic (DR-CAFTA), Taiwan and Mexico, among others. As evidence of continuous efforts in improving the business climate, Nicaragua has been ranked favorably in a variety of independent evaluations.

The 2011 Doing Business Report, published by The World Bank Group, a report that benchmarks various indicators of the investment climate in 183 nations, ranked Nicaragua as the top location in Central America in starting a business, investor protection, and closing a business. Additionally, the country improved in the following categories: ease of doing business, registering property, paying taxes, trading across borders, and enforcing contracts.

Data

The following table shows the main economic indicators in 1980–2020 (with IMF staff stimtates in 2021–2026). Inflation below 5% is in green. [22]

YearGDP

(in Bil. US$PPP)

GDP per capita

(in US$ PPP)

GDP

(in Bil. US$nominal)

GDP per capita

(in US$ nominal)

GDP growth

(real)

Inflation rate

(in Percent)

Unemployment

(in Percent)

Government debt

(in % of GDP)

19806.2n/a1.8n/aIncrease2.svg4.6%Increase Negative.svg35.1%13.4%n/a
1981Increase2.svg7.1n/aIncrease2.svg2.2n/aIncrease2.svg5.4%Increase Negative.svg23.8%Decrease Positive.svg11.8%n/a
1982Increase2.svg7.5n/aIncrease2.svg2.5n/aDecrease2.svg-0.8%Increase Negative.svg28.5%Increase Negative.svg12.4%n/a
1983Increase2.svg8.2n/aIncrease2.svg2.9n/aIncrease2.svg4.6%Increase Negative.svg33.6%Decrease Positive.svg11.0%n/a
1984Increase2.svg8.3n/aIncrease2.svg4.0n/aDecrease2.svg-1.6%Increase Negative.svg141.3%Increase Negative.svg12.0%n/a
1985Decrease2.svg8.2n/aDecrease2.svg3.9n/aDecrease2.svg-4.1%Increase Negative.svg571.4%Increase Negative.svg12.5%n/a
1986Increase2.svg8.3n/aIncrease2.svg5.8n/aDecrease2.svg-1.0%Increase Negative.svg885.2%Increase Negative.svg13.1%n/a
1987Increase2.svg8.5n/aDecrease2.svg3.4n/aDecrease2.svg-0.7%Increase Negative.svg13,109.5%Increase Negative.svg14.0%n/a
1988Decrease2.svg7.7n/aDecrease2.svg1.5n/aDecrease2.svg-12.4%Increase Negative.svg4,775.2%Increase Negative.svg14.2%n/a
1989Increase2.svg7.8n/aIncrease2.svg2.1n/aDecrease2.svg-1.7%Increase Negative.svg7,428.7%Increase Negative.svg15.0%n/a
1990Increase2.svg8.1n/aDecrease2.svg0.5n/aDecrease2.svg-0.1%Increase Negative.svg3,004.1%Increase Negative.svg15.5%n/a
1991Increase2.svg8.4n/aIncrease2.svg3.7n/aDecrease2.svg-0.2%Increase Negative.svg116.6%Decrease Positive.svg14.9%n/a
1992Increase2.svg8.6n/aIncrease2.svg3.9n/aIncrease2.svg0.4%Increase Negative.svg21.9%Decrease Positive.svg14.4%n/a
1993Increase2.svg8.8n/aDecrease2.svg3.7n/aDecrease2.svg-0.4%Increase Negative.svg13.5%Increase Negative.svg15.0%n/a
1994Increase2.svg9.42,191.5Increase2.svg3.9898.2Increase2.svg5.0%Increase2.svg3.7%Increase Negative.svg17.1%n/a
1995Increase2.svg10.2Increase2.svg2,301.4Increase2.svg4.1Increase2.svg935.3Increase2.svg5.9%Increase Negative.svg11.1%Decrease Positive.svg16.9%n/a
1996Increase2.svg11.0Increase2.svg2,425.3Increase2.svg4.3Increase2.svg947.1Increase2.svg6.3%Increase Negative.svg11.7%Decrease Positive.svg16.0%n/a
1997Increase2.svg11.7Increase2.svg2,498.7Increase2.svg4.4Decrease2.svg940.1Increase2.svg4.0%Increase Negative.svg9.2%Decrease Positive.svg14.3%86.4%
1998Increase2.svg12.2Increase2.svg2,568.9Increase2.svg4.6Increase2.svg973.1Increase2.svg3.7%Increase Negative.svg13.0%Decrease Positive.svg13.2%Increase Negative.svg86.5%
1999Increase2.svg13.3Increase2.svg2,733.8Increase2.svg4.9Increase2.svg999.4Increase2.svg7.0%Increase Negative.svg11.2%Decrease Positive.svg10.7%Increase Negative.svg99.8%
2000Increase2.svg14.1Increase2.svg2,852.6Increase2.svg5.1Increase2.svg1,030.7Increase2.svg4.1%Increase Negative.svg11.5%Decrease Positive.svg9.8%Decrease Positive.svg95.2%
2001Increase2.svg14.9Increase2.svg2,942.9Increase2.svg5.3Increase2.svg1,054.7Increase2.svg3.0%Increase Negative.svg7.4%Decrease Positive.svg6.4%Decrease Positive.svg87.5%
2002Increase2.svg15.2Increase2.svg2,950.8Decrease2.svg5.2Decrease2.svg1,011.9Increase2.svg0.8%Increase2.svg3.8%Increase Negative.svg12.2%Increase Negative.svg110.4%
2003Increase2.svg15.9Increase2.svg3,023.2Increase2.svg5.3Decrease2.svg1,010.2Increase2.svg2.5%Increase Negative.svg5.3%Decrease Positive.svg7.0%Decrease Positive.svg109.5%
2004Increase2.svg17.2Increase2.svg3,204.1Increase2.svg5.8Increase2.svg1,077.8Increase2.svg5.3%Increase Negative.svg8.5%Decrease Positive.svg6.5%Decrease Positive.svg84.0%
2005Increase2.svg18.5Increase2.svg3,377.8Increase2.svg6.3Increase2.svg1,152.8Increase2.svg4.3%Increase Negative.svg9.6%Decrease Positive.svg5.6%Decrease Positive.svg66.6%
2006Increase2.svg19.8Increase2.svg3,588.9Increase2.svg6.8Increase2.svg1,224.7Increase2.svg3.8%Increase Negative.svg9.1%Decrease Positive.svg5.2%Decrease Positive.svg51.2%
2007Increase2.svg21.4Increase2.svg3,822.5Increase2.svg7.4Increase2.svg1,326.7Increase2.svg5.1%Increase Negative.svg11.1%Increase Negative.svg5.9%Decrease Positive.svg30.9%
2008Increase2.svg22.5Increase2.svg3,977.5Increase2.svg8.5Increase2.svg1,498.9Increase2.svg3.4%Increase Negative.svg19.8%Increase Negative.svg6.1%Decrease Positive.svg26.0%
2009Decrease2.svg21.9Decrease2.svg3,821.7Decrease2.svg8.3Decrease2.svg1,444.9Decrease2.svg-3.3%Increase2.svg3.7%Increase Negative.svg8.2%Increase Negative.svg29.3%
2010Increase2.svg23.2Increase2.svg3,987.4Increase2.svg8.8Increase2.svg1,506.1Increase2.svg4.4%Increase Negative.svg5.5%Decrease Positive.svg7.8%Increase Negative.svg30.3%
2011Increase2.svg25.2Increase2.svg4,196.7Increase2.svg9.8Increase2.svg1,630.0Increase2.svg6.3%Increase Negative.svg8.1%Decrease Positive.svg5.9%Decrease Positive.svg28.8%
2012Increase2.svg26.5Increase2.svg4,363.4Increase2.svg10.5Increase2.svg1,734.8Increase2.svg6.5%Increase Negative.svg7.2%Decrease Positive.svg5.9%Decrease Positive.svg27.9%
2013Increase2.svg28.0Increase2.svg4,556.3Increase2.svg11.0Increase2.svg1,790.4Increase2.svg4.9%Increase Negative.svg7.1%Decrease Positive.svg5.7%Increase Negative.svg28.8%
2014Increase2.svg30.4Increase2.svg4,897.5Increase2.svg11.9Increase2.svg1,916.8Increase2.svg4.8%Increase Negative.svg6.0%Increase Negative.svg6.6%Decrease Positive.svg28.7%
2015Increase2.svg32.9Increase2.svg5,260.5Increase2.svg12.8Increase2.svg2,036.9Increase2.svg4.8%Increase2.svg4.0%Decrease Positive.svg5.9%Increase Negative.svg28.9%
2016Increase2.svg35.9Increase2.svg5,672.5Increase2.svg13.3Increase2.svg2,099.6Increase2.svg4.6%Increase2.svg3.5%Decrease Positive.svg4.5%Increase Negative.svg30.9%
2017Increase2.svg38.3Increase2.svg5,995.6Increase2.svg13.8Increase2.svg2,156.1Increase2.svg4.6%Increase2.svg3.9%Decrease Positive.svg3.7%Increase Negative.svg34.1%
2018Decrease2.svg37.9Decrease2.svg5,871.2Decrease2.svg13.0Decrease2.svg2,016.2Decrease2.svg-3.4%Increase2.svg4.9%Increase Negative.svg5.5%Increase Negative.svg37.7%
2019Decrease2.svg37.2Decrease2.svg5,697.3Decrease2.svg12.6Decrease2.svg1,934.1Decrease2.svg-3.7%Increase Negative.svg5.4%Increase Negative.svg6.1%Increase Negative.svg41.7%
2020Decrease2.svg36.9Decrease2.svg5,679.2Steady2.svg12.6Increase2.svg1,942.6Decrease2.svg-2.0%Increase2.svg3.7%Increase Negative.svg7.3%Increase Negative.svg47.9%
2021Increase2.svg40.1Increase2.svg6,132.8Increase2.svg13.4Increase2.svg2,047.1Increase2.svg5.0%Increase2.svg4.1%Increase Negative.svg11.1%Increase Negative.svg49.5%
2022Increase2.svg42.7Increase2.svg6,454.9Increase2.svg13.9Increase2.svg2,109.3Increase2.svg3.5%Increase2.svg3.6%Decrease Positive.svg7.5%Decrease Positive.svg48.1%
2023Increase2.svg44.7Increase2.svg6,684.3Increase2.svg14.3Increase2.svg2,143.8Increase2.svg2.2%Increase2.svg3.5%Decrease Positive.svg7.2%Increase Negative.svg48.9%
2024Increase2.svg46.8Increase2.svg6,928.6Increase2.svg14.7Increase2.svg2,183.2Increase2.svg2.4%Increase2.svg3.5%Decrease Positive.svg6.8%Increase Negative.svg50.1%
2025Increase2.svg49.0Increase2.svg7,188.3Increase2.svg15.3Increase2.svg2,237.7Increase2.svg2.6%Increase2.svg3.5%Decrease Positive.svg6.4%Increase Negative.svg50.6%
2026Increase2.svg51.4Increase2.svg7,461.3Increase2.svg15.9Increase2.svg2,312.8Increase2.svg2.8%Increase2.svg3.5%Decrease Positive.svg6.0%Decrease Positive.svg50.6%

Other statistics

Historical GDP per capita development of Nicaragua GDP per capita development in Nicaragua.svg
Historical GDP per capita development of Nicaragua

Household income or consumption by percentage share:lowest 10%: 1.4%; highest 10%: 41.8 (2005)

Industrial production growth rate: 2.4% (2005)

Electricity - production: 2.778 billion kWh (2006)

Electricity - production by source:fossil fuel: 53.43%; hydro: 35.34%; nuclear: 0%; other: 11.23% (1998). A large number of wind turbines have been installed along the SW shore of Lake Nicaragua since, and some geothermal plants have been constructed as well. As of 2013, the breakdown was: fossil fuel: 50%; wind power: 15%; geothermal: 16%, hydropower: 12%, biomass power: 7%. [23]

Electricity - consumption: 2.929 billion kWh (2006)

Electricity - exports: 69.34 million kWh (2006)

Electricity - imports: 0 kWh (2006)

Agriculture - products: coffee, bananas, sugarcane, cotton, rice, corn, tobacco, sesame, soya, beans, beef, veal, pork, poultry, dairy products; shrimp, lobsters

Exports - commodities: coffee, beef, shrimp, lobster, cotton, tobacco, peanuts, sugar, bananas, gold

Imports - commodities: consumer goods, machinery equipment, raw materials, petroleum products

Currency: 1 gold Cordoba (C$) = 100 centavos

Exchange rates: Córdoba (C$) per US$1 – 17.582 (2006), 16.733 (2005), 15.937 (2004), 15.105 (2003), 14.251 (2002)

Price inflation:

See also

Notes

  1. official data; data cover general government debt and include debt instruments issued (or owned) by Government entities other than the treasury; the data include treasury debt held by foreign entities, as well as intragovernmental debt; intragovernmental debt consists of treasury borrowings from surpluses in the social funds, such as retirement, medical care, and unemployment, debt instruments for the social funds are not sold at public auctions; Nicaragua rebased its GDP figures in 2012, which reduced the figures for debt as a percentage of GDP

Related Research Articles

<span class="mw-page-title-main">Economy of Costa Rica</span>

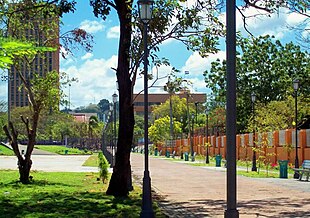
The economy of Costa Rica has been very stable for some years now, with continuing growth in the GDP and moderate inflation, though with a high unemployment rate: 11.49% in 2019. Costa Rica's economy emerged from recession in 1997 and has shown strong aggregate growth since then. The estimated GDP for 2023 is US$90 billion, up significantly from the US$52.6 billion in 2015 while the estimated 2024 per capita is US$28,558.

<span class="mw-page-title-main">Economy of Colombia</span>

The economy of Colombia is the fourth largest in Latin America as measured by gross domestic product and the third-largest economic power in South America. Colombia has experienced a historic economic boom over the last decade. Throughout most of the 20th century, Colombia was Latin America's 4th and 3rd largest economy when measured by nominal GDP, real GDP, GDP (PPP), and real GDP at chained PPPs. Between 2012 and 2014, it became the 3rd largest in Latin America by nominal GDP. As of 2018, the GDP (PPP) per capita has increased to over US$14,000, and real gross domestic product at chained PPPs increased from US$250 billion in 1990 to nearly US$800 billion. Poverty levels were as high as 65% in 1990, but decreased to under 30% by 2014, and 27% by 2018. They decreased by an average of 1.35% per year since 1990.

<span class="mw-page-title-main">Economy of the Dominican Republic</span>

The economy of the Dominican Republic is the seventh largest in Latin America, and is the largest in the Caribbean and Central American region. The Dominican Republic is an upper-middle income developing country with important sectors including mining, tourism, manufacturing, energy, real estate, infrastructure, telecommunications and agriculture. The Dominican Republic is on track to achieve its goal of becoming a high-income country by 2030, and is expected to grow 79% in this decade. The country is the site of the single largest gold mine in Latin America, the Pueblo Viejo mine.Although the service sector is currently the leading employer of Dominicans, agriculture remains an important sector in terms of the domestic market and is in second place in terms of export earnings. Tourism accounts for more than $7.4 billion in annual earnings in 2019. Free-trade zone earnings and tourism are the fastest-growing export sectors. A leading growth engine in the Free-trade zone sector is the production of medical equipment for export having a value-added per employee of $20,000 USD, total revenue of $1.5 billion USD, and a growth rate of 7.7% in 2019. The medical instrument export sector represents one of the highest-value added sectors of the country's economy, a true growth engine for the country's emerging market. Remittances are an important sector of the economy, contributing $8.2 billion in 2020. Most of these funds are used to cover household expenses, such as housing, food, clothing, health care and education. Secondarily, remittances have financed businesses and productive activities. Thirdly, this combined effect has induced investment by the private sector and helps fund the public sector through its value-added tax. The combined import market including the free-trade-zones amounts to a market of $20 billion a year in 2019. The combined export sector had revenues totaling $11 billion in 2019. The consumer market is equivalent to $61 billion in 2019. An important indicator is the average commercial loan interest rate, which directs short-term investment and stimulates long-term investment in the economy. It is currently 8.30%, as of June 2021.

<span class="mw-page-title-main">Economy of Ecuador</span>

The economy of Ecuador is the eighth largest in Latin America and the 69th largest in the world by total GDP. Ecuador's economy is based on the export of oil, bananas, shrimp, gold, other primary agricultural products and money transfers from Ecuadorian emigrants employed abroad. In 2017, remittances constituted 2.7% of Ecuador's GDP. The total trade amounted to 42% of the Ecuador's GDP in 2017.

<span class="mw-page-title-main">Economy of Grenada</span>

The economy of Grenada is largely tourism-based, small, and open economy. Over the past two decades, the main thrust of Grenada's economy has shifted from agriculture to services, with tourism serving as the leading foreign currency earning sector. The country's principal export crops are the spices nutmeg and mace. Other crops for export include cocoa, citrus fruits, bananas, cloves, and cinnamon. Manufacturing industries in Grenada operate mostly on a small scale, including production of beverages and other foodstuffs, textiles, and the assembly of electronic components for export.

<span class="mw-page-title-main">Economy of Honduras</span>

The economy of Honduras is based mostly on agriculture, which accounts for 14% of its gross domestic product (GDP) in 2013. The country's leading export is coffee (US$340 million), which accounted for 22% of the total Honduran export revenues. Bananas, formerly the country's second-largest export until being virtually wiped out by 1998's Hurricane Mitch, recovered in 2000 to 57% of pre-Mitch levels. Cultivated shrimp is another important export sector. Since the late 1970s, towns in the north began industrial production through maquiladoras, especially in San Pedro Sula and Puerto Cortés.

<span class="mw-page-title-main">Economy of Indonesia</span>

The economy of Indonesia is a mixed economy with dirigiste characteristics, and it is one of the emerging market economies in the world and the largest in Southeast Asia. As an upper-middle income country and member of the G20, Indonesia is classified as a newly industrialized country. Estimated at over 21 quadrillion rupiah in 2023, it is the 16th largest economy in the world by nominal GDP and the 7th largest in terms of GDP (PPP). Indonesia's internet economy reached US$77 billion in 2022, and is expected to cross the US$130 billion mark by 2025. Indonesia depends on the domestic market and government budget spending and its ownership of state-owned enterprises. The administration of prices of a range of basic goods also plays a significant role in Indonesia's market economy. However, since the 1990s, the majority of the economy has been controlled by individual Indonesians and foreign companies.

<span class="mw-page-title-main">Economy of Jamaica</span>

The economy of Jamaica is heavily reliant on services, accounting for 71% of the country's GDP. Jamaica has natural resources and a climate conducive to agriculture and tourism. The discovery of bauxite in the 1940s and the subsequent establishment of the bauxite-alumina industry shifted Jamaica's economy from sugar, and bananas.

<span class="mw-page-title-main">Economy of Kenya</span>

The economy of Kenya is market-based with a few state enterprises. Kenya has an emerging market and is an averagely industrialised nation ahead of its East African peers. Currently a lower middle income nation, Kenya plans to be a newly industrialised nation by 2030. The major industries driving the Kenyan economy include financial services, agriculture, real estate, manufacturing, logistics, tourism, retail and energy. As of 2020, Kenya had the third largest economy in Sub-Saharan Africa, behind Nigeria and South Africa. Regionally, Kenya has had a stronger and more stable economy compared to its neighboring countries within East Africa.By 2023, the country had become Africa's largest start-up hub by both funds invested and number of projects.

<span class="mw-page-title-main">Economy of Saint Lucia</span>

Once a single-crop agricultural economy, Saint Lucia has shifted to a tourism and banking serviced-based economy. Tourism, the island's biggest industry and main source of jobs, income and foreign exchange, accounts for 65% of its GDP. Agriculture, which was once the biggest industry, now contributes to less than 3% of GDP, but still accounts for 20% of jobs. The banana industry is now on a decline due to strong competition from low-cost Latin American producers and reduced European trade preferences, but the government has helped revitalize the industry, with 13,734 tonnes exported in 2018. Agricultural crops grown for export are bananas, mangoes, and avocados. The island is considered to have the most diverse and well-developed manufacturing industry in the eastern Caribbean.

<span class="mw-page-title-main">Economy of Senegal</span>

The economy of Senegal is driven by mining, construction, tourism, fishing and agriculture, which are the main sources of employment in rural areas, despite abundant natural resources in iron, zircon, gas, gold, phosphates, and numerous oil discoveries recently. Senegal's economy gains most of its foreign exchange from fish, phosphates, groundnuts, tourism, and services. As one of the dominant parts of the economy, the agricultural sector of Senegal is highly vulnerable to environmental conditions, such as variations in rainfall and climate change, and changes in world commodity prices.

<span class="mw-page-title-main">Economy of Seychelles</span>

The economy of Seychelles is based on fishing, tourism, processing of coconuts and vanilla, coir rope, boat building, printing, furniture and beverages. Agricultural products include cinnamon, sweet potatoes, cassava (tapioca), bananas, poultry and tuna.

<span class="mw-page-title-main">Economy of Tanzania</span>

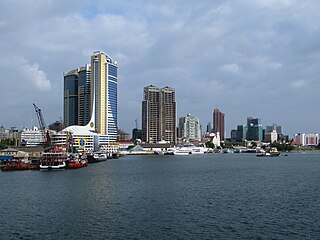
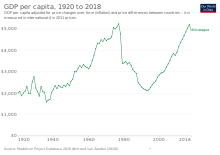
The economy of Tanzania is a lower-middle income economy that is overwhelmingly dependent on agriculture. Tanzania's economy has been transitioning from a planned economy to a market economy since 1985. Although total GDP has increased since these reforms began, GDP per capita dropped sharply at first, and only exceeded the pre-transition figure in around 2007.

<span class="mw-page-title-main">Economy of Madagascar</span>

The economy of Madagascar is US$9.769 billion by gross domestic product as of 2020, being a market economy and is supported by an agricultural industry and emerging tourism, textile and mining industries. Malagasy agriculture produces tropical staple crops such as rice and cassava, as well as cash crops such as vanilla and coffee.

<span class="mw-page-title-main">Economy of Guyana</span>

The economy of Guyana is one of the fastest growing in the world with a gross domestic product (GDP) growth of 19.9% in 2021. In 2023, Guyana had a per capita gross domestic product of Int$60,648 and an average GDP growth of 4.2% over the previous decade. Guyana's economy was transformed in 2015 with the discovery of an offshore oil field in the country's waters about 190 km from Georgetown, making the first commercial-grade crude oil draw in December 2019, sending it abroad for refining.

<span class="mw-page-title-main">Economy of Mozambique</span>

The economy of Mozambique is $14.396 billion by gross domestic product as of 2018, and has developed since the end of the Mozambican Civil War (1977–1992). In 1987, the government embarked on a series of macroeconomic reforms, which were designed to stabilize the economy. These steps, combined with donor assistance and with political stability since the multi-party elections in 1994, have led to dramatic improvements in the country's growth rate. Inflation was brought to single digits during the late 1990s, although it returned to double digits in 2000–02. Fiscal reforms, including the introduction of a value-added tax and reform of the customs service, have improved the government's revenue collection abilities.

<span class="mw-page-title-main">Economic history of Nicaragua</span>

Nicaragua's economic history has shifted from concentration in gold, beef, and coffee to a mixed economy under the Sandinista government to an International Monetary Fund policy attempt in 1990.

<span class="mw-page-title-main">Economy of Ivory Coast</span>

The economy of Ivory Coast is stable and currently growing, in the aftermath of political instability in recent decades. The Ivory Coast's economy is largely market-based and depends heavily on the agricultural sector. Almost 70% of the Ivorian people are engaged in some form of agricultural activity. The economy grew 82% in the 1960s, reaching a peak growth of 360% in the 1970s, but this proved unsustainable and it shrank by 28% in the 1980s and a further 22% in the 1990s. This decline, coupled with high population growth, resulted in a steady fall in living standards. The Gross national product per capita, now rising again, was about US$727 in 1996. It was substantially higher two decades before. Real GDP growth is expected to average 6.5% in 2024-25.

The economic history of Ecuador covers the development of Ecuador's economy throughout its history, beginning with colonization by the Spanish Empire, through independence and up to the 21st century.

Colombia is now a country mostly in South America, and has been home to many indigenous peoples and cultures since at least 12,000 BCE.

References

  1. "World Economic Outlook Database, April 2019". IMF.org. International Monetary Fund . Retrieved 29 September 2019.
  2. "World Bank Country and Lending Groups". datahelpdesk.worldbank.org. World Bank . Retrieved 29 September 2019.
  3. 1 2 3 4 5 6 7 8 "Nicaragua". IMF.org. International Monetary Fund . Retrieved 2 June 2024.
  4. 1 2 3 4 5 6 7 8 9 10 "The World Factbook". CIA.gov. Central Intelligence Agency . Retrieved 23 January 2019.
  5. "Gini coefficient: Wealth inequality Nicaragua 2022". data.worldbank.org. Statista. Retrieved 22 April 2024.
  6. "Human Development Index (HDI)". hdr.undp.org. HDRO (Human Development Report Office) United Nations Development Programme . Retrieved 22 April 2024.
  7. "Inequality-adjusted Human Development Index (IHDI)". hdr.undp.org. HDRO (Human Development Report Office) United Nations Development Programme . Retrieved 22 April 2024.
  8. "Labor force, total - Nicaragua". data.worldbank.org. World Bank. Retrieved 22 April 2024.
  9. "Employment to Population Ratio for Nicaragua". FRED Economic Data. Retrieved 22 April 2024.
  10. 1 2 "Export Partners of Nicaragua". The Observatory of Economic Complexity . Retrieved 5 February 2024.
  11. 1 2 "Import Partners of Nicaragua". The Observatory of Economic Complexity . Retrieved 5 February 2024.
  12. http://www.indexmundi.com/g/g.aspx?c=nu&v=66 IndexMundi Real GDP Growth Rate Chart
  13. http://en.centralamericadata.com/en/article/data/Nicaraguan_Economy_Grows_by_5 Nicaraguan Economy Grows by 5 Percent
  14. 1 2 http://www.indexmundi.com/nicaragua/inflation_rate_(consumer_prices).html Nicaragua Inflation Rates via Consumer Price Index, IndexMundi
  15. "Nicaragua Unemployment rate, 1980-2018 - knoema.com". Knoema.
  16. Monstersandcritics.com Archived 29 September 2007 at the Wayback Machine Close scrutiny after President Ortega's first 100 days
  17. 1 2 Rcalvet.com Archived 30 September 2007 at the Wayback Machine Government Gets Tough on Environmental Scofflaws
  18. CostaRicaPages.com Archived 7 April 2007 at the Wayback Machine Nicaragua Information
  19. english.people.com.cn Poland forgives nearly 31 million dollars of debt owed by Nicaragua
  20. 1 2 "Central America :: Nicaragua – The World Factbook - Central Intelligence Agency". cia.gov. 17 April 2024.
  21. Canal2tv.com Archived 17 July 2007 at the Wayback Machine Turismo en Nicaragua: aportes y desafios parte I
  22. "Report for Selected Countries and Subjects". IMF. Retrieved 7 February 2022.
  23. "Renewables Readiness Assessment: Nicaragua" (PDF). 19 April 2024.
  24. 1 2 "Nicaragua's inflation hit 13.77 pct in 2008". Reuters. 10 January 2009.