Economy of the European Union

Last updated

Economy of Europe
Tour Eiffel - night (2016).jpg
Currency Euro (EUR, €) and 7 others
Calendar year
Trade organisations
WTO, G20, G7 and others
Statistics
PopulationIncrease2.svg 448,753,823 (EU27, 1 January 2023 prov. est.) [1]
GDP
  • Increase2.svg $18.98 trillion (nominal; 2024) [2]
  • Increase2.svg $26.64 trillion (PPP; 2024) [2]
GDP growth
  • 2.3% (2018)
    1.7% (2019)
    −5.9% (2020)
    5.4% (2021) [3]
GDP per capita
  • Increase2.svg $43,300 (nominal; 2024) [2]
  • Increase2.svg $59,050 (PPP; 2024) [2]
GDP by sector
  • 7.5% (March 2022) [3]
Population below poverty line
  • 9.8% (2013) [4]
  • Decrease Positive.svg 21.6% at risk of poverty or social exclusion (EU27, 2018 est.) [5]
Decrease Positive.svg 29.6 medium (EU27, 2018 est.) [6]
  • 0.900 very high (2018) [7]
  • 0.816 very high IHDI (2018) [7]
Labour force
  • Increase2.svg 220,026,545 (2022) [8]
  • Increase2.svg 73.1% employment rate (Target: --, EU27; 2019) [9]
  • Increase2.svg 72.7% employment rate (EA19, 2019) [9]
Labour force by occupation
Unemployment
  • Decrease Positive.svg 6.0% (EU27, september 2023) [10]
  • Decrease Positive.svg 6.5% (EA19, september 2023) [10]
Average gross salary
€2,792 monthly (2021) [11]
€2,178 monthly (2022) [12]
Main industries
External
Exports$8.705 trillion (2021 est.) [13]
Export goods
machinery, motor vehicles, pharmaceuticals and other chemicals, fuels, aircraft, plastics, iron and steel, wood pulp and paper products, alcoholic beverages, furniture
Main export partners
Imports$8.037 trillion (2021 est.) [13]
Import goods
fuels and crude oil, machinery, vehicles, pharmaceuticals and other chemicals, precious gemstones, textiles, aircraft, plastics, metals, ships
Main import partners
FDI stock
  • €4 trillion (inward, 2012) [15]
  • €5.2 trillion (outward, 2012) [16]
Increase2.svg €161.6 billion; 1.1% of GDP (2015) [17]
$13.05 trillion (31 December 2014 est.) [13]
Increase2.svg −€2,557.4 billion; 17.5% of GDP (2015) [18]
Public finances
  • Decrease Positive.svg 88.1% of GDP (EU27; 2021) [19]
  • Increase2.svg €12.741 trillion (EU27; 2021) [19]
  • €675.8 billion deficit (EU27; 2021) [19]
  • −4.7% of GDP (2021) [19]
Revenues46.9% of GDP (EU27; 2021) [19]
Expenses51.6% of GDP (EU27; 2021) [19]
Economic aiddonor: ODA, $87.64 billion [21]


  • Scope: [23]
  • AAA
  • Outlook: Stable
$0.6 trillion (2010) [24]
Main data source: CIA World Fact Book
All values, unless otherwise stated, are in US dollars.
Eurozone's inflation Euro inflation.webp
Eurozone's inflation

The economy of the European Union is the joint economy of the member states of the European Union (EU). It is the second largest economy in the world in nominal terms, after the United States, and the third largest at purchasing power parity (PPP), after China and the US. The European Union's GDP is estimated to be $19.35 trillion (nominal) in 2024 [2] or $26.64 trillion (PPP), representing around one-sixth of the global economy. [25] Germany has the biggest national GDP of all EU countries, followed by France and Italy.

Contents

The euro is the second largest reserve currency and the second most traded currency in the world after the United States dollar. [26] [27] [28] The euro is used by 20 of its 27 members, overall, it is the official currency in 26 countries, in the eurozone and in six other European countries, officially or de facto. The EU as a region has produced the world's second-highest number of Nobel laureates in the economics field. [29]

The European Union economy consists of an internal market of mixed economies based on free market and advanced social models. For instance, it includes an internal single market with free movement of goods, services, capital, and labour. [30] The GDP per capita (PPP) was $56,970 in 2023 , [31] compared to $80,410 in the United States, $52,120 in Japan and $28,800 in China. [32] There are significant disparities in GDP per capita (PPP) between member states ranging from $106,372 in Luxembourg to $23,169 in Bulgaria. [33] With a medium Gini coefficient of 30, [34] the European Union has a more egalitarian distribution of income than the world average. [35] [36]

EU investments in foreign countries total $9.1 trillion, while the foreign investments made in the union total $5.1 trillion in 2012, by far the highest foreign and domestic investments in the world. [37] [38] Euronext is the main stock exchange of the Eurozone and the world's fourth largest by market capitalisation. [39] The European Union's largest trading partners are China, the United States, the United Kingdom, Switzerland, Russia, Turkey, Japan, Norway, South Korea, India, and Canada. [40] In 2022, public debt in the union was 83.5% of GDP, with disparities between the lowest rate, Estonia with 18.5%, and the highest, Greece with 172.6%. [41]

Currency

The Eurozone or euro area (dark blue) represents around 350 million people. The euro is the second-largest reserve currency in the world. BlueEurozone.svg
The Eurozone or euro area (dark blue) represents around 350 million people. The euro is the second-largest reserve currency in the world.

Beginning in the year 1999 with some EU member states, now 20 out of 27 EU states use the euro as official currency in a currency union. The remaining 7 states continue to use their own currency with the possibility to join the euro later. The euro is the most widely used currency in the EU.

Since 1992, the Maastricht Treaty sets out rigid economic and fiscal convergence criteria for the states joining the euro. Starting 1997, the Stability and Growth Pact has been started to ensure continuing economic and fiscal stability and convergence.

Denmark is not a part of the eurozone due to its special opt-outs concerning the later joining of the euro. In contrast, the remaining states can effectively opt out by choosing when or whether to join the European Exchange Rate Mechanism, which is the preliminary step towards joining. They are, however, committed to join the euro by their Treaties of Accession.

Starting with Greece in 2009, five of the 20 eurozone states have been struggling with a sovereign debt crisis, commonly called the European debt crisis. All these states started reforms and got bailout packages (Greece, Ireland, Portugal, Spain, Cyprus). As of 2015, all countries but Greece have recovered from their debt crisis.[ needs update ] Other non-eurozone states also experienced a debt crisis and also went through successful bailout programmes, i.e. Hungary, Romania and Latvia (the latter before it joined the eurozone). [42]

Budget

The EU has a long-term budget, named Multiannual Financial Framework (MFF), of €1,082.5 billion for the period 2014–2020, representing 1.02% of the EU-28's GNI. [43]

The overall budget for the period 2021-2027 is of €1.8 trillion combining the MFF of €1,074.3 billion with an extraordinary recovery fund of €750 billion, known as Next Generation EU, to support member states hit by the COVID-19 pandemic. [44]

Sectors

Services

The services sector is by far the most important sector in the European Union, making up 64.7% of GDP, compared to the manufacturing industry with 23.8% of GDP and agriculture with only 1.5% of GDP. [45]

Financial services are well developed within the Single Market of the Union. Companies have a greater reliance on bank lending than in the United States, although a shift towards companies raising more funding through capital markets is planned through the CMU initiative, the EU plan put forward by the Commission in September 2015 to mobilise the free movement of capital within the EU. [46] The plan aims "to establish the building blocks of an integrated capital market in the EU by 2019". [47] The CMU initiative comprises 33 measures in all. [48] The plan was updated in 2017 and in 2019, since not a single legislation will deliver the CMU. [49] The Commissioner for Financial Stability, Financial Services and Capital Markets Union, Mairead McGuinness, former Vice-President of the European Parliament, is responsible for delivery of the initiative. [50] [51] [52] [53]

According to the Global Financial Centres Index, the two largest financial centres in Europe, London and Zürich, are outside the European Union. [54] The two largest financial centres remaining within the EU will then be Frankfurt and Luxembourg.

In the European Investment Bank's Investment survey 2021, 58% of firms in the service sector were expecting long term effects of COVID-19. [55] [56] 56% of EU enterprises received governmental help to handle the pandemic's effects. [57] [58] [59]

The COVID-19 pandemic had a significant effect on sales. 49% of all EU enterprises claimed that their sales decreased since the start of 2020. [57] [60] The pandemic has affected sectors differently, with the number of enterprises losing money in the hotels, restaurants, arts, and leisure industries reaching roughly 25% compared to previous times, and transportation also being affected. [61] [62] [63]

Without government assistance, 35% of European small and medium-sized firms (SMEs) in manufacturing and services indicated their businesses would not have survived the effects of the pandemic. [55] [64]

In 2020, 86% of enterprises reported previous-year investment activity, while in 2021 only 79% reported investment. 23% of EU firms changed their investment plans in 2021, with only 3% reporting a higher amount. [57] [65] The highest proportion of enterprises that have reduced their investment plans due to a drop in sales are in Poland, where 49% of firms have reduced investment, and in Belgium, where 47% of firms stated the same. [57] [66]

Most green or digital businesses in the EU operate in manufacturing (33%) or infrastructure (30%). The service sector has the greatest percentage of businesses that have not engaged in digitalisation or the green transition (41%). [67] [68]

EU enterprises were growing in terms of innovation in 2023. 39% of EU enterprises created or introduced new goods, processes, or services in the previous fiscal year, compared to 57% of US firms. In the EU, over 12% of businesses introduced ideas that were novel to the country or the global market. [69] [70] [71] Investment in intangible assets (research and development, software, training, or business processes) by EU enterprises accounted for around 38% of overall investment. Businesses in the EU were also optimistic about 2023, with 14% more predicting an increase rather than a drop in investment. [72]

Agriculture

The agricultural sector is supported by subsidies from the European Union in the form of the Common Agricultural Policy (CAP). In 2013 this represented approximately €45 billion (less than 33% of the overall budget of €148 billion) of the EU's total spending. [73] [ needs update ] It was used originally to guarantee a minimum price for farmers in the EU. This is criticised as a form of protectionism, inhibiting trade, and damaging developing countries; one of the most vocal opponents was the United Kingdom, the second largest economy within the union until its withdrawal in January 2020, which repeatedly refused to give up the annual UK rebate unless the CAP should undergo significant reform; France, the biggest beneficiary of the CAP and the union's third largest (now its second-largest) economy, is its most vocal proponent. The CAP is however witnessing substantial reform. In 1985, around 70% of the EU budget was spent on agriculture. In 2011, direct aid to farmers and market-related expenditure amount to just 30% of the budget, and rural development spending to 11%. By 2011, 90% of direct support had become non-trade-distorting (not linked to production) as reforms have continued to be made to the CAP, its funding and its design. [74]

Tourism

The European Union is a major tourist destination, attracting visitors from outside of the Union and citizens travelling inside it. Internal tourism is made more convenient by the Schengen treaty and the euro. All citizens of the European Union are entitled to travel to any member state without the need of a visa.

France is the world's number one tourist destination for international visitors, followed by Spain, Italy, and Germany. It is worth noting, however, that a significant proportion of international visitors to EU countries are from other member states.

Energy

Wind power stations in Cerova, Slovakia VTE cerova.jpg
Wind power stations in Cerová, Slovakia

The European Union has uranium, coal, oil, and natural gas reserves. There are six oil producers in the European Union, primarily in North Sea oilfields. The United Kingdom, whilst it was a member of the European Union was by far the largest producer; Denmark, Germany, Italy, Romania and the Netherlands produce oil. The European Union produced 19.8 million tonnes of oil equivalent (Mtoe) of crude oil in 2019. The EU is one of the largest consumers of oil, consuming much more than it can produce. It consumed about 350 Mtoe in 2019, importing 96.8% of the oil. The largest suppliers are Russia, Iraq, Nigeria, Saudi Arabia, Kazakhstan, and Norway. Transport is the largest consumer of oil, at 66.1% in 2019. [75]

All countries in the EU have committed to the Kyoto Protocol, and the European Union is one of its biggest proponents. The European Commission published proposals for the first comprehensive EU energy policy on 10 January 2007. [76]

During the green transition, workers in carbon-intensive industries are more likely to lose their jobs. In the years to come, the transition to a carbon-neutral economy will put more jobs at danger in regions with higher percentages of employment in carbon-intensive industries. [77] [78] [79] Employment opportunities by the green transition are associated with the use of renewable energy sources or building activity for infrastructure improvements and renovations. [80]

Companies

The European Union's member states are the birthplace of many of the world's largest leading multinational companies, and home to its global headquarters. Among these are distinguished companies ranked first in the world within their industry/sector, like Allianz and AXA, which are the two largest financial service providers in the world by revenue; WPP plc and Publicis which are the world's largest advertising agencies by revenue; Amorim, which is the world's largest cork-processing and cork producer company; ArcelorMittal, which is the largest steel company in the world; Christian Dior SE [81] which is the biggest fashion group in the world and Inditex is the world’s second biggest fashion group; Groupe Danone, which has the world leadership in the dairy products market. [82]

Anheuser-Busch InBev is the largest beer company in the world; L'Oréal Group, which is the world's largest cosmetics and beauty company; LVMH, which is the world's largest luxury goods conglomerate; Nokia Corporation, which was the world's largest manufacturer of mobile telephones; Shell plc, Électricité de France, TotalEnergies, Eni which are one of the largest energy corporations in the world; and Stora Enso, which is the world's largest pulp and paper manufacturer in terms of production capacity, in terms of banking and finance the EU has some of the world's largest notably BNP Paribas, HSBC, Crédit Agricole, Grupo Santander, Société Générale and Groupe BPCE the largest bank in Europe in terms of Market Capitalisation and assets. [83]

Many other European companies rank among the world's largest companies in terms of turnover, profit, market share, number of employees or other major indicators. A considerable number of EU-based companies are ranked among the world's top-ten within their sector of activity. Europe is also home to many prestigious car companies such as Aston Martin, Alpine, BMW, Bugatti, Ferrari, Jaguar, Lamborghini, Land Rover, Maserati, Mercedes-Benz, Porsche, Volvo, as well as volume manufacturers such as Automobile Dacia, Citroën, Fiat, Opel, Peugeot, Renault, Seat, Volkswagen and more.

In Europe, 33% of jobs are within enterprises that have not digitally transformed. These companies were also less likely to train their employees throughout the COVID-19 outbreak. [57] [84] Across the European Union, the most commonly mentioned investment barrier is the lack of trained labor. 75% of businesses in transition regions found this to be problematic. Numerous reasons, such as demographics and rising demand for skills that are less common on the market, such as those needed to support digitalization activities, might contribute to the lack of competent workers. [85] In all areas of Europe, digital businesses have produced "better" employment with greater earnings than their non-digital counterparts. Additionally, they are more inclined to recognize and reward individuals who do well. [86] [87]

The following is a list of the largest EU based stock market listed companies in 2022. The ordered by revenue in millions of US Dollars and is based on the Fortune Global 500.

Fortune top 10 EU corporations by revenue (2022) [88]
World rankCorporationTickerRevenues ($m)Profits ($m)Assets ($m)EmployeesHeadquartersIndustry
8 Volkswagen Group VWAGY$295,819.8$18,186.6$601,028.4672,789 Flag of Germany.svg Wolfsburg Motor vehicle and parts
27 TotalEnergies TTE$184,634$16,032$293,458101,309 Flag of France.svg Courbevoie Petroleum refining
29 Stellantis STLA$176,663$16,789.1$195,297.9281,595 Flag of the Netherlands.svg Hoofddorp Motor vehicle and parts
38 Mercedes-Benz Group DMLRY$158,306.1$27,200.8$295,427.8172,425 Flag of Germany.svg Stuttgart Motor vehicle and parts
47 Allianz ALIZY$144,516.6$7,815.2$1,295,530.8155,411 Flag of Germany.svg Munich Insurance: Life, health
48 AXA AXAHY$144,446.8$8,623.9$881,733.392,398 Flag of France.svg Paris Insurance: Life, health
56 Fortum $132,894.2$873.7$170,164.619,140 Flag of Finland.svg Espoo Energy
59 BMW Group BMWYY$131,521.6$14,639.6$260,972.2118,909 Flag of Germany.svg MunichMotor vehicle and parts
62 Deutsche Telekom DTEGY$128,630.8$4,937.4$320,209.9216,528 Flag of Germany.svg Bonn Telecommunications
72 Assicurazioni Generali ARZGY$117,155$3,366.1$666,537.874,621 Flag of Italy.svg Trieste Insurance: Life, health

Economies of member states

Wealth

The twelve new member states of the European Union have enjoyed a higher average percentage growth rate than their elder members of the EU. Slovakia has the highest GDP growth in the period 2005–2015 among all countries of the European Union (See Tatra Tiger). Notably the Baltic states have achieved high GDP growth, with Latvia topping 11%, close to China, the world leader at 9% on average for the past 25 years (though these gains have been in great part cancelled by the late-2000s recession). [89]

Reasons for this growth include government commitments to stable monetary policy, export-oriented trade policies, low flat-tax rates and the utilisation of relatively cheap labour. In 2015 Ireland had the highest GDP growth of all the states in EU (25.1%). The current map of EU growth is one of huge regional variation, with the larger economies suffering from stagnant growth and most of the newer states enjoying sustained, robust economic growth.

In mid-2021, the European Union's gross saving rate was 18% of gross disposable income, higher above the prior COVID-19 pandemic average of 11–13%. [57] [90] In the second quarter of 2020, families' primary income fell by 7.3% compared to the second quarter of 2019, and their secondary income (from social security payments and other transfers) increased by 6.5% of gross income. [57] [91] [92]

Although EU27 GDP is rising, the percentage of gross world product is decreasing because of the emergence of economies such as China, India and Brazil.

Population and GDP per capita of European countries (2010) EU-GDP-Population.svg
Population and GDP per capita of European countries (2010)

In the tables below, colours indicate best and worst performer of the year concerned.

EU member states by real GDP growth rates [93]
Member state20132014201520162017201820192020202120222023Yearly growth
(2013–2023)
Flag of Austria.svg  Austria 0.00.71.02.02.32.41.5-6.64.24.8-0.81.05
Flag of Belgium (civil).svg  Belgium 0.51.62.01.31.61.82.2-5.36.93.01.41.54
Flag of Bulgaria.svg  Bulgaria -0.50.93.43.02.72.74.0-4.07.73.91.82.33
Flag of Croatia.svg  Croatia -0.4-0.42.53.63.43.03.4-8.513.07.03.12.65
Flag of Cyprus.svg  Cyprus -6.6-1.83.46.65.75.65.5-3.49.95.12.52.95
Flag of the Czech Republic.svg  Czech Republic 0.02.35.42.55.23.23.0-5.53.62.4-0.31.96
Flag of Denmark.svg  Denmark 0.91.62.33.22.82.01.5-2.46.82.71.92.11
Flag of Estonia.svg  Estonia 1.53.01.93.25.83.84.0-1.07.2-0.5-3.02.35
Flag of Finland.svg  Finland -0.9-0.40.52.83.21.11.2-2.42.81.3-1.00.75
Flag of France.svg  France 0.61.01.11.12.31.91.8-7.56.42.50.71.08
Flag of Germany.svg  Germany 0.42.21.52.22.71.01.1-3.83.21.8-0.21.09
Flag of Greece.svg  Greece -2.50.5-0.2-0.51.11.71.9-9.38.45.62.00.79
Flag of Hungary.svg  Hungary 1.84.23.72.24.35.44.9-4.57.14.6-0.92.98
Flag of Ireland.svg  Ireland 1.28.824.51.89.38.55.36.615.19.4-3.27.94
Flag of Italy.svg  Italy -1.80.00.81.31.70.90.5-9.08.34.00.90.69
Flag of Latvia.svg  Latvia 2.01.93.92.43.34.00.6-3.56.73.0-0.32.18
Flag of Lithuania.svg  Lithuania 3.63.52.02.54.34.04.70.06.32.4-0.33.00
Flag of Luxembourg.svg  Luxembourg 3.22.62.35.01.31.22.9-0.97.21.4-1.12.28
Flag of Malta.svg  Malta 5.57.69.63.410.97.47.1-8.212.58.15.66.32
Flag of the Netherlands.svg  Netherlands -0.11.42.02.22.92.42.0-3.96.24.30.11.77
Flag of Poland.svg  Poland 0.93.84.43.05.15.94.4-2.06.95.30.23.45
Flag of Portugal.svg  Portugal -0.90.81.82.03.52.82.7-8.35.76.82.31.75
Flag of Romania.svg  Romania 0.34.13.22.98.26.03.9-3.75.74.12.13.35
Flag of Slovakia.svg  Slovakia 0.62.75.21.92.94.02.5-3.34.81.91.62.20
Flag of Slovenia.svg  Slovenia -1.02.82.23.24.84.53.5-4.28.22.51.62.55
Flag of Spain.svg  Spain -1.41.43.83.03.02.32.0-11.26.45.82.51.60
Flag of Sweden.svg  Sweden 1.22.74.52.12.62.02.0-2.26.12.7-0.22.14
Flag of Europe.svg  European Union (27)-0.11.62.32.02.82.11.8-5.66.03.50.41.52
Eurozone (20)-0.21.42.01.92.61.81.6-6.15.93.40.41.34
EU member states by GDP (nominal) in millions of € [94]
Member state20132014201520162017201820192020202120222023Change from2013 to 2023Change in percentage
Flag of Austria.svg  Austria 323.910333.146344.269357.608369.362385.274397.147380.889405.241447.218477.249153.33947.34%
Flag of Belgium (civil).svg  Belgium 392.880403.003416.701430.085445.050460.051478.676460.748507.930554.044582.583189.70348.29%
Flag of Bulgaria.svg  Bulgaria 42.05643.02545.79848.75252.50256.20061.53161.60871.06085.80193.94851.892123.39%
Flag of Croatia.svg  Croatia 44.53344.08445.36147.44950.09752.87755.77250.54358.45567.99075.85531.32270.33%
Flag of Cyprus.svg  Cyprus 18.04017.48317.94419.01420.31221.67523.17822.08724.92827.77729.75711.71764.95%
Flag of the Czech Republic.svg  Czechia 159.462157.821169.558177.439194.133210.970225.614215.805238.250276.266305.967146.02891.87%
Flag of Denmark.svg  Denmark 258.743265.757273.018283.110294.808302.329309.526311.356342.962380.618373.755115.01244.45%
Flag of Estonia.svg  Estonia 18.91120.04820.63121.74823.83425.93227.95127.43031.16936.01137.68218.77199.26%
Flag of Finland.svg  Finland 204.321206.897211.385217.518226.301233.462239.858238.038250.664267.687277.62573.30435.88%
Flag of France.svg  France 2,117.1892,149.7652,198.4322,234.1292,297.2422,363.3062,437.6352,317.8322,502.1182,639.0922,803.100685.91132.40%
Flag of Germany.svg  Germany 2,811.3502,927.4303,026.1803,134.7403,267.1603,365.4503,474.1103,403.7303,617.4503,876.8104,121.1601,309.81046.59%
Flag of Greece.svg  Greece 179.884177.236176.369174.494176.903179.558183.347165.015181.500206.620220.30340.41922.47%
Flag of Hungary.svg  Hungary 102.240106.264112.791116.256127.025136.055146.555137.920153.980168.550196.39194.15192.09%
Flag of Ireland.svg  Ireland 179.286195.470263.507269.725298.528327.441356.357375.250434.070506.282504.620325.334181.46%
Flag of Italy.svg  Italy 1,612.7511,627.4061,655.3551,695.7871,736.5931,771.3911,796.6491,661.2401,821.9351,962.8462,085.376472.62529.31%
Flag of Latvia.svg  Latvia 22.79123.62624.57225.37126.98429.15430.57330.11033.34938.38640.31017.51976.87%
Flag of Lithuania.svg  Lithuania 35.04036.58137.34638.89042.27645.51548.95949.87356.47867.39972.04837.008105.62%
Flag of Luxembourg.svg  Luxembourg 49.09551.79154.14256.20858.16960.12162.43264.52472.36177.52979.31030.21561.54%
Flag of Malta.svg  Malta 7.9448.7519.99710.54111.93713.04414.29713.35215.32417.43219.38211.438143.98%
Flag of the Netherlands.svg  Netherlands 660.463671.560690.008708.337738.146773.987813.055796.530870.587958.5491,032.841372.37856.38%
Flag of Poland.svg  Poland 388.356406.413429.835424.735465.773499.004532.505526.147576.383654.594747.748359.39292.54%
Flag of Portugal.svg  Portugal 170.492173.054179.713186.490195.947205.184214.375200.519216.053242.341265.50395.01155.73%
Flag of Romania.svg  Romania 142.929150.522160.288167.494186.399206.072224.179220.487241.611284.174324.578181.649127.09%
Flag of Slovakia.svg  Slovakia 74.49376.35580.12681.26584.67089.87594.43093.444100.256109.645122.15647.66363.98%
Flag of Slovenia.svg  Slovenia 36.45437.63438.85340.44343.01145.87648.58247.04552.27957.03863.09026.63673.07%
Flag of Spain.svg  Spain 1,020.6771,032.6081,078.0921,114.4201,162.4921,203.8591,245.5131,119.0101,222.2901,346.3771,462.070441.39343.25%
Flag of Sweden.svg  Sweden 441.851438.834455.495466.267480.026470.673476.870480.556540.734561.785548.373106.52224.11%
Flag of Europe.svg  European Union (27)11,516.14111,782.56412,215.76512,548.31413,075.68013,534.33614,019.67413,471.03314,639.39815,919.17716,962.3915,446.25047.29%
Eurozone (20)9,980.50510,213.92810,568.98310,864.26211,275.01511,653.03212,042.89611,517.20712,474.43613,507.07414,372.4654,391.96044.01%
EU member states by GDP (nominal) per capita in € [94]
Member state20132014201520162017201820192020202120222023Change from2013 to 2023Change inpercentage
Flag of Austria.svg  Austria 38,21038,99039,89040,92042,00043,59044,74042,72045,27049,40052,25014,43038.15%
Flag of Belgium (civil).svg  Belgium 35,21035,95036,96037,96039,13040,26041,66039,93043,84847,43049,54014,77042.48%
Flag of Bulgaria.svg  Bulgaria 5,7905,9606,3806,8407,4208,0008,8208,88010,33013,27014,5808,790151.81%
Flag of Croatia.svg  Croatia 10,47010,41010,78011,37012,13012,93013,71012,49014,77017,40019,7009,23088.16%
Flag of Cyprus.svg  Cyprus 20,93020,51021,17022,33023,63024,91026,28024,76027,69030,43032,1009,53042.22%
Flag of the Czech Republic.svg  Czechia 15,17015,00016,08016,79018,33019,85021,15020,17022,27025,85028,58013,41088.40%
Flag of Denmark.svg  Denmark 46,10047,09048,05049,42051,14052,18053,21053,41058,59064,45062,84016,74036.31%
Flag of Estonia.svg  Estonia 14,32015,24015,71016,53018,12019,66021,10020,64023,43027,04027,59013,27092.67%
Flag of Finland.svg  Finland 37,57037,88038,57039,58041,08042,32043,44043,04045,23048,17049,70012,13032.28%
Flag of France.svg  France 32,08032,42033,02033,43034,23035,04035,98034,08036,67038,55040,8008,98028.22%
Flag of Germany.svg  Germany 34,86036,15037,05038,07039,53040,59041,81040,93043,48046,26048,75014,62042.84%
Flag of Greece.svg  Greece 16,41016,27016,30016,19016,45016,73017,10015,42017,06019,53020,9204,51027.48%
Flag of Hungary.svg  Hungary 10,33010,77011,46011,85012,98013,92015,00014,15015,86017,41020,48010,15098.26%
Flag of Ireland.svg  Ireland 38,81042,01056,12056,80062,16067,37072,32075,35086,49098,99095,29056,480145.53%
Flag of Italy.svg  Italy 26,74026,98027,48028,21028,94029,58030,08027,95030,82032,98035,4408,45031.31%
Flag of Latvia.svg  Latvia 11,32011,85012,43012,95013,90015,13015,98015,84017,71020,35021,44010,12089.40%
Flag of Lithuania.svg  Lithuania 11,85012,48012,86013,56014,95016,25017,52017,84020,11023,82025,07013,220111.56%
Flag of Luxembourg.svg  Luxembourg 90,36093,09095,07096,33097,52098,890100,700102,350113,050118,710118,77031,14035.54%
Flag of Malta.svg  Malta 18,68020,17022,49023,19025,54026,93028,33025,91029,57032,77035,34016,66089.19%
Flag of the Netherlands.svg  Netherlands 39,30039,82040,73041,59043,09044,92046,88045,67049,65054,15057,77018,80048.24%
Flag of Poland.svg  Poland 10,09010,56011,18011,05012,12012,99013,87013,72015,10017,30019,8409,75096.63%
Flag of Portugal.svg  Portugal 16,30016,64017,35018,06019,02019,95020,84019,47020,99023,53025,7309,43057.85%
Flag of Romania.svg  Romania 7,1507,5608,0908,5009,51010,58011,56011,43012,63014,92017,0309,880138.18%
Flag of Slovakia.svg  Slovakia 13,76014,09014,78014,96015,57016,50017,32017,11018,43019,98022,0908,33060.54%
Flag of Slovenia.svg  Slovenia 17,70018,25018,83019,59020,82022,14023,26022,37024,80027,05029,75012,05068.07%
Flag of Spain.svg  Spain 21,91022,23023,23023,99024,98025,76026,44023,63025,82028,28030,3208,27037.51%
Flag of Sweden.svg  Sweden 46,02045,26046,48046,99047,73046,26046,39046,42051,91053,69052,0406,87015.21%
Flag of Europe.svg  European Union (27)26,01026,58027,50028,19029,32030,29031,31030,05032,69035,44037,61011,84045.94%
Eurozone (20)29,24029,87030,82031,59032,71033,73034,76033,19035,95038,73040,99011,99041.34%
EU member states by Gini coefficients [6]
Member state201120122013201420152016201720182019202020212022
Flag of Austria.svg  Austria 27.427.627.027.627.227.227.926.827.527.026.727.8
Flag of Belgium (civil).svg  Belgium 26.326.525.925.926.226.326.125.725.125.424.124.9
Flag of Bulgaria.svg  Bulgaria 35.033.635.435.437.037.740.239.640.840.039.738.4
Flag of Croatia.svg  Croatia 31.230.930.930.230.429.829.929.729.228.329.228.5
Flag of Cyprus.svg  Cyprus 29.231.032.434.833.632.130.829.131.129.329.429.4
Flag of the Czech Republic.svg  Czech Republic 25.224.924.625.125.025.124.524.024.024.224.924.8
Flag of Denmark.svg  Denmark 26.626.526.827.727.427.727.627.927.527.327.027.7
Flag of Estonia.svg  Estonia 31.932.532.935.634.832.731.630.630.530.530.631.9
Flag of Finland.svg  Finland 25.825.925.425.625.225.425.325.926.226.525.726.6
Flag of France.svg  France 30.830.530.129.229.229.329.328.529.229.229.329.8
Flag of Germany.svg  Germany 29.028.329.730.730.129.529.131.129.730.531.228.8
Flag of Greece.svg  Greece 33.534.334.434.534.234.333.432.331.031.432.431.4
Flag of Hungary.svg  Hungary 26.927.228.328.628.228.228.128.728.028.027.627.4
Flag of Ireland.svg  Ireland 29.830.530.731.129.829.530.628.928.328.326.927.9
Flag of Italy.svg  Italy 32.532.432.832.432.433.132.733.432.832.532.932.7
Flag of Latvia.svg  Latvia 35.135.735.235.535.434.534.535.635.234.535.734.3
Flag of Lithuania.svg  Lithuania 33.032.034.635.037.937.037.636.935.435.135.436.2
Flag of Luxembourg.svg  Luxembourg 27.228.030.428.728.531.030.931.332.331.229.629.5
Flag of Malta.svg  Malta 27.227.127.927.728.128.528.328.728.030.331.231.1
Flag of the Netherlands.svg  Netherlands 25.825.425.126.226.726.927.127.426.828.226.426.3
Flag of Poland.svg  Poland 31.130.930.730.830.629.829.227.828.527.226.826.3
Flag of Portugal.svg  Portugal 34.234.534.234.534.033.933.532.131.931.233.032.0
Flag of Romania.svg  Romania 33.534.034.635.037.434.733.135.134.833.834.332.0
Flag of Slovakia.svg  Slovakia 25.725.324.226.123.724.323.220.922.820.921.821.2
Flag of Slovenia.svg  Slovenia 23.823.724.425.024.524.423.723.423.923.523.023.1
Flag of Spain.svg  Spain 34.034.233.734.734.634.534.133.233.032.133.032.0
Flag of Sweden.svg  Sweden 26.026.026.026.926.727.628.027.027.626.926.827.6
Flag of Europe.svg  European Union 30.530.430.630.930.830.630.330.430.230.030.229.6
Eurozone 30.630.530.731.030.730.730.430.630.230.030.229.6

Labour market

Unemployment rate by country in the EEA in March 2019 EU Unemployment.svg
Unemployment rate by country in the EEA in March 2019

The EU seasonally adjusted unemployment rate was 6.7% in September 2018. [95] The euro area unemployment rate was 8.1%. [95] Among the member states, the lowest unemployment rates were recorded in the Czech Republic (2.3%), Germany and Poland (both 3.4%), and the highest in Spain (14.9%) and Greece (19.0 in July 2018). [95]

Unemployment rate

The following table shows the history of the unemployment rate for all European Union member states:

Unemployment rate by country (base month is March of each year)
Member state [96] 200920102011201220132014201520162017201820192020202120222023
Flag of Austria.svg  Austria 5.04.94.74.65.45.65.65.95.84.94.84.86.74.24.5
Flag of Belgium.svg  Belgium 8.08.56.97.18.38.58.78.27.76.15.54.96.75.65.6
Flag of Bulgaria.svg  Bulgaria 6.39.911.212.113.011.910.08.16.45.34.54.45.94.34.2
Flag of Croatia.svg  Croatia 8.910.813.715.516.517.716.614.011.99.07.06.58.26.56.6
Flag of Cyprus.svg  Cyprus 4.66.76.910.714.916.216.213.012.28.97.66.37.85.96.3
Flag of the Czech Republic.svg  Czech Republic 5.97.76.86.97.26.55.64.13.32.12.02.03.42.32.6
Flag of Denmark.svg  Denmark 5.37.67.47.77.16.66.46.16.05.15.44.85.74.54.6
Flag of Estonia.svg  Estonia 4.311.919.214.011.19.17.96.75.56.14.65.16.75.46.7
Flag of Finland.svg  Finland 7.68.57.97.68.18.49.29.48.98.06.36.77.56.46.6
Flag of France.svg  France 8.99.39.19.510.310.210.310.29.59.28.67.48.17.47.1
Flag of Germany.svg  Germany 7.67.36.15.45.35.14.84.33.93.53.23.83.82.92.8
Flag of Greece.svg  Greece 9.111.616.022.727.126.926.023.922.320.217.815.917.112.911.2
Flag of Hungary.svg  Hungary 9.611.411.111.310.67.97.35.64.63.53.23.44.03.23.8
Flag of Ireland.svg  Ireland 11.113.214.315.013.612.09.88.97.25.95.15.07.75.14.1
Flag of Italy.svg  Italy 7.68.48.010.511.912.712.411.611.711.010.17.410.08.37.8
Flag of Latvia.svg  Latvia 14.820.416.715.911.911.19.89.78.87.76.47.47.67.06.0
Flag of Lithuania.svg  Lithuania 11.617.816.514.012.111.59.38.17.66.66.17.26.56.97.6
Flag of Luxembourg.svg  Luxembourg 5.44.64.75.15.76.06.46.45.75.65.66.56.14.54.9
Flag of Malta.svg  Malta 6.66.96.56.56.25.95.75.14.03.93.73.93.83.02.8
Flag of the Netherlands.svg  Netherlands 3.95.14.85.56.97.87.06.45.13.93.32.94.63.33.5
Flag of Poland.svg  Poland 7.910.09.49.810.69.77.86.55.03.83.63.03.93.02.7
Flag of Portugal.svg  Portugal 10.111.612.515.017.214.713.212.19.97.66.66.36.65.76.8
Flag of Romania.svg  Romania 6.07.36.87.06.97.06.76.25.24.43.84.55.95.75.5
Flag of Slovakia.svg  Slovakia 10.714.913.613.714.113.611.910.28.67.05.86.07.26.56.0
Flag of Slovenia.svg  Slovenia 5.36.98.17.910.810.19.28.37.05.54.44.55.04.03.7
Flag of Spain.svg  Spain 17.419.520.723.926.325.223.020.218.015.914.214.415.413.511.7 [97]
Flag of Sweden.svg  Sweden 7.88.87.97.58.38.07.57.36.46.17.36.89.57.67.2
Flag of Europe.svg  European Union 8.69.79.510.310.910.59.79.48.57.56.86.47.46.26.0
Unemployment rates in selected European countries and in the EU28 between 01/2004 and 04/2014 Unemployment in Europe.jpg
Unemployment rates in selected European countries and in the EU28 between 01/2004 and 04/2014

Public finance

Public finance (with limits according to the Maastricht criterion)
Member statePublic deficit as % of GDP (2022)
(E.U. limit : –3%)
[98]
Public debt as % of GDP (2022)
(E.U. limit : 60%)
[99]
HICP inflation rate (2021)
Max. 4.9% (as of 1 June 2022)
[100] [101]
Long-term interest rate (2021)
Max. 2.6% (as of 1 June 2022)
[100] [102]
Flag of Austria.svg  Austria –3.278.42.8–0.09
Flag of Belgium (civil).svg  Belgium –3.9105.13.2–0.01
Flag of Bulgaria.svg  Bulgaria –2.822.92.80.19
Flag of Croatia.svg  Croatia 0.468.42.70.45
Flag of Cyprus.svg  Cyprus 2.186.52.30.37
Flag of the Czech Republic.svg  Czech Republic –3.644.13.31.90
Flag of Denmark.svg  Denmark 3.330.11.9–0.06
Flag of Estonia.svg  Estonia –0.918.44.50.06
Flag of Finland.svg  Finland –0.973.42.1–0.09
Flag of France.svg  France –4.7111.62.10.01
Flag of Germany.svg  Germany –2.666.33.2–0.37
Flag of Greece.svg  Greece –2.3171.30.60.88
Flag of Hungary.svg  Hungary –6.273.35.23.06
Flag of Ireland.svg  Ireland 1.644.72.40.06
Flag of Italy.svg  Italy –8.0144.41.90.81
Flag of Latvia.svg  Latvia –4.440.83.20.00
Flag of Lithuania.svg  Lithuania –0.638.44.60.16
Flag of Luxembourg.svg  Luxembourg 0.224.63.5–0.36
Flag of Malta.svg  Malta –5.853.40.70.5
Flag of the Netherlands.svg  Netherlands 0.051.02.8–0.33
Flag of Poland.svg  Poland -3.749.15.21.95
Flag of Portugal.svg  Portugal –0.4113.90.90.30
Flag of Romania.svg  Romania –6.247.34.13.62
Flag of Slovakia.svg  Slovakia –2.057.82.8–0.08
Flag of Slovenia.svg  Slovenia –3.069.92.00.07
Flag of Spain.svg  Spain –4.8113.23.00.35
Flag of Sweden.svg  Sweden 0.733.02.70.27
Flag of Europe.svg  European Union –3.484.02.90.39
Eurozone –3.691.52.60.06

Trade

The European Union-Mercosur Free Trade Agreement would form one of the world's largest free trade areas. Press conference EU-Mercosul on June 26, 2019 (VII).jpg
The European Union–Mercosur Free Trade Agreement would form one of the world's largest free trade areas.
10 largest trading partners (2016, UK included in the EU before Brexit) 10 largest EU trading partners.png
10 largest trading partners (2016, UK included in the EU before Brexit)

The European Union is the largest exporter in the world [103] and as of 2008 the largest importer of goods and services. [104] [105] Internal trade between the member states is aided by the removal of barriers to trade such as tariffs and border controls. In the eurozone, trade is helped by not having any currency differences to deal with amongst most members. [106]

The European Union Association Agreement does something similar for a much larger range of countries, partly as a so-called soft approach ('a carrot instead of a stick') to influence the politics in those countries. The European Union represents all its members at the World Trade Organization (WTO), and acts on behalf of member states in any disputes. When the EU negotiates trade related agreement outside the WTO framework, the subsequent agreement must be approved by each individual EU member state government. [106]

In 2023, over half of EU enterprises exported products or services (51%), while 53% imported goods or services. [107] [108] [109] Slovenia, Slovakia, Austria, and the Czech Republic are the countries with the most exporting businesses, Malta and Cyprus have the fewest. [110] [111]

Trade with partner country groupings (2012) [112]
PartnerImports
(mil €)
 %
total
Exports
(mil €)
 %
total
Total
trade
(mil €)
 %
total
Total EU1,791,727100%1,686,774100%3,478,501100%
ACP 99,1965,5%86,6525,1%185,8485,3%
Andean Community 17,7281,0%11,7380,7%29,4670,8%
ASEAN 100,0355,6%81,3244,8%181,3605,2%
BRIC 577,51332,2%345,19820,5%922,71126,5%
CACM 9,5460,5%5,3540,3%14,9000,4%
EU Candidate Countries 55,3863,1%89,6545,3%145,0404,2%
CIS 273,50515,3%172,64110,2%446,14612,8%
EFTA 208,73911,7%186,22211,0%394,96111,4%
Latin America Countries 109,9786,1%110,2976,5%220,2756,3%
MEDA (excl. EU and Turkey)73,3414,1%92,8125,5%166,1534,8%
Mercosur 49,1962,7%50,2663,0%99,4612,9%
NAFTA 255,65714,3%351,09020,8%606,74617,4%
Main trading partners 2008–2011
Main trade partners [113] 2008200920102011
Exports (million euro)Imports (million euro)Total Trade (million euro)ExportsImportsTotal TradeExportsImportsTotal TradeExportsImportsTotal Trade
Total EU1,319,8191,582,9322,902,7511,101,7461,234,3172,336,0631,360,0591,531,0432,891,1021,561,8901,726,5143,288,404
Flag of the United States.svg  United States 247,818182,351430,169203,587154,862358,449242,451173,067415,518263,791191,555455,346
Flag of the People's Republic of China.svg  China 78,276247,815326,09182,391214,238296,629113,426282,509395,935136,372293,693430,065
Flag of Russia.svg  Russia 104,843178,294283,13765,587118,122183,70986,134160,709246,843108,355199,922308,277
Flag of Switzerland (Pantone).svg   Switzerland 100,53782,348182,88588,69380,570169,263110,40185,228195,629142,02293,202235,224
Flag of Norway.svg  Norway 43,69895,888139,58637,47668,864106,34041,91478,981120,89546,67893,813140,491
Flag of Japan.svg  Japan 42,34776,177118,52435,93258,23394,16543,94867,258111,20649,01869,549118,567
Flag of Turkey.svg  Turkey 54,41545,963100,37844,38536,22880,61361,74742,397104,14473,09648,143121,239
Flag of India.svg  India 31,34929,54060,88927,47725,41452,89134,86633,30868,11240,55839,90680,464
Flag of South Korea.svg  South Korea 25,49139,56565,05621,59632,37053,96627,95739,39167,34832,51036,17568,685
Flag of Brazil.svg  Brazil 26,30235,85562,15721,57425,92647,50031,46633,23864,70435,75238,93974,691
Flag of Canada (Pantone).svg  Canada 25,46825,04350,51121,93419,28541,21926,75824,69751,45529,88530,70860,593
Flag of Singapore.svg  Singapore 22,21316,13738,35020,40414,57934,98324,55018,76043,31027,25619,18446,440
Flag of South Africa.svg  South Africa 20,80024,59745,39716,08319,22935,31221,75520,40642,16126,21221,80748,019
Flag of Saudi Arabia.svg  Saudi Arabia 21,08122,00143,08219,06811,76630,83423,21616,30039,51626,40128,44054,841
Flag of the Republic of China.svg  Taiwan 11,59524,06935,66010,02117,87527,89614,78224,13838,92016,21224,23040,532
Flag of Hong Kong.svg  Hong Kong 21,78612,25834,04419,66713,27732,94427,25014,30241,55230,76310,96941,732
Flag of Australia (converted).svg  Australia 26,68913,78540,47421,9309,92331,85326,95512,45439,40931,15914,94446,103
Flag of Algeria.svg  Algeria 15,39128,25943,65014,80717,41032,21715,58421,06936,65317,27927,84445,123
Flag of Libya.svg  Libya 5,83635,30841,1446,48420,87027,3547,08729,23036,3172,09310,44412,537
Flag of Mexico.svg  Mexico 21,97613,98135,59715,98810,13526,12321,34213,74835,09023,90816,98540,893
Trade balance, EU28 (as of 2018 before Brexit)
Sources: Eurostat [ext_lt_intertrd] [114]
Trade balance, EU27 (as of 2020 post Brexit)
Sources: Eurostat, December 2019

Euro area international trade in goods surplus €23.1 bn €23.4 bn surplus for EU27

Regional variation

Comparing the richest areas of the EU can be a difficult task. This is because the NUTS 1 & 2 regions are not homogenous, some of them being very large regions, such as NUTS-1 Hesse (21,100 km2) or NUTS-1 Île-de-France (12,011 km2), whilst other NUTS regions are much smaller, for example NUTS-1 Hamburg (755 km2). An extreme example is Finland, which is divided for historical reasons into mainland Finland with 5.3 million inhabitants and Åland, an autonomous archipelago with a population of 27,000, or about the population of a small Finnish city.

One problem with this data is that some areas are subject to a large number of commuters coming into the area, thereby artificially inflating the figures. It has the effect of raising GDP but not altering the number of people living in the area, inflating the GDP per capita figure. Similar problems can be produced by a large number of tourists visiting the area. The data is used to define regions that are supported with financial aid in programs such as the European Regional Development Fund. The decision to delineate a Nomenclature of Territorial Units for Statistics (NUTS) region is to a large extent arbitrary (i.e. not based on objective and uniform criteria across Europe), and is decided at European level (See also: Regions of the European Union).

NUTS-1 and NUTS-2 regions

The top 10 NUTS-1 and NUTS-2 regions with the highest GDP per capita are almost all, except one, in the first fifteen-member states: Prague is the only one in the 13 new member states that joined in May 2004, January 2007 and July 2013. The leading regions in the ranking of NUTS-2 regional GDP per inhabitant in 2019 were the Grand Duchy of Luxembourg (260%), the Southern region of Ireland (240%), and Prague, Czech Republic (205%). Figures for these three regions, however, were artificially inflated by the commuters who do not reside in these regions ("Net commuter inflows in these regions push up production to a level that could not be achieved by the resident active population on its own. The result is that GDP per inhabitant appears to be overestimated in these regions and underestimated in regions with commuter outflows.". [115] Another example of artificial inflation is Groningen. The calculated GDP per capita is very high because of the large natural gas reserves in this region, but Groningen is one of the poorest parts in the Netherlands.

Among the 16 NUTS-2 regions exceeding the 160% level in 2020, two were in Belgium, Germany, Ireland and the Netherlands and one each in the Czech Republic, Denmark, France, Poland, Romania, Slovakia and Sweden, as well as in the single region Grand Duchy of Luxembourg.

The NUTS Regulation lays down a minimum population size of 3 million and a maximum size of 7 million for the average NUTS-1 region, whereas a minimum of 800,000 and a maximum of 3 million for NUTS-2 regions. [116] This definition, however, is not respected by Eurostat. For example, the région of Île-de-France, with 11.6 million inhabitants, is treated as a NUTS-2 region, while the state Free Hanseatic City of Bremen, with only 664,000 inhabitants, is treated as a NUTS-1 region.

Among the lowest regions in the ranking in 2021 most were in Bulgaria, with the lowest figure recorded in South-Central Region. Among the poorest 20 regions, six were in Greece, five in Bulgaria, three in Hungary, two in France and one each in Croatia, Poland, Romania and Slovakia.

See also

Related Research Articles

<span class="mw-page-title-main">Economy of Bulgaria</span>

The economy of Bulgaria functions on the principles of the free market, having a large private sector and a smaller public one. Bulgaria is an industrialised high-income country according to the World Bank, and is a member of the European Union (EU), the World Trade Organization (WTO), the Organization for Security and Co-operation in Europe (OSCE) and the Organization of the Black Sea Economic Cooperation (BSEC). The Bulgarian economy has experienced significant growth (538%), starting from $13.15 billion and reaching estimated gross domestic product (GDP) of $86 billion or $203 billion, GDP per capita of $31,148, average gross monthly salary of 2,009 leva, and average net monthly salary of $2,102 (2022). The national currency is the lev, pegged to the euro at 1.95583 leva for 1 euro. The lev is the strongest and most stable currency in Eastern Europe.

<span class="mw-page-title-main">Economy of the Czech Republic</span>

The economy of the Czech Republic is a developed export-oriented social market economy based in services, manufacturing, and innovation that maintains a high-income welfare state and the European social model. The Czech Republic participates in the European Single Market as a member of the European Union, and is therefore a part of the economy of the European Union. It uses its own currency, the Czech koruna, instead of the euro. It is a member of the Organisation for Economic Co-operation and Development (OECD). The Czech Republic ranks 16th in inequality-adjusted human development and 24th in World Bank Human Capital Index, ahead of countries such as the United States, the United Kingdom or France. It was described by The Guardian as "one of Europe's most flourishing economies".

<span class="mw-page-title-main">European Union</span> Supranational political and economic union of 27 states

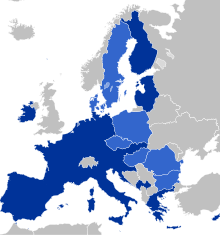
The European Union (EU) is a supranational political and economic union of 27 member states that are located primarily in Europe. The Union has a total area of 4,233,255 km2 (1,634,469 sq mi) and an estimated total population of over 448 million. The EU has often been described as a sui generis political entity combining the characteristics of both a federation and a confederation.

<span class="mw-page-title-main">Economy of Estonia</span>

The economy of Estonia is rated advanced by the World Bank, i.e. with high quality of life and advanced infrastructure relative to less industrialized nations. Estonia is a member of the European Union and eurozone. The economy is heavily influenced by developments in the Finnish and Swedish economies.

<span class="mw-page-title-main">Euro</span> Currency of most countries in the European Union

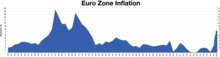
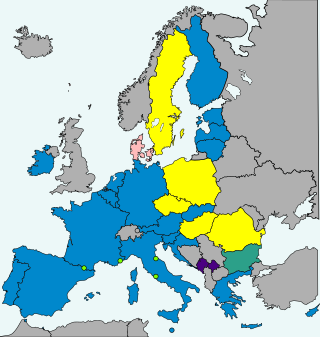
The euro is the official currency of 20 of the 27 member states of the European Union. This group of states is officially known as the euro area or, more commonly, the eurozone. The euro is divided into 100 euro cents.

<span class="mw-page-title-main">Economy of Latvia</span>

The economy of Latvia is an open economy in Europe and is part of the European Single Market. Latvia is a member of the World Trade Organization (WTO) since 1999, a member of the European Union since 2004, a member of the Eurozone since 2014 and a member of the OECD since 2016. Latvia is ranked the 14th in the world by the Ease of Doing Business Index prepared by the World Bank Group. According to the Human Development Report 2011, Latvia belongs to the group of very high human development countries. Due to its geographical location, transit services are highly developed, along with timber and wood processing, agriculture and food products, and manufacturing of machinery and electronic devices.

<span class="mw-page-title-main">Economy of Luxembourg</span>

The economy of Luxembourg is largely dependent on the banking, steel, and industrial sectors. Citizens of Luxembourg enjoy the highest per capita gross domestic product in the world, according to an IMF estimate in 2022.

<span class="mw-page-title-main">Economy of Malta</span>

The economy of Malta is a highly industrialised service-based economy. It is classified as an advanced economy by the International Monetary Fund and is considered a high-income country by the World Bank and an innovation-driven economy by the World Economic Forum. It is a member of the European Union and of the eurozone, having formally adopted the euro on 1 January 2008.

<span class="mw-page-title-main">Economy of Poland</span>

The economy of Poland is an industrialised, mixed economy with a developed market that serves as the sixth-largest in the European Union by nominal GDP and fifth-largest by GDP (PPP). Poland boasts the extensive public services characteristic of most developed economies. Since 1988, Poland has pursued a policy of economic liberalisation but retained an advanced public welfare system. This includes universal free public healthcare and education, extensive provisions of free public childcare, and parental leave. The country is considered by many to be a successful post-communist state. It is classified as a high-income economy by the World Bank, ranking 20th worldwide in terms of GDP (PPP), 21st in terms of GDP (nominal), and 21st in the 2023 Economic Complexity Index.

<span class="mw-page-title-main">Economy of Slovakia</span>

The economy of Slovakia is based upon Slovakia becoming an EU member state in 2004, and adopting the euro at the beginning of 2009. Its capital, Bratislava, is the largest financial centre in Slovakia. As of Q1 2018, the unemployment rate was 5.72%.

<span class="mw-page-title-main">Economy of Slovenia</span>

The economy of Slovenia is a developed economy, and the country enjoys a high level of prosperity and stability as well as above-average GDP per capita by purchasing power parity at 92% of the EU average in 2022. The nominal GDP in 2023 is 68.108 billion USD, nominal GDP per capita (GDP/pc) in 2023 is USD 32,350. The highest GDP/pc is in central Slovenia, where the capital city Ljubljana is located. It is part of the Western Slovenia statistical region, which has a higher GDP/pc than eastern Slovenia.

<span class="mw-page-title-main">Economy of the Netherlands</span>

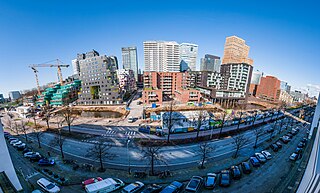
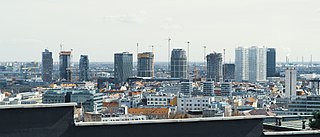
The economy of the Netherlands is a highly developed market economy focused on trade and logistics, manufacturing, services, innovation and technology and sustainable and renewable energy. It is the world's 18th largest economy by nominal GDP and the 28th largest by purchasing power parity (PPP) and is the fifth largest economy in European Union by nominal GDP. It has the world's 11th highest per capita GDP (nominal) and the 13th highest per capita GDP (PPP) as of 2023 making it one of the highest earning nations in the world. Many of the world's largest tech companies are based in its capital Amsterdam or have established their European headquarters in the city, such as IBM, Microsoft, Google, Oracle, Cisco, Uber, Netflix and Tesla. Its second largest city Rotterdam is a major trade, logistics and economic center of the world and is Europe's largest seaport. Netherlands is ranked fifth on global innovation index and fourth on the Global Competitiveness Report. Among OECD nations, Netherlands has a highly efficient and strong social security system; social expenditure stood at roughly 25.3% of GDP.

<span class="mw-page-title-main">Economy of Belgium</span>

The economy of Belgium is a highly developed, high-income, mixed economy.

<span class="mw-page-title-main">Economy of Austria</span>

The economy of Austria is a highly developed social market economy, with the country being one of the fourteen richest in the world in terms of GDP per capita. Until the 1980s, many of Austria's largest industry firms were nationalised. In recent years, privatisation has reduced state holdings to a level comparable to other European economies.

<span class="mw-page-title-main">Eurozone</span> Area in which the euro is the official currency

The euro area, commonly called the eurozone (EZ), is a currency union of 20 member states of the European Union (EU) that have adopted the euro (€) as their primary currency and sole legal tender, and have thus fully implemented EMU policies.

<span class="mw-page-title-main">Economy of Europe</span>

The economy of Europe comprises about 748 million people in 50 countries.

<span class="mw-page-title-main">Regional policy of the European Union</span> Regional policy of the EU

The Regional Policy of the European Union (EU), also referred as Cohesion Policy, is a policy with the stated aim of improving the economic well-being of regions in the European Union and also to avoid regional disparities. More than one third of the EU's budget is devoted to this policy, which aims to remove economic, social and territorial disparities across the EU, restructure declining industrial areas and diversify rural areas which have declining agriculture. In doing so, EU regional policy is geared towards making regions more competitive, fostering economic growth and creating new jobs. The policy also has a role to play in wider challenges for the future, including climate change, energy supply and globalisation.

<span class="mw-page-title-main">Hungary and the euro</span> Plans since 2003 to replace the Hungarian forint with the euro

While the Hungarian government has been planning since 2003 to replace the Hungarian forint with the euro, as of 2023, there is no target date and the forint is not part of the European Exchange Rate Mechanism. An economic study in 2008 found that the adoption of the euro would increase foreign investment in Hungary by 30%, although current governor of the Hungarian National Bank and former Minister of the National Economy György Matolcsy said they did not want to give up the country's independence regarding corporate tax matters.

<span class="mw-page-title-main">Romania and the euro</span> Overview of the relationship between Romania and the Euro

Romania's national currency is the leu. After Romania joined the European Union (EU) in 2007, the country became required to replace the leu with the euro once it meets all four euro convergence criteria, as stated in article 140 of the Treaty on the Functioning of the European Union. As of 2023, the only currency on the market is the leu and the euro is not yet used in shops. The Romanian leu is not part of the European Exchange Rate Mechanism, although Romanian authorities are working to prepare the changeover to the euro. To achieve the currency changeover, Romania must undergo at least two years of stability within the limits of the convergence criteria.

<span class="mw-page-title-main">João Leão</span> Portuguese economist, university professor, and politician

João Rodrigo Reis Carvalho Leão is a Portuguese economist, university professor, and politician. He served as Minister of Finance in the government of Prime Minister António Costa of Portugal, sworn in on 15 June 2020.

References

  1. "Population on 1 January by age and sex". ec.europa.eu/eurostat. Eurostat. 8 March 2024.
  2. 1 2 3 4 5 "World Economic Outlook database: October 2022". IMF.org. International Monetary Fund . Retrieved 11 October 2022.
  3. 1 2 "World Economic Outlook Database, April 2020". EuroStat. Retrieved 16 April 2020.
  4. 1 2 3 4 "The World Factbook – Central Intelligence Agency". www.cia.gov. Retrieved 13 October 2016.
  5. "People at risk of poverty or social exclusion". ec.europa.eu/eurostat. Eurostat . Retrieved 2 February 2020.
  6. 1 2 "Gini coefficient of equivalised disposable income – EU-SILC survey". ec.europa.eu/eurostat. Eurostat . Retrieved 9 May 2020.
  7. 1 2 "Inequalities in Human Development in the 21st Century" (PDF). UNDP . Retrieved 15 July 2020.
  8. "Labor force, total - European Union". data.worldbank.org. World Bank . Retrieved 15 July 2020.
  9. 1 2 "Employment rate by sex, age group 20-64". ec.europa.eu/eurostat. Eurostat . Retrieved 15 May 2020.
  10. 1 2 "Unemployment by sex and age - monthly average". appsso.eurostat.ec.europa.eu. Eurostat . Retrieved 4 October 2020.
  11. "New indicator on annual average salaries in the EU - Products Eurostat News - Eurostat". ec.europa.eu. Retrieved 11 March 2023.
  12. "Database – Eurostat". ec.europa.eu.
  13. 1 2 3 "Export and Import Partners of European Union". The World Factbook. CIA. 2015. Retrieved 10 July 2016.
  14. 1 2 "Client and Supplier Countries of the EU27 in Merchandise Trade (value %) (2021, excluding intra-EU trade)" (PDF). European Commission. 20 April 2022. Archived from the original (PDF) on 17 January 2017. Retrieved 7 September 2019.
  15. "Eurostat – Tables, Graphs and Maps Interface (TGM) table". ec.europa.eu. Retrieved 15 October 2016.
  16. "Eurostat – Tables, Graphs and Maps Interface (TGM) table". ec.europa.eu. Retrieved 15 October 2016.
  17. "Balance of payment statistics – Statistics Explained". ec.europa.eu. Retrieved 15 October 2016.
  18. "International investment position statistics – Statistics Explained". ec.europa.eu.
  19. 1 2 3 4 5 6 "Euro area government deficit at 5.1% and EU at 4.7% of GDP" (PDF). ec.europa.eu. Eurostat. Retrieved 15 September 2022.
  20. Source: OECD: Financing for sustainable development; Table 1, page 6. Quote, page 3: "In 2015, total net ODA from the 28 EU member states was USD 74 billion, representing 0.47% of their GNI. Net disbursements by EU Institutions were USD 13.8 billion, a slight fall of 0.5% in real terms compared to 2014."
  21. EU Institutions $13.85 billion, EU member states $73.80 billion. [20]
  22. 1 2 3 "The EU as a borrower – European Commission". ec.europa.eu. Retrieved 15 October 2016.
  23. "Scope affirms the European Union's and Euratom's AAA rating with Stable Outlook". Scope Ratings. Retrieved 22 September 2023.
  24. "Foreign reserves and own funds". European Central Bank. Retrieved 15 October 2016.
  25. "Report for Selected Country Groups and Subjects". www.imf.org. Retrieved 12 October 2022.
  26. "Triennial Central Bank Survey 2007" (PDF). BIS. 19 December 2007. Retrieved 25 July 2009.
  27. Aristovnik, Aleksander; Čeč, Tanja (30 March 2010). "Compositional Analysis of Foreign Currency Reserves in the 1999–2007 Period. The Euro vs. The Dollar As Leading Reserve Currency" (PDF). Munich Personal RePEc Archive, Paper No. 14350. Retrieved 27 December 2010.
  28. Boesler, Matthew (11 November 2013). "There Are Only Two Real Threats to the US Dollar's Status As The International Reserve Currency". Business Insider. Retrieved 8 December 2013.
  29. "All Laureates in Economics". Nobel Foundation. Archived from the original on 1 June 2013. Retrieved 14 October 2020.
  30. "European Union - The World Factbook". www.cia.gov. 12 July 2022.
  31. "World Economic Outlook Database, October 2019". IMF.org. International Monetary Fund. Retrieved 30 January 2020.
  32. "World Economic Outlook Database, October 2019". www.imf.org. Retrieved 31 January 2020.
  33. "World Economic Outlook Database, October 2019". IMF.org. International Monetary Fund. Retrieved 13 January 2020.
  34. ec.europa.eu https://ec.europa.eu/eurostat/databrowser/view/tessi190/default/table?lang=en . Retrieved 7 May 2024.{{cite web}}: Missing or empty |title= (help)
  35. "Eurostat – Tables, Graphs and Maps Interface (TGM) table". ec.europa.eu. Retrieved 14 October 2016.
  36. "GINI index (World Bank estimate) | Data". data.worldbank.org. Retrieved 14 October 2016.
  37. "The World Factbook – Central Intelligence Agency". www.cia.gov. Archived from the original on 11 December 2007. Retrieved 12 October 2016.
  38. "The World Factbook – Central Intelligence Agency". www.cia.gov. Archived from the original on 11 December 2007. Retrieved 12 October 2016.
  39. "Monthly Reports". www.world-exchanges.org. Retrieved 12 October 2016.
  40. Top Trading Partners Archived 17 January 2017 at the Wayback Machine Client and Supplier Countries of the EU28 in Merchandise Trade (value %) (2015, excluding intra-EU trade). Accessed 29 October 2018
  41. "Eurostat – Tables, Graphs and Maps Interface (TGM) table". ec.europa.eu. Retrieved 17 December 2023.
  42. "Romania becomes third eastern European EU country to be bailed out". The Guardian. 25 March 2009.
  43. © European Union, Integrated Financial Reporting Package Overview, Financial year 2017 Retrieved 15 November 2019.
  44. Special European Council, 17-21 July 2020 Retrieved 15 November 2020.
  45. "Europäische Union: Anteile der Wirtschaftssektoren am Bruttoinlandsprodukt (BIP) von 2004 bis 2014". statista.de (in German). World Bank. Retrieved 22 March 2016.
  46. European Commission, Overview of the Capital Markets Union, accessed 9 May 2018
  47. European Commission, Capital markets union action plan, accessed 9 May 2018
  48. Conference Report: European Financial Market Integration, 6 June 2016, accessed 20 September 2018
  49. Vértesy, László (2019). "The legal and regulatory aspects of the free movement of capital - towards the Capital Markets Union". Journal of Legal Theory HU (4): 110–128.
  50. "EU's capital markets union 2.0, explained". POLITICO. 8 June 2017. Retrieved 7 March 2018.
  51. "What is the capital markets union?". European Commission. Retrieved 7 March 2018.
  52. "EU Capital Markets Union". Financial Times. Retrieved 7 March 2018.
  53. White, Lucy (24 April 2018). "EU's Dombrovskis ignites fresh row over City's market access post-Brexit". Archived from the original on 26 April 2018. Retrieved 25 April 2018. Regarding Capital Markets Union, the European Commission's plan to improve access to non-bank financing across the EU, he said the "departure of the UK makes this project even more important and even more urgent. It will have to compensate for the EU's largest financial centre not being in the EU and not being in the single market any more"
  54. "The Global Financial Centres Index 22" (PDF). Long Finance. September 2017.
  55. 1 2 Bank, European Investment (12 January 2022). EIB Investment Report 2021/2022: Recovery as a springboard for change. European Investment Bank. ISBN   978-92-861-5155-2.
  56. "Impacts of the COVID-19 pandemic on EU industries" (PDF).
  57. 1 2 3 4 5 6 7 Bank, European Investment (12 January 2022). EIB Investment Report 2021/2022: Recovery as a springboard for change. European Investment Bank. ISBN   978-92-861-5155-2.
  58. "Coronavirus (COVID-19): SME policy responses". OECD. Retrieved 31 January 2022.
  59. "Jobs and economy during the coronavirus pandemic". European Commission.
  60. "Impact of Covid-19 crisis on services". ec.europa.eu. Retrieved 31 January 2022.
  61. "The territorial impact of COVID-19: Managing the crisis and recovery across levels of government". OECD. Retrieved 23 March 2022.
  62. "Home". oecd-ilibrary.org. Retrieved 23 March 2022.
  63. "Cultural and creative sectors in post-COVID-19 Europe" (PDF).
  64. "Covid-19: how the EU can help small businesses". europarl.europa.eu. 14 January 2021. Retrieved 31 January 2022.
  65. "New EIB study: How do EU and US firms perceive and invest in climate change?". sciencebusiness.net. Retrieved 9 February 2022.
  66. "Impacts of the COVID-19 pandemic on EU industries" (PDF).
  67. Gandhi, Prashant; Khanna, Somesh; Ramaswamy, Sree (1 April 2016). "Which Industries Are the Most Digital (and Why)?". Harvard Business Review. ISSN   0017-8012 . Retrieved 16 August 2022.
  68. Johnson, Eric. "Council Post: Three Industries That Are In Dire Need Of Digitization". Forbes. Retrieved 16 August 2022.
  69. Bank, European Investment (12 October 2023). EIB Investment Survey 2023 - European Union overview. European Investment Bank. ISBN   978-92-861-5609-0.
  70. "Press corner". European Commission. Retrieved 23 October 2023.
  71. "Long-term competitiveness of the EU: looking beyond 2030" (PDF).
  72. Bank, European Investment (12 October 2023). EIB Investment Survey 2023 - European Union overview. European Investment Bank. ISBN   978-92-861-5609-0.
  73. "EU expenditure and revenue". Financial Programming and Budget. European Commission. Retrieved 15 September 2014.
  74. "EU budget myths". EC Europa. European Commission. Retrieved 15 September 2014.
  75. "Oil and petroleum products - a statistical overview". ec.europa.eu.
  76. "Press corner". European Commission - European Commission. Retrieved 23 May 2024.
  77. "5 facts about the EU's goal of climate neutrality". www.consilium.europa.eu. Retrieved 16 August 2022.
  78. "The employment impact of climate change adaptation" (PDF).
  79. "Assessing the Implications of Climate Change Adaptation on Employment in the EU" (PDF).
  80. "Press corner". European Commission - European Commission. Retrieved 16 August 2022.
  81. "The World's Largest Apparel Companies 2018: Christian Dior, Inditex And Nike Continue To Dominate". Forbes . Retrieved 9 November 2020.
  82. "Strategy Study: The Danone Growth Study". www.cascade.app. Retrieved 23 May 2024.
  83. "The world's 100 largest banks, 2021". S&P Global Market Intelligence. Archived from the original on 26 July 2021. Retrieved 27 February 2022.
  84. "The recovery will be digital" (PDF). McKinsey. Archived (PDF) from the original on 23 June 2023.
  85. "Green, Digital, Inclusive and Fair: How can Cohesion Policy Rise to the New Territorial Challenges?". RSA Europe. Retrieved 16 August 2022.
  86. "Digital platform economy - European Commission proposes new measures in the fight against false self-employment". www.taylorwessing.com. 27 January 2022. Retrieved 16 August 2022.
  87. "Digital transformation: importance, benefits and EU policy - EU monitor". www.eumonitor.eu. Retrieved 16 August 2022.
  88. "Fortune Global 500 List 2022". Fortune.
  89. Vértesy, László (2018). "Macroeconomic Legal Trends in the EU11 Countries" (PDF). Public Governance, Administration and Finances Law Review. 3 (1): 94–108. doi:10.53116/pgaflr.2018.1.9. S2CID   219380180. Archived from the original (PDF) on 12 August 2019. Retrieved 12 August 2019.
  90. "From savings to spending: Fast track to recovery". European Stability Mechanism. 29 July 2021. Retrieved 23 March 2022.
  91. "European Central Bank – Financial Stability Review, November 2021". Financial Stability Review. 17 November 2021. ISSN   1830-2025. Archived from the original on 30 September 2023.
  92. "Global Economic Effects of COVID-19" (PDF). Congressional Research Service.
  93. "Eurostat – Tables, Graphs and Maps Interface (TGM) table". Epp.eurostat.ec.europa.eu. Retrieved 2 May 2022.
  94. 1 2 "Gross domestic product at market prices (Current prices and per capita)". Eurostat.
  95. 1 2 3 "Eurostat – Tables, Graphs and Maps Interface (TGM) table". ec.europa.eu.
  96. "Archived copy". Archived from the original on 25 April 2021. Retrieved 25 April 2021.{{cite web}}: CS1 maint: archived copy as title (link)
  97. "España fulmina su récord de empleo con 783.000 ocupados más en 2023 y baja la tasa de paro al 11,7%". 26 January 2024.
  98. "General government deficit (-) and surplus (+) - annual data". Eurostat . Retrieved 25 August 2022.
  99. "General government gross debt – annual data". Eurostat. Retrieved 25 August 2022.
  100. 1 2 "Convergence Report 2022". European Central Bank (2022). 10 June 2020. Retrieved 8 December 2022.
  101. "HICP - inflation rate". Eurostat. Retrieved 25 August 2022.
  102. "EMU convergence criterion series - annual data". Eurostat. Retrieved 25 August 2022.
  103. "Central Intelligence Agency". Cia.gov. Archived from the original on 19 August 2016. Retrieved 26 April 2011.
  104. "World trade report 2009" (PDF). WTO information website.
  105. "EU position in world trade". European Commission. Retrieved 24 May 2015.
  106. 1 2 Se-jeong, Kim (19 July 2009). "EU-Korea FTA Will Be a Long Process: Greek Ambassador". The Korea Times . Retrieved 15 August 2009.
  107. Bank, European Investment (12 October 2023). EIB Investment Survey 2023 - European Union overview. European Investment Bank. ISBN   978-92-861-5609-0.
  108. "European Economic forecast summer 2023" (PDF).
  109. "World Trade Statistical Review 2023" (PDF).
  110. Bank, European Investment (12 October 2023). EIB Investment Survey 2023 - European Union overview. European Investment Bank. ISBN   978-92-861-5609-0.
  111. Netherlands, Statistics (9 September 2022). "4. Exports of services to a new EU country: opportunities and barriers". Statistics Netherlands. Retrieved 24 October 2023.
  112. 1 2 "Top Trading Partners 2021 – Trade Statistics" (PDF). trade.ec.europa.eu. Archived from the original (PDF) on 20 December 2022.
  113. "Extra-EU27 trade, by main partners, total product". Epp.eurostat.ec.europa.eu. 17 October 2013. Archived from the original on 2 November 2013. Retrieved 20 May 2014.
  114. "Data services - Eurostat". ec.europa.eu. Retrieved 11 March 2023.
  115. 1 2 3 Eurostat (20 February 2023). "Gross domestic product (GDP) at current market prices by NUTS 2 regions". Europa web portal. Retrieved 20 February 2023.
  116. "Archived copy". Archived from the original on 9 December 2008. Retrieved 10 July 2008.{{cite web}}: CS1 maint: archived copy as title (link)
  117. 1 2 Eurostat (22 February 2022). "Gross domestic product (GDP) at current market prices by NUTS 2 regions". Europa web portal. Retrieved 22 February 2022.

The following links are used for the GDP growth and GDP totals (IMF):