
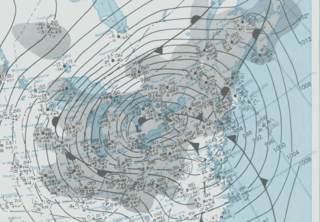
The North American blizzard of 1996 was a severe nor'easter that paralyzed the United States East Coast with up to 4 feet (1.2 m) of wind-driven snow from January 6 to January 8, 1996. This storm was a classic example of a nor'easter, but the storm would not have been as historically significant without the presence of the arctic high pressure system located to the north of New York. It was followed by another storm, an Alberta Clipper, on January 12, then unusually warm weather and torrential rain which caused rapid melting and river flooding. Along with the March Superstorm of 1993 and the January 2016 United States blizzard, it is one of only three snowstorms to receive the top rating of 5, or "Extreme", on the Northeast Snowfall Impact Scale (NESIS).
The Great Blizzard of 1978 was a historic winter storm that struck the Ohio Valley and Great Lakes regions of the United States as well as Southern Ontario in Canada from Wednesday, January 25 through Friday, January 27, 1978. It is often cited as one of the most severe blizzards in US history. The third lowest non-tropical atmospheric pressure ever recorded in the mainland United States occurred as the storm passed over Mount Clemens, Michigan, where barometer readings fell to 956.0 mb (28.23 inHg) on January 26.
The Northeast Snowfall Impact Scale (NESIS) was created to measure snowstorms in the U.S. Northeast in much the same way the Saffir-Simpson Hurricane Scale records hurricane intensity and the Enhanced Fujita Scale with tornadoes.

The North American blizzard of 2006 was a nor'easter that began on the evening of February 11, 2006. It dumped heavy snow across the Mid-Atlantic and New England states, from Virginia to Maine through the early evening of February 12, and ended in Atlantic Canada on February 13. The major cities from Baltimore to Boston received at least a foot of snow, with a second-highest amount of 26.9 inches (68.3 cm) in New York City, the most since at least 1869, the start of record keeping, only broken by the January 2016 United States blizzard nearly 10 years later.

The December 2009 North American blizzard was a powerful nor'easter that formed over the Gulf of Mexico in December 2009, and became a major snowstorm that affected the East Coast of the United States and Canadian Atlantic provinces. The snowstorm brought record-breaking December snowfall totals to Washington, D.C., Baltimore, and Philadelphia.

The March 18–20, 1956 nor'easter was a significant winter storm in the United States that affected the Mid-Atlantic States and southern New England. The storm ranked as Category 1, or "notable", on the Northeast Snowfall Impact Scale. A high-pressure area north of New York State, developing in the wake of another system on March 15–16, provided cold air for the snowfall. It was among a series of snowstorms to affect the region during the month.
Paul Kocin is a meteorologist and winter weather expert. He grew up on Long Island, New York and received his B.S. from Cornell University, followed by his M.Sc. from Pennsylvania State University. After graduation, he briefly worked for NASA as a contractor then was hired by the US National Weather Service at the Hydrometeorological Prediction Center in 1989. Kocin worked as an on-air personality with The Weather Channel from 1998 to 2006. He returned to NOAA afterward, first as a surface weather analyst and then to the medium range desk, forecasting weather for Alaska up to eight days in advance.

The December 1960 nor'easter was a significant early-season winter storm that impacted the Mid-Atlantic and New England regions of the United States. Moderate to heavy snowfall fell from West Virginia to eastern Maine, amounting to 10 in (25 cm) or more in parts of 13 states and peaking at 21.4 in (54.4 cm) at Newark, New Jersey. The storm was accompanied by strong winds, gusting to over 90 mph (145 km/h) in coastal New England, and left in its wake a dangerously cold air mass. The storm originated in a weak low pressure area which formed over the western Gulf of Mexico on December 10. A secondary low developed over South Carolina on the next day, supported by the merger of two troughs aloft. Sliding southeast of New England, the new storm explosively deepened to become a full-fledged nor'easter, with a minimum central air pressure of 966 mbar. It began to weaken over the Canadian Maritimes.

The March 1960 nor'easter was a severe winter storm that impacted the Mid-Atlantic and New England regions of the United States. The storm ranked as Category 4, or "crippling", on the Northeast Snowfall Impact Scale. Northeasterly flow, combined with the storm's slower forward motion, enhanced snowfall across the region. The cyclone began moving away from the United States on March 5. It took place during a stormy period in the affected region, contributing to record snowfall.
The Regional Snowfall Index (RSI) is a scale used by NOAA to assess the societal impact of winter storms in the eastern two-thirds of the United States and classify them into one of six categories. The system was first implemented in 2014, and is a replacement for the Northeast Snowfall Impact Scale (NESIS) system which the National Climatic Data Center (NCDC) began using in 2005. The NCDC has retroactively assigned RSI values to almost 600 historical storms that have occurred since 1900.

The 2015–16 North American winter was not as frigid across North America and the United States as compared to the 2013–14 and 2014–15 winters. This was mainly due to a strong El Niño, which caused generally warmer-then-average conditions. However, despite the warmth, significant weather systems still occurred, including a snowstorm and flash flooding in Texas at the end of December and a large tornado outbreak at the end of February. The main event of the winter season, by far and large, was when a crippling and historic blizzard struck the Northeast in late January, dumping up to 3 feet of snow in and around the metropolitan areas. Several other smaller snow events affected the Northeast as well, but for the most part the heaviest snowstorms and ice stayed out further west, such as a severe blizzard in western Texas in late December, and a major late-season snowstorm in Colorado in mid-April.
The 2009–10 North American winter saw several major blizzards affect the Northeastern United States. It refers to winter as it occurred across the North American continent from late 2009 to early 2010. While there is no well-agreed-upon date used to indicate the start of winter in the Northern Hemisphere, there are two definitions of winter which may be used. Based on the astronomical definition, winter begins at the winter solstice, which in 2009 occurred on December 21, and ends at the March equinox, which in 2010 occurred on March 20. Based on the meteorological definition, the first day of winter is December 1 and the last day February 28. Both definitions involve a period of approximately three months, with some variability.

The 2010–11 North American winter was influenced by an ongoing La Niña, seeing winter storms and very cold temperatures affect a large portion of the continental United States, even as far south as the Texas Panhandle. Notable events included a major blizzard that struck the Northeastern United States in late December with up to 2 feet (24 in) of snowfall and a significant tornado outbreak on New Year's Eve in the southern United States. By far the most notable event was a historic blizzard that impacted areas from Oklahoma to Michigan in early February which broke numerous snowfall records, and one of the few winter storms to rank as a Category 5 on the Regional Snowfall Index. In addition, Oklahoma set a statewide low temperature record in February.

The 2020–21 North American winter was the most significant winter season to affect North America in several years, and the costliest on record, with a damage total of at least $201.845 billion. The season featured 6 storms ranking on the Regional Snowfall Index scale, with 4 storms ranking as at least a Category 3. Most of the winter's damage and fatalities occurred due to a historic and major cold wave in mid-February. Several other significant events occurred, including a crippling early-season ice storm in the Southern Plains, a powerful nor'easter in mid-December, another major nor'easter in early February, two major and widespread winter storms in mid-February, and a major blizzard in the Rocky Mountains in mid-March. The winter-related events were responsible for at least 358 fatalities, making it the deadliest season since 1992–93. A La Niña pattern influenced much of the winter in North America.

The December 15–17, 2020 nor'easter was a powerful nor'easter that hammered the Northeastern United States and produced widespread swaths of over 1 foot (12 in) of snow in much of the region from December 15–17, 2020, ending a 1,000+ day high-impact snowstorm drought in much of the Mid-Atlantic and coastal New England regions. The system developed out of a weak area of low-pressure that first developed over the Central United States producing some snowfall before moving eastward, and by December 16, a new, dominant area of low pressure began to develop along the Southeast coast. This low steadily deepened as it moved along and impacted the Mid-Atlantic coastline, prompting several winter-related advisories and warnings for much of the Northeast.

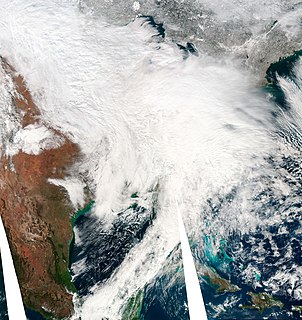
The January 31 – February 3, 2021 nor'easter, also known as the 2021 Groundhog Day nor'easter, was a powerful, severe, and erratic nor'easter that impacted much of the Northeastern United States and Eastern Canada from February 1–3 with heavy snowfall, blizzard conditions, strong gusty winds, storm surge, and coastal flooding. The storm first developed as an extratropical cyclone off the West Coast of the United States on January 25, with the storm sending a powerful atmospheric river into West Coast states such as California, where very heavy rainfall, snowfall, and strong wind gusts were recorded, causing several hundred thousand power outages and numerous mudslides. The system moved ashore several days later, moving into the Midwest and dropping several inches of snow across the region. On February 1, the system developed into a nor'easter off the coast of the Northeastern U.S, bringing prolific amounts of snowfall to the region. Large metropolitan areas such as Boston and New York City saw as much as 18–24 inches (46–61 cm) of snow accumulations from January 31 to February 2, making it the worst snowstorm to affect the megalopolis since the January 2016 blizzard. It was given the unofficial name Winter Storm Orlena by The Weather Channel.

