This list of U.S. cities by American Hispanic and Latino population covers all incorporated cities and Census-designated places with a population over 100,000 and a proportion of Hispanic and Latino residents over 30% in the 50 U.S. states, the District of Columbia, and the territory of Puerto Rico and the population in each city that is either Hispanic or Latino.
The data source for the list is the 2020 United States Census. [1]
Overall, at the time of the 2020 Census, there were 65.3 Million Americans who were Hispanic or Latino, making up 19.5% of the U.S. population. State by state, the highest number of Hispanic Americans could be found in California (15.6 Million), Texas (11.4 Million), Florida (5.7 Million), New York state (4.0 Million), and Puerto Rico (3.3 Million). Meanwhile, the highest proportions of Hispanic Americans were in Puerto Rico (99.1%), New Mexico (47.8%), California (39.4%), Texas (39.4%), and Arizona (30.8%).
Throughout the country, there are 343 cities with a population over 100,000. 48 of them had Hispanic majorities, and in 74 more cities, between 30% and 50% of the population identified as Hispanic. Out of the 48 majority-Hispanic cities, 27 are in California, 9 were in Texas, and 5 were in Puerto Rico. Florida and New Jersey had two each, while New Mexico, Nevada, and Pennsylvania all had one.
In 2020, the largest cities which had a Hispanic majority were San Antonio, Texas (1 430 000), El Paso, Texas (679 000), Fresno, California (542 000), Miami, Florida (442 000), and Bakersfield, California (403 000).
The list below consists of each city (or city-equivalent) in the fifty states, the District of Columbia, and Puerto Rico with a population over 100,000 and a Hispanic proportion over 40% as of the 2020 Census. It includes the city's total population, the number of Hispanic people in the city, and the percentage of people in the city who are Hispanic. The table is initially sorted by the Hispanic proportion of each city but is sortable by any of its columns, as can be found by clicking the table headers.
Municipalities in Puerto Rico have their rows shaded in yellow
Census-Designated Places have their rows shaded in green
City | Region | Hispanic % | Population | Hispanic population |
---|---|---|---|---|
Caguas | Puerto Rico | 99.24% | 127,245 | 126,270 |
Ponce | Puerto Rico | 99.14% | 137,491 | 136,300 |
Bayamón | Puerto Rico | 98.97% | 185,187 | 183,263 |
Carolina | Puerto Rico | 98.46% | 154,815 | 152,417 |
San Juan | Puerto Rico | 97.77% | 342,259 | 334,601 |
East Los Angeles | California | 95.17% | 118,786 | 113,037 |
Laredo | Texas | 95.15% | 255,205 | 242,818 |
Hialeah | Florida | 94.03% | 223,109 | 209,784 |
Brownsville | Texas | 93.88% | 186,738 | 175,310 |
Edinburg | Texas | 88.44% | 100,243 | 88,658 |
McAllen | Texas | 86.67% | 142,210 | 123,250 |
El Paso | Texas | 81.25% | 678,815 | 551,513 |
Salinas | California | 79.60% | 163,542 | 130,178 |
Santa Ana | California | 76.73% | 310,227 | 238,022 |
Santa Maria | California | 76.54% | 109,707 | 83,968 |
Downey | California | 75.09% | 114,355 | 85,866 |
Oxnard | California | 74.72% | 202,063 | 150,984 |
Rialto | California | 74.35% | 104,026 | 77,345 |
Norwalk | California | 71.56% | 102,773 | 73,548 |
Pomona | California | 71.22% | 151,713 | 108,044 |
Jurupa Valley | California | 70.49% | 105,053 | 74,047 |
Miami | Florida | 70.20% | 442,241 | 310,472 |
Ontario | California | 68.43% | 175,265 | 119,928 |
San Bernardino | California | 68.04% | 222,101 | 151,125 |
Pasadena | Texas | 67.81% | 151,950 | 103,037 |
Fontana | California | 67.79% | 208,393 | 141,269 |
Elizabeth | New Jersey | 65.72% | 137,298 | 90,233 |
El Monte | California | 64.70% | 109,450 | 70,819 |
San Antonio | Texas | 63.85% | 1,434,625 | 916,010 |
Paterson | New Jersey | 61.89% | 159,732 | 98,863 |
Palmdale | California | 61.81% | 169,450 | 104,742 |
Moreno Valley | California | 61.43% | 208,634 | 128,168 |
Corpus Christi | Texas | 60.71% | 317,863 | 192,990 |
Hesperia | California | 60.60% | 100,744 | 61,051 |
Las Cruces | New Mexico | 60.33% | 111,385 | 67,204 |
Chula Vista | California | 59.78% | 275,487 | 164,698 |
Odessa | Texas | 56.14% | 114,428 | 64,244 |
Victorville | California | 55.44% | 134,810 | 74,745 |
Riverside | California | 54.73% | 314,998 | 172,386 |
Sunrise Manor | Nevada | 54.57% | 205,618 | 112,208 |
Allentown | Pennsylvania | 54.22% | 125,845 | 68,232 |
Anaheim | California | 53.82% | 346,824 | 186,651 |
West Covina | California | 53.06% | 109,501 | 58,102 |
Bakersfield | California | 52.75% | 403,455 | 212,822 |
Visalia | California | 52.75% | 141,384 | 74,575 |
Escondido | California | 51.79% | 151,038 | 78,226 |
Inglewood | California | 51.67% | 107,762 | 55,677 |
Fresno | California | 50.50% | 542,107 | 273,771 |
Pembroke Pines | Florida | 49.73% | 171,178 | 85,133 |
Pueblo | Colorado | 49.28% | 111,876 | 55,133 |
Albuquerque | New Mexico | 47.69% | 564,559 | 269,238 |
Elgin | Illinois | 47.44% | 114,797 | 54,460 |
Los Angeles | California | 46.94% | 3,898,747 | 1,829,991 |
Springfield | Massachusetts | 46.74% | 155,929 | 72,874 |
Corona | California | 46.52% | 157,136 | 73,102 |
Grand Prairie | Texas | 45.26% | 196,100 | 88,749 |
Lancaster | California | 45.15% | 173,516 | 78,338 |
Richmond | California | 44.58% | 116,448 | 51,912 |
Lehigh Acres | Florida | 44.43% | 114,287 | 50,772 |
Mesquite | Texas | 44.15% | 150,108 | 66,272 |
Stockton | California | 44.14% | 320,804 | 141,601 |
Hartford | Connecticut | 44.04% | 121,054 | 53,315 |
Lynn | Massachusetts | 44.01% | 101,253 | 44,560 |
Houston | Texas | 43.97% | 2,304,580 | 1,013,423 |
Providence | Rhode Island | 43.90% | 190,934 | 83,815 |
Long Beach | California | 43.28% | 466,742 | 201,997 |
Modesto | California | 42.91% | 218,464 | 93,733 |
Garland | Texas | 42.66% | 246,018 | 104,945 |
Bridgeport | Connecticut | 42.28% | 148,654 | 62,853 |
Dallas | Texas | 42.26% | 1,304,379 | 551,174 |
Tucson | Arizona | 42.18% | 542,629 | 228,878 |
Yonkers | New York | 42.10% | 211,569 | 89,065 |
Rio Rancho | New Mexico | 41.65% | 104,046 | 43,334 |
Midland | Texas | 41.62% | 132,524 | 55,161 |
Aurora | Illinois | 41.53% | 180,542 | 74,981 |
Hayward | California | 41.16% | 162,954 | 67,079 |
Orange | California | 41.15% | 139,911 | 57,575 |
Phoenix | Arizona | 41.14% | 1,608,139 | 661,574 |
Irving | Texas | 41.09% | 256,684 | 105,469 |
Miramar | Florida | 41.08% | 134,721 | 55,337 |
North Las Vegas | Nevada | 40.73% | 262,527 | 106,940 |
Greeley | Colorado | 40.22% | 108,795 | 43,758 |
Hollywood | Florida | 39.87% | 153,067 | 61,031 |
Waterbury | Connecticut | 39.58% | 114,403 | 45,281 |
Davie | Florida | 39.52% | 105,691 | 41,769 |
West Valley City | Utah | 39.42% | 140,230 | 55,278 |
Glendale | Arizona | 39.31% | 248,325 | 97,617 |
Menifee | California | 37.79% | 102,527 | 38,749 |
Fullerton | California | 37.76% | 143,617 | 54,225 |
Rancho Cucamonga | California | 37.41% | 174,453 | 65,261 |
Garden Grove | California | 37.28% | 171,949 | 64,102 |
Costa Mesa | California | 36.45% | 111,918 | 40,795 |
Antioch | California | 36.40% | 115,291 | 41,965 |
Newark | New Jersey | 36.39% | 311,549 | 113,374 |
Oceanside | California | 36.37% | 174,068 | 63,316 |
Thornton | Colorado | 36.23% | 141,867 | 51,392 |
Lubbock | Texas | 35.60% | 257,141 | 91,545 |
Ventura | California | 35.12% | 110,763 | 38,902 |
Fort Worth | Texas | 34.81% | 918,915 | 319,836 |
Kansas City | Kansas | 34.57% | 156,607 | 54,144 |
Santa Clarita | California | 34.43% | 228,673 | 78,735 |
Santa Rosa | California | 34.29% | 178,127 | 61,082 |
Joliet | Illinois | 33.59% | 150,362 | 50,510 |
Paradise | Nevada | 33.53% | 191,238 | 64,116 |
Las Vegas | Nevada | 33.31% | 641,903 | 213,828 |
Pasadena | California | 32.98% | 138,699 | 45,742 |
Miami Gardens | Florida | 32.88% | 111,640 | 36,711 |
Orlando | Florida | 32.86% | 307,573 | 101,061 |
Amarillo | Texas | 32.59% | 200,393 | 65,302 |
Austin | Texas | 32.48% | 961,855 | 312,448 |
Lewisville | Texas | 32.06% | 111,822 | 35,853 |
Carrollton | Texas | 31.68% | 133,434 | 42,272 |
Waco | Texas | 31.67% | 138,486 | 43,857 |
San Jose | California | 31.21% | 1,013,240 | 316,266 |
Concord | California | 31.06% | 125,410 | 38,953 |
Arlington | Texas | 30.68% | 394,266 | 120,944 |
New Haven | Connecticut | 30.64% | 134,023 | 41,068 |
Fairfield | California | 30.63% | 119,881 | 36,723 |
Murrieta | California | 30.58% | 110,949 | 33,925 |
Clovis | California | 30.46% | 120,124 | 36,594 |
Aurora | Colorado | 30.27% | 386,261 | 116,902 |
Sparks | Nevada | 30.13% | 108,445 | 32,670 |
The population of Puerto Rico has been shaped by native American settlement, European colonization especially under the Spanish Empire, slavery and economic migration. Demographic features of the population of Puerto Rico include population density, ethnicity, education of the populace, health of the populace, economic status, religious affiliations and other aspects of the population.
Spanish is the second most spoken language in the United States. Over 42 million people aged five or older speak Spanish at home. Spanish is also the most learned language other than English, with about 8 million students. Estimates count up to 57 million native speakers, heritage language speakers, and second-language speakers. There is an Academy of the Spanish Language located in the United States as well.
Mexican Americans are Americans of Mexican heritage. In 2022, Mexican Americans comprised 11.2% of the US population and 58.9% of all Hispanic and Latino Americans. In 2019, 71% of Mexican Americans were born in the United States; they make up 53% of the total population of foreign-born Hispanic Americans and 25% of the total foreign-born population. Chicano is a term used by some to describe the unique identity held by Mexican-Americans. The United States is home to the second-largest Mexican community in the world, behind only Mexico. Most Mexican Americans reside in the Southwest, with over 60% of Mexican Americans living in the states of California and Texas.
Hispanic and Latino Americans are Americans of Spanish and/or Latin American ancestry. These demographics include all Americans who identify as Hispanic or Latino regardless of ancestry. As of 2020, the Census Bureau estimated that there were almost 65.3 million Hispanics and Latinos living in the United States and its territories.
In the United States of America, majority-minority area or minority-majority area is a term describing a U.S. state or jurisdiction whose population is composed of less than 50% non-Hispanic whites. Racial data is derived from self-identification questions on the U.S. census and on U.S. Census Bureau estimates.. The term is often used in voting rights law to designate voting districts that are designed under the Voting Rights Act to enable ethnic or language minorities "the opportunity to elect their candidate of choice." In that context, the term was first used by the Supreme Court in 1977. The Court had previously used the term in employment discrimination and labor relations cases.
The United States has a racially and ethnically diverse population. At the federal level, race and ethnicity have been categorized separately. The most recent United States census recognized five racial categories, as well as people who belong to two or more of the racial categories. The United States also recognizes the broader notion of ethnicity. The 2000 census and 2010 American Community Survey inquired about the "ancestry" of residents, while the 2020 census allowed people to enter their "origins". The Census Bureau also classified respondents as either Hispanic or Latino, identifying as an ethnicity, which comprises the minority group in the nation.
Stateside Puerto Ricans, also ambiguously known as Puerto Rican Americans, or Puerto Ricans in the United States, are Puerto Ricans who are in the United States proper of the 50 states and the District of Columbia who were born in or trace any family ancestry to the unincorporated US territory of Puerto Rico.
According to the U.S. Census Bureau, as of 2023, New York was the fourth largest state in population after California, Texas, and Florida, with a population of 19,571,216, a decrease of over 600,000 people, or −3.1%, since the 2020 census. The population change between 2000–2006 includes a natural increase of 601,779 people and a decrease due to net migration of 422,481 people out of the state. Immigration from outside the United States resulted in a net increase of 820,388 people, and migration within the country produced a net loss of about 800,213.
In the United States, a Hispanic or Latino is an individual who is of full or partial Hispanic or Latino descent. Although not differentiated in the U.S. census definition, White Latino Americans may also be defined to include those who identify or considered as white and either originate from or have descent from not only Spanish speaking countries in Latin America but also other Romance languages other than Spanish, such as Brazil, Haiti, and French Guiana.
Caribbean Americans or West Indian Americans are Americans who trace their ancestry to the Caribbean. Caribbean Americans are a multi-ethnic and multi-racial group that trace their ancestry further in time mostly to Africa, as well as Asia, the Indigenous peoples of the Americas, and to Europe. As of 2016, about 13 million — about 4% of the total U.S. population — have Caribbean ancestry.
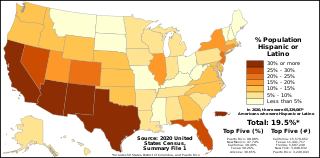
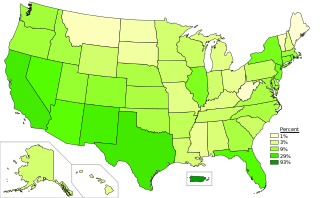
The demographics of Hispanic and Latino Americans depict a population that is the second-largest ethnic group in the United States, 62 million people or 18.7% of the national population.
According to the 2018 American Community Survey, New England had an estimated population of 14,853,290, of which 48.7% were male and 51.3% were female. Approximately 19.7% of the population were under 18 years of age; 17.4% were 65 years of age or over.
Latino Americans make up an increasing share of the United States (U.S.) electorate. A record 29 million Latinos were eligible to vote in the 2018 midterm elections, accounting for 12.8% of all eligible voters, a new high. They made up an estimated 11% of all voters nationwide on Election Day, nearly matching their share of the U.S. eligible voter population.
Philadelphia has the second largest Puerto Rican community outside of Puerto Rico after New York City. As of the 2010 U.S. Census, an estimated 121,643 Puerto Ricans were living in Philadelphia, up from 91,527 in 2000. Recent 2017 estimates by the U.S. Census Bureau put the number of Puerto Ricans living in Philadelphia at 134,934. In 2019, estimates put the number of Puerto Ricans at 146,153. Many Puerto Ricans in the Philadelphia area have engaged in circular migration in which they spend periods of time living in Philadelphia and periods of time living in Puerto Rico.
Spanish Americans are Americans whose ancestry originates wholly or partly from Spain. They are the longest-established European American group in the modern United States, with a very small group descending from those explorations leaving from Spain and the Viceroyalty of New Spain, and starting in the early 1500s, of 42 of the future U.S. states from California to Florida; and beginning a continuous presence in Florida since 1565 and New Mexico since 1598. In the 2020 United States census, 978,978 self-identified with "Spaniard" origins representing (0.4%) of the white alone or in combination population who responded to the question. Other results include 866,356 (0.4%) identifying as "Spanish" and 50,966 who identified with "Spanish American".