As of 2020, Hispanics and Latinos make up 18.7% of the total U.S. population (approximately 62 million out of a total of around 330 million). The state with the largest percentage of Hispanics and Latinos is New Mexico at 47.7%. The state with the largest Hispanic and Latino population overall is California with 15.6 million Hispanics and Latinos. Hispanics are the largest racial or ethnic group in both states and will become the largest in Texas in the early 2020s. [1]
The following are lists of the Hispanic and Latino population per state in the United States.
State/Territory | Pop 2000 | Pop 2010 | Pop 2020 | 2000 % | 2010 % | 2020 % | % growth 2000-2010 | % growth 2010-2020 |
---|---|---|---|---|---|---|---|---|
Alabama | 75,830 | 185,602 | 264,047 | 1.7% | 3.9% | 5.3% | +144.8% | +42.3% |
Alaska | 25,852 | 39,250 | 49,824 | 4.1% | 5.5% | 6.8% | +51.8% | +26.9% |
Arizona | 1,295,617 | 1,895,149 | 2,192,253 | 25.3% | 29.6% | 30.7% | +46.3% | +15.7% |
Arkansas | 86,866 | 186,050 | 256,847 | 3.2% | 6.4% | 8.5% | +114.2% | +38.1% |
California | 10,966,556 | 14,013,719 | 15,579,652 | 32.4% | 37.6% | 39.4% | +27.8% | +11.2% |
Colorado | 735,801 | 1,038,687 | 1,263,390 | 17.1% | 20.7% | 21.9% | +41.2% | +21.6% |
Connecticut | 320,323 | 479,087 | 623,293 | 9.4% | 13.4% | 17.3% | +49.6% | +30.1% |
Delaware | 37,277 | 73,221 | 104,290 | 4.8% | 8.2% | 10.5% | +96.4% | +42.4% |
District of Columbia | 44,953 | 54,749 | 77,652 | 7.9% | 9.1% | 11.3% | +21.8% | +41.8% |
Florida | 2,682,715 | 4,223,806 | 5,697,240 | 16.8% | 22.5% | 26.5% | +57.4% | +34.9% |
Georgia | 435,227 | 853,689 | 1,123,457 | 5.3% | 8.8% | 10.5% | +96.1% | +31.6% |
Hawaii | 87,699 | 120,842 | 138,923 | 7.2% | 8.9% | 9.5% | +37.8% | +14.4% |
Idaho | 101,690 | 175,901 | 239,407 | 7.9% | 11.2% | 13.0% | +73.0% | +36.1% |
Illinois | 1,530,262 | 2,027,578 | 2,337,410 | 12.3% | 15.8% | 18.2% | +32.5% | +15.3% |
Indiana | 214,536 | 389,707 | 554,191 | 3.5% | 6.0% | 8.2% | +81.7% | +42.2% |
Iowa | 82,473 | 151,544 | 215,986 | 2.8% | 5.0% | 6.8% | +83.7% | +42.5% |
Kansas | 188,252 | 300,042 | 382,603 | 7.0% | 10.5% | 13.0% | +59.4% | +27.5% |
Kentucky | 59,939 | 132,836 | 207,854 | 1.5% | 3.1% | 4.6% | +121.6% | +56.5% |
Louisiana | 107,738 | 192,560 | 322,549 | 2.4% | 4.2% | 6.2% | +78.7% | +67.5% |
Maine | 9,360 | 16,935 | 26,609 | 0.7% | 1.3% | 2.0% | +80.9% | +57.1% |
Maryland | 227,916 | 470,632 | 729,745 | 4.3% | 8.2% | 11.8% | +106.5% | +55.1% |
Massachusetts | 428,729 | 627,654 | 887,685 | 6.8% | 9.6% | 12.6% | +46.4% | +41.4% |
Michigan | 323,877 | 436,358 | 564,422 | 3.3% | 4.4% | 5.6% | +34.7% | +29.3% |
Minnesota | 143,382 | 250,258 | 345,640 | 2.9% | 4.7% | 6.1% | +74.5% | +38.1% |
Mississippi | 39,569 | 81,481 | 105,220 | 1.4% | 2.7% | 3.6% | +105.9% | +29.1% |
Missouri | 118,592 | 212,470 | 303,068 | 2.1% | 3.5% | 4.9% | +79.2% | +42.6% |
Montana | 18,081 | 28,565 | 45,199 | 2.0% | 2.9% | 4.2% | +58.0% | +58.2% |
Nebraska | 94,425 | 167,405 | 234,715 | 5.5% | 9.2% | 12.0% | +77.3% | +40.2% |
Nevada | 393,970 | 716,501 | 890,257 | 19.7% | 26.5% | 28.7% | +81.9% | +24.3% |
New Hampshire | 20,489 | 36,704 | 59,454 | 1.7% | 2.8% | 4.3% | +79.1% | +62.0% |
New Jersey | 1,117,191 | 1,555,144 | 2,002,575 | 13.3% | 17.7% | 21.6% | +39.2% | +28.8% |
New Mexico | 765,386 | 953,403 | 1,010,811 | 42.1% | 46.3% | 47.7% | +24.6% | +6.0% |
New York | 2,867,583 | 3,402,997 | 3,948,032 | 15.1% | 17.6% | 19.5% | +19.2% | +16.0% |
North Carolina | 378,963 | 800,120 | 1,118,596 | 4.7% | 8.4% | 10.7% | +111.1% | +39.8% |
North Dakota | 7,786 | 13,467 | 33,412 | 1.2% | 2.0% | 4.3% | +73.0% | +148.1% |
Ohio | 217,123 | 354,674 | 521,308 | 1.9% | 3.1% | 4.4% | +63.4% | +47.0% |
Oklahoma | 179,304 | 332,007 | 471,931 | 5.2% | 8.9% | 11.9% | +85.2% | +42.1% |
Oregon | 275,314 | 450,062 | 588,757 | 8.0% | 11.7% | 13.9% | +63.5% | +30.8% |
Pennsylvania | 394,088 | 719,660 | 1,049,615 | 3.2% | 5.7% | 8.1% | +82.6% | +45.8% |
Rhode Island | 90,820 | 130,655 | 182,101 | 8.7% | 12.4% | 16.6% | +43.9% | +39.4% |
South Carolina | 95,076 | 235,682 | 352,838 | 2.4% | 5.1% | 6.9% | +147.9% | +49.7% |
South Dakota | 10,903 | 22,119 | 38,741 | 1.4% | 2.7% | 4.4% | +102.9% | +75.1% |
Tennessee | 123,838 | 290,059 | 479,187 | 2.2% | 4.6% | 6.9% | +134.2% | +65.2% |
Texas | 6,669,666 | 9,460,921 | 11,441,717 | 32.0% | 37.6% | 39.3% | +41.8% | +20.9% |
Utah | 201,559 | 358,340 | 492,912 | 9.0% | 13.0% | 15.1% | +77.8% | +37.6% |
Vermont | 5,504 | 9,208 | 15,504 | 0.9% | 1.5% | 2.4% | +67.3% | +68.4% |
Virginia | 329,540 | 631,825 | 908,749 | 4.7% | 7.9% | 10.5% | +91.7% | +43.8% |
Washington | 441,509 | 755,790 | 1,059,213 | 7.5% | 11.2% | 13.7% | +71.2% | +40.1% |
West Virginia | 12,279 | 22,268 | 34,827 | 0.7% | 1.2% | 1.9% | +81.4% | +56.4% |
Wisconsin | 192,921 | 336,056 | 447,290 | 3.6% | 5.9% | 7.6% | +74.2% | +33.1% |
Wyoming | 31,669 | 50,231 | 59,046 | 6.4% | 8.9% | 10.2% | +58.6% | +17.5% |
American Samoa | 109 [6] | 0.2% | ||||||
Guam | 2,124 [7] | 1.4% | ||||||
Northern Mariana Islands | 117 [8] | 0.2% | ||||||
Puerto Rico | 3,762,746 | 3,688,455 | 3,249,043 | 98.8% | 99.0% | 98.9% | -2.0% | -11.9% |
U.S. Virgin Islands | 15,196 | 18,514 | 14.0% | 17.4% [9] | ||||
United States of America | 35,305,818 | 50,477,594 | 65,329,087 | 12.5% | 16.3% | 19.5% | +43.0% | +23.0% |
In the 2010s, Hispanic population growth slowed down due to a massive decline in immigration from Latin America as well as a large decline in birth rates; Asians became the fastest growing demographic group. A much higher proportion of Hispanics choose mixed race rather than white in the 2020 census as compared to previous censuses. [10] Hispanics accounted for 51.1% of population growth between 2010-2020 and 56% between 2000 and 2010. [11]
The proportion of the population which is Hispanic increased at least slightly in every state. Growth was slowest in the states with large historical Mexican American and Hispano populations including New Mexico, California, Nevada, Arizona, Texas and Colorado where relative growth in population proportion was 5% or less compared to 15% nationally. Growth was highest in states which historically lacked a Hispanic population continuing the trend of intrastate migration for mostly lower wage jobs in the 21st century by Hispanics. These states include North Dakota, Tennessee, Vermont and Maine where relative growth in population proportion was over 50%. Pennsylvania, with a Hispanic population of 0.1% in 1940, saw a greater numeric increase in the Hispanic population than Arizona; with a Hispanic population of 20.4% in 1940.
State/Territory | Mexican American Population (2020) [12] [13] | Percentage |
---|---|---|
Alabama | 124,210 | 2.6 |
Alaska | 28,049 | 3.8 |
Arizona | 1,926,274 | 27.8 |
Arkansas | 159,273 | 5.4 |
California | 12,621,844 | 32.3 |
Colorado | 869,149 | 15.8 |
Connecticut | 57,383 | 1.6 |
Delaware | 34,244 | 3.7 |
District of Columbia | 14,146 | 1.6 |
Florida | 713,518 | 9.8 |
Georgia | 561,710 | 5.5 |
Hawaii | 45,832 | 3.3 |
Idaho | 181,185 | 10.8 |
Illinois | 1,715,831 | 13.4 |
Indiana | 333,219 | 5.1 |
Iowa | 143,368 | 4.6 |
Kansas | 278,213 | 9.6 |
Kentucky | 89,217 | 2.1 |
Louisiana | 93,750 | 2.1 |
Maine | 6,251 | 0.5 |
Maryland | 97,231 | 1.7 |
Massachusetts | 47,911 | 0.7 |
Michigan | 363,421 | 4.9 |
Minnesota | 201,580 | 3.7 |
Mississippi | 56,282 | 1.9 |
Missouri | 172,055 | 2.9 |
Montana | 27,510 | 2.7 |
Nebraska | 150,424 | 7.9 |
Nevada | 629,469 | 21.6 |
New Hampshire | 8,686 | 0.7 |
New Jersey | 230,875 | 2.6 |
New Mexico | 658,516 | 31.5 |
New York | 477,194 | 2.5 |
North Carolina | 538,505 | 5.3 |
North Dakota | 17,915 | 2.3 |
Ohio | 200,060 | 1.8 |
Oklahoma | 333,166 | 8.5 |
Oregon | 431,169 | 10.6 |
Pennsylvania | 152,537 | 1.2 |
Puerto Rico | 10,834 | 0.4 |
Rhode Island | 11,123 | 1.1 |
South Carolina | 150,582 | 3.1 |
South Dakota | 21,229 | 2.5 |
Tennessee | 217,557 | 3.3 |
Texas | 9,394,506 | 33.7 |
Utah | 306,375 | 10.7 |
Vermont | 3,335 | 0.6 |
Virginia | 173,046 | 2.1 |
Washington | 728,208 | 10.0 |
West Virginia | 10,982 | 0.6 |
Wisconsin | 278,789 | 4.9 |
Wyoming | 44,704 | 7.7 |
Total US | 36,600,000 | 12.2 |
State/Territory | Puerto Rican-American Population (2010 Census) [14] [15] | Percentage [note 1] [16] |
---|---|---|
Alabama | 12,225 | 0.3 |
Alaska | 4,502 | 0.6 |
Arizona | 34,787 | 0.5 |
Arkansas | 4,789 | 0.2 |
California | 189,945 | 0.5 |
Colorado | 22,995 | 0.5 |
Connecticut | 252,972 | 7.1 |
Delaware | 22,533 | 2.5 |
District of Columbia | 3,129 | 0.5 |
Florida | 847,550 | 4.5 |
Georgia | 71,987 | 0.7 |
Hawaii | 44,116 | 3.2 |
Idaho | 2,910 | 0.2 |
Illinois | 182,989 | 1.4 |
Indiana | 30,304 | 0.5 |
Iowa | 4,885 | 0.2 |
Kansas | 9,247 | 0.3 |
Kentucky | 11,454 | 0.3 |
Louisiana | 11,603 | 0.3 |
Maine | 4,377 | 0.3 |
Maryland | 42,572 | 0.7 |
Massachusetts | 266,125 | 4.1 |
Michigan | 37,267 | 0.4 |
Minnesota | 10,807 | 0.2 |
Mississippi | 5,888 | 0.2 |
Missouri | 12,236 | 0.2 |
Montana | 1,491 | 0.2 |
Nebraska | 3,242 | 0.2 |
Nevada | 20,664 | 0.8 |
New Hampshire | 11,729 | 0.9 |
New Jersey | 434,092 | 4.9 |
New Mexico | 7,964 | 0.4 |
New York | 1,070,558 | 5.5 |
North Carolina | 71,800 | 0.8 |
North Dakota | 987 | 0.1 |
Ohio | 94,965 | 0.8 |
Oklahoma | 12,223 | 0.3 |
Oregon | 8,845 | 0.2 |
Pennsylvania | 366,082 | 2.9 |
Rhode Island | 34,979 | 3.3 |
South Carolina | 26,493 | 0.6 |
South Dakota | 1,483 | 0.2 |
Tennessee | 21,060 | 0.3 |
Texas | 130,576 | 0.5 |
Utah | 7,182 | 0.3 |
Vermont | 2,261 | 0.4 |
Virginia | 73,958 | 0.9 |
Washington | 25,838 | 0.4 |
West Virginia | 3,701 | 0.2 |
Wisconsin | 46,323 | 0.8 |
Wyoming | 1,026 | 0.2 |
United States | 4,623,716 | 1.5 |
State/Territory | 1910 | 1920 | 1930 | 1940 | 1950 | 1960 | 1970 | 1980 | 1990 | 2000 | 2010 | 2020 |
---|---|---|---|---|---|---|---|---|---|---|---|---|
United States | 0.4% | 0.7% | 1.2% | 1.5% | 2.1% | 3.2% | 4.4% | 6.4% | 9.0% | 12.5% | 16.3% | 19.5% |
Alabama | 0.0% | 0.0% | 0.0% | 0.0% | 0.4% | 0.9% | 0.6% | 1.7% | 3.9% | 5.3% | ||
Alaska | 2.1% | 2.4% | 3.2% | 4.1% | 5.5% | 6.8% | ||||||
Arizona | 28.6% | 30.4% | 30.2% | 20.4% | 17.2% | 14.9% | 17.3% | 16.2% | 18.8% | 25.3% | 29.6% | 30.7% |
Arkansas | 0.0% | 0.0% | 0.0% | 0.0% | 0.5% | 0.8% | 0.8% | 3.2% | 6.4% | 8.5% | ||
California | 2.1% | 3.7% | 6.8% | 6.0% | 7.2% | 9.1% | 13.7% | 19.2% | 25.8% | 32.4% | 37.6% | 39.4% |
Colorado | 0.4% | 1.6% | 5.7% | 8.2% | 9.0% | 9.0% | 11.6% | 11.8% | 12.9% | 17.1% | 20.7% | 21.9% |
Connecticut | 0.0% | 0.0% | 0.0% | 0.1% | 2.4% | 4.0% | 6.5% | 9.4% | 13.4% | 17.3% | ||
Delaware | 0.0% | 0.0% | 0.0% | 0.1% | 1.1% | 1.6% | 2.4% | 4.8% | 8.2% | 10.5% | ||
District of Columbia | 0.0% | 0.0% | 0.0% | 0.1% | 2.1% | 2.8% | 5.4% | 7.9% | 9.1% | 11.3% | ||
Florida | 0.0% | 0.0% | 0.0% | 1.3% | 6.6% | 8.8% | 12.2% | 16.8% | 22.5% | 26.5% | ||
Georgia | 0.0% | 0.0% | 0.0% | 0.0% | 0.6% | 1.1% | 1.7% | 5.3% | 8.8% | 10.5% | ||
Hawaii | 3.0% | 7.4% | 7.3% | 7.2% | 8.9% | 9.5% | ||||||
Idaho | 0.0% | 0.3% | 0.3% | 0.5% | 2.6% | 3.9% | 5.3% | 7.9% | 11.2% | 13.0% | ||
Illinois | 0.0% | 0.1% | 0.4% | 0.3% | 3.3% | 5.6% | 7.9% | 12.3% | 15.8% | 18.2% | ||
Indiana | 0.0% | 0.0% | 0.3% | 0.2% | 1.3% | 1.6% | 1.8% | 3.5% | 6.0% | 8.2% | ||
Iowa | 0.0% | 0.1% | 0.2% | 0.1% | 0.6% | 0.9% | 1.2% | 2.8% | 5.0% | 6.8% | ||
Kansas | 0.5% | 0.9% | 1.1% | 0.7% | 2.1% | 2.7% | 3.8% | 7.0% | 10.5% | 13.0% | ||
Kentucky | 0.0% | 0.0% | 0.0% | 0.0% | 0.3% | 0.7% | 0.6% | 1.5% | 3.1% | 4.6% | ||
Louisiana | 0.1% | 0.2% | 0.3% | 0.2% | 1.9% | 2.4% | 2.2% | 2.4% | 4.2% | 6.2% | ||
Maine | 0.0% | 0.0% | 0.0% | 0.0% | 0.4% | 0.4% | 0.6% | 0.7% | 1.3% | 2.0% | ||
Maryland | 0.0% | 0.0% | 0.0% | 0.0% | 1.4% | 1.5% | 2.6% | 4.3% | 8.2% | 11.8% | ||
Massachusetts | 0.0% | 0.0% | 0.0% | 0.1% | 1.1% | 2.5% | 4.8% | 6.8% | 9.6% | 12.6% | ||
Michigan | 0.0% | 0.0% | 0.3% | 0.2% | 1.4% | 1.8% | 2.2% | 3.3% | 4.4% | 5.6% | ||
Minnesota | 0.0% | 0.0% | 0.1% | 0.1% | 0.6% | 0.8% | 1.2% | 2.9% | 4.7% | 6.1% | ||
Mississippi | 0.0% | 0.0% | 0.1% | 0.0% | 0.4% | 1.0% | 0.6% | 1.4% | 2.7% | 3.6% | ||
Missouri | 0.0% | 0.1% | 0.1% | 0.1% | 0.9% | 1.1% | 1.2% | 2.1% | 3.5% | 4.9% | ||
Montana | 0.0% | 0.1% | 0.5% | 0.4% | 1.1% | 1.3% | 1.5% | 2.0% | 2.9% | 4.2% | ||
Nebraska | 0.0% | 0.2% | 0.5% | 0.4% | 1.4% | 1.8% | 2.3% | 5.5% | 9.2% | 12.0% | ||
Nevada | 1.1% | 1.8% | 3.7% | 2.8% | 5.6% | 6.7% | 10.4% | 19.7% | 26.5% | 28.7% | ||
New Hampshire | 0.0% | 0.0% | 0.0% | 0.0% | 0.4% | 0.6% | 1.0% | 1.7% | 2.8% | 4.3% | ||
New Jersey | 0.0% | 0.0% | 0.0% | 0.2% | 4.3% | 6.7% | 9.6% | 13.3% | 17.7% | 21.6% | ||
New Mexico | 6.9% | 9.8% | 15.2% | 41.7% | 36.5% | 28.3% | 37.4% | 36.6% | 38.2% | 42.1% | 46.3% | 47.7% |
New York | 0.0% | 0.0% | 0.0% | 1.0% | 8.0% | 9.5% | 12.3% | 15.1% | 17.6% | 19.5% | ||
North Carolina | 0.0% | 0.0% | 0.0% | 0.0% | 0.4% | 1.0% | 1.2% | 4.7% | 8.4% | 10.7% | ||
North Dakota | 0.0% | 0.0% | 0.1% | 0.0% | 0.3% | 0.6% | 0.7% | 1.2% | 2.0% | 4.3% | ||
Ohio | 0.0% | 0.0% | 0.1% | 0.1% | 0.9% | 1.1% | 1.3% | 1.9% | 3.1% | 4.4% | ||
Oklahoma | 0.3% | 0.4% | 0.2% | 0.2% | 1.4% | 1.9% | 2.7% | 5.2% | 8.9% | 11.9% | ||
Oregon | 0.0% | 0.1% | 0.2% | 0.1% | 1.7% | 2.5% | 4.0% | 8.0% | 11.7% | 13.9% | ||
Pennsylvania | 0.0% | 0.0% | 0.0% | 0.1% | 0.9% | 1.3% | 2.0% | 3.2% | 5.7% | 8.1% | ||
Puerto Rico | 98.8% | 99.0% | 98.9% | |||||||||
Rhode Island | 0.0% | 0.0% | 0.0% | 0.1% | 0.7% | 2.1% | 4.6% | 8.7% | 12.4% | 16.6% | ||
South Carolina | 0.0% | 0.0% | 0.0% | 0.0% | 0.4% | 1.1% | 0.9% | 2.4% | 5.1% | 6.9% | ||
South Dakota | 0.0% | 0.0% | 0.1% | 0.0% | 0.4% | 0.6% | 0.8% | 1.4% | 2.7% | 4.4% | ||
Tennessee | 0.0% | 0.0% | 0.0% | 0.0% | 0.4% | 0.7% | 0.7% | 2.2% | 4.6% | 6.9% | ||
Texas | 7.1% | 9.9% | 13.8% | 11.5% | 13.3% | 14.8% | 17.7% | 21.0% | 25.5% | 32.0% | 37.6% | 39.3% |
Utah | 0.0% | 0.3% | 0.8% | 0.5% | 4.1% | 4.1% | 4.9% | 9.0% | 13.0% | 15.1% | ||
Vermont | 0.0% | 0.0% | 0.0% | 0.2% | 0.6% | 0.6% | 0.7% | 0.9% | 1.5% | 2.4% | ||
Virginia | 0.0% | 0.0% | 0.0% | 0.0% | 1.0% | 1.5% | 2.6% | 4.7% | 7.9% | 10.5% | ||
Washington | 0.0% | 0.0% | 0.0% | 0.1% | 2.1% | 2.9% | 4.4% | 7.5% | 11.2% | 13.7% | ||
West Virginia | 0.0% | 0.0% | 0.0% | 0.1% | 0.4% | 0.7% | 0.5% | 0.7% | 1.2% | 1.9% | ||
Wisconsin | 0.0% | 0.0% | 0.1% | 0.1% | 0.9% | 1.3% | 1.9% | 3.6% | 5.9% | 7.6% | ||
Wyoming | 0.2% | 1.1% | 3.2% | 2.4% | 5.6% | 5.2% | 5.7% | 6.4% | 8.9% | 10.2% |
Cities and neighborhoods:
Post Oak Bend City is a town in Kaufman County, Texas, United States. Its population was 683 in 2020.
Josephine is a city in Collin and Hunt counties in the U.S. state of Texas. Its population was 812 at the 2010 census, with 755 residents in Collin County and 57 in Hunt County. By 2020, its population increased to 2,119.
Royse City is a city in Rockwall County in the U.S. state of Texas. It also extends into Collin and Hunt counties. The population was 2,957 at the 2000 census, rising to 9,349 in 2010. The estimated population in 2018 was 12,998. In 2020, its population grew to 13,508.
In the United States census, the U.S. Census Bureau and the Office of Management and Budget define a set of self-identified categories of race and ethnicity chosen by residents, with which they most closely identify. Residents can indicate their origins alongside their race, and are asked specifically whether they are of Hispanic or Latino origin in a separate question.
White Americans are Americans who identify as white people. This group constitutes the majority of the people in the United States. According to the 2020 census, 71%, or 235,411,507 people, were White alone or in combination, and 61.6%, or 204,277,273 people, were White alone. This represented a national white demographic decline from a 72.4% white alone share of the U.S. population in 2010.
The United States has a racially and ethnically diverse population. At the federal level, race and ethnicity have been categorized separately. The most recent United States census recognized five racial categories, as well as people who belong to two or more of the racial categories. The United States also recognizes the broader notion of ethnicity. The 2000 census and 2010 American Community Survey inquired about the "ancestry" of residents, while the 2020 census allowed people to enter their "origins". The Census Bureau also classified respondents as either Hispanic or Latino, identifying as an ethnicity, which comprises the minority group in the nation.
The demographics of the Bronx are characterized by a Hispanic majority and by the lowest percentage of Whites among all boroughs.
According to the U.S. Census Bureau, as of 2023, Texas was the second largest state in population after California, with a population of 30,503,301, an increase of more than 1.3 million people, or 4.7%, since the 29,145,505 of the 2020 census. Its apportioned population in 2020 was 29,183,290. Since the beginning of the 21st century, the state of Texas has experienced strong population growth. Texas has many major cities and metropolitan areas, along with many towns and rural areas. Much of the population is concentrated in the major cities of Dallas–Fort Worth, Austin, San Antonio, Houston, McAllen, and El Paso and their corresponding metropolitan areas. The first four aforementioned main urban centers are also referred to as the Texas Triangle megaregion.
According to the U.S. Census Bureau, as of 2023, New York was the fourth largest state in population after California, Texas, and Florida, with a population of 19,571,216, a decrease of over 600,000 people, or −3.1%, since the 2020 census. The population change between 2000–2006 includes a natural increase of 601,779 people and a decrease due to net migration of 422,481 people out of the state. Immigration from outside the United States resulted in a net increase of 820,388 people, and migration within the country produced a net loss of about 800,213.
White Hispanic and Latino Americans, also called Euro-Hispanics, Euro-Latinos, White Hispanics, or White Latinos, are Americans of white ancestry and ancestry from Latin America. It also refers to people of European ancestry from Latin America that speak Spanish natively and immigrated to the United States.
The demographics of Asian Americans describe a heterogeneous group of people in the United States who trace their ancestry to one or more Asian countries.
As of the 2020 United States census, Arizona had a population of 7,151,502.
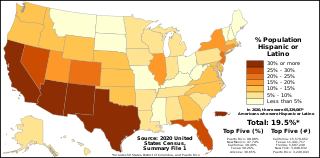
The demographics of Hispanic and Latino Americans depict a population that is the second-largest ethnic group in the United States, 62 million people or 18.7% of the national population.
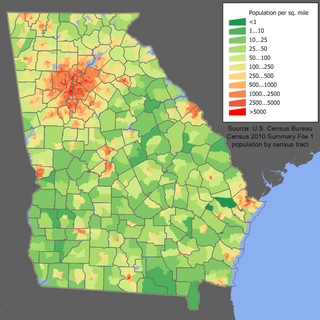
Georgia is a South Atlantic U.S. state with a population of 10,711,908 according to the 2020 United States census, or just over 3% of the U.S. population. The majority of the state's population is concentrated within Metro Atlanta, although other highly populated regions include: West Central and East Central Georgia; West, Central, and East Georgia; and Coastal Georgia; and their Athens, Columbus, Macon and Warner Robins, Augusta, Savannah, Hinesville, and Brunswick metropolitan statistical areas.
Utah is the 30th most populous state in the United States with a population of about 3.3 million, according to projections from the US Census Bureau's 2017 estimates. The state has also been characterized by a tremendous amount of growth in the last decade, with the highest percent increase in population of any state since 2010. Utah has a surface area of 84,899 square miles, though around 80% of its population is concentrated around a metropolitan area in the north-central part of the state known as the Wasatch Front.
Hispanic and Latino Arizonans are residents of the state of Arizona who are of Hispanic or Latino ancestry. As of the 2010 U.S. Census, Hispanics and Latinos of any race were 30% of the state's population.
Hispanic and Latino Nevadans are residents of the state of Nevada who are of Hispanic or Latino ancestry. As of the 2020 U.S. Census, Hispanics and Latinos of any race were 28.3% of the state's population.
The Commonwealth of Massachusetts is home to a large number of Hispanic and Latino residents. As of the 2020 Census, Hispanics and Latinos accounted for 12% of the total state's population