List of U.S. states by non-Hispanic white population

Last updated

Proportion of Americans who are Non-Hispanic White Alone in each U.S. state, the District of Columbia, and Puerto Rico as of the 2020 United States Census Non-Hispanic White Americans by state.svg
Proportion of Americans who are Non-Hispanic White Alone in each U.S. state, the District of Columbia, and Puerto Rico as of the 2020 United States Census

This is a list of U.S. states by Non-Hispanic whites population. The United States Census Bureau defines non-Hispanic white as white Americans who are not of Hispanic or Latino ancestry (i.e., having ancestry from Spain or Latin America). [1] At 191.6 million in 2020, non-Hispanic whites comprise 57.8% of the total U.S. population. [2] [3]

Contents

Population by state or territory

White alone non-Latino population by state or territory (1970–2020) [4] [5] [3] [6] [7] [8] [9]
State/Territory19902000201020202022Growth
Pop%Pop%Pop%Pop%Pop%%

growth 2020-2022

% growth
2010-2020
% pop
1980-2020
Flag of Alabama.svg Alabama 2,960,16773.3%3,125,81970.3%3,204,40267.0%3,171,35163.1%3,162,74862.6%-0.50%-1.0%-11.0%
Flag of Alaska.svg Alaska 406,72273.9%423,78867.6%455,32064.1%421,75857.5%417,65757.0%-0.50%-7.4%-22.2%
Flag of Arizona.svg Arizona 2,626,18571.7%3,274,25863.8%3,695,64757.8%3,816,54753.4%3,861,73252.1%-1.30%+3.3%-25.5%
Flag of Arkansas.svg Arkansas 1,933,08282.2%2,100,13578.6%2,173,46974.5%2,063,55068.5%2,077,32968.3%-0.20%-5.0%-16.7%
Flag of California.svg California 17,029,12657.2%15,816,79046.7%14,956,25340.1%13,714,58734.7%13,446,25334.5%-0.20%-8.3%-39.3%
Flag of Colorado.svg Colorado 2,658,94580.7%3,202,88074.5%3,520,79370.0%3,760,66365.1%3,792,63564.8%-0.30%+6.8%-19.3%
Flag of Connecticut.svg Connecticut 2,754,18483.8%2,638,84577.5%2,546,26271.2%2,279,23263.2%2,217,15461.4%-1.80%-10.5%-24.6%
Flag of Delaware.svg Delaware 528,09279.3%567,97372.5%586,75265.3%579,85158.6%572,46056.5%-2.10%-1.2%-26.1%
Flag of Washington, D.C.svg District of Columbia 166,13127.4%159,17827.8%209,46434.8%261,77138.0%268,43740.8%2.80%+25.0%+38.7%
Flag of Florida.svg Florida 9,475,32673.2%10,458,50965.4%10,884,72257.9%11,100,50351.5%11,167,13850.7%-0.80%+1.2%-29.6%
Flag of Georgia (U.S. state).svg Georgia 4,543,42570.1%5,128,66162.6%5,413,92055.9%5,362,15650.1%5,377,76249.6%-0.50%-1.0%-28.5%
Flag of Hawaii.svg Hawaii 347,64431.4%277,09122.9%309,34322.7%314,36521.6%319,83922.3%0.70%+1.6%-31.2%
Flag of Idaho.svg Idaho 928,66192.2%1,139,29188.0%1,316,24384.0%1,450,52378.9%1,495,55575.5%-3.40%+10.2%-11.4%
Flag of Illinois.svg Illinois 8,550,20874.8%8,424,14067.8%8,167,75363.7%7,472,75158.3%7,175,69157.3%-1.00%-8.5%-22.1%
Flag of Indiana.svg Indiana 4,965,24289.6%5,219,37385.8%5,286,45381.5%5,121,00475.5%5,139,70475.2%-0.30%-0.4%-15.7%
Flag of Iowa.svg Iowa 2,663,84095.9%2,710,34492.6%2,701,12388.7%2,638,20182.7%2,626,05882.1%-0.60%-6.8%-10.9%
Flag of Kansas.svg Kansas 2,190,52488.4%2,233,99783.1%2,230,53978.2%2,122,57572.2%2,105,14971.9%-0.30%-4.9%-18.3%
Flag of Kentucky.svg Kentucky 3,378,02291.7%3,608,01389.3%3,745,65586.3%3,664,76481.3%3,652,47680.8%-0.50%-2.2%-11.3%
Flag of Louisiana.svg Louisiana 2,776,02265.8%2,794,39162.5%2,734,88460.3%2,596,70255.8%2,556,23755.8%0.00%-5.1%-15.2%
Flag of Maine.svg Maine 1,203,35798.0%1,230,29796.5%1,254,29794.4%1,228,26490.2%1,228,57488.9%-1.30%-2.1%-8.0%
Flag of Maryland.svg Maryland 3,326,10969.6%3,286,54762.1%3,157,95854.7%2,913,78247.2%2,879,99446.8%-0.40%-7.7%-32.2%
Flag of Massachusetts.svg Massachusetts 5,280,29287.8%5,198,35981.9%4,984,80076.1%4,748,89767.6%4,702,00967.5%-0.10%-4.7%-23.0%
Flag of Michigan.svg Michigan 7,649,95182.3%7,806,69178.6%7,569,93976.6%7,295,65172.4%7,228,63172.0%-0.40%-3.6%-12%
Flag of Minnesota.svg Minnesota 4,101,26693.7%4,337,14388.2%4,405,14283.1%4,353,88076.3%4,327,51275.9%-0.40%-1.2%-15.3%
Flag of Mississippi.svg Mississippi 1,624,19863.1%1,727,90860.7%1,722,28758.0%1,639,07755.4%1,621,17855.1%-0.30%-4.8%-12.2%
Flag of Missouri.svg Missouri 4,448,46586.9%4,686,47483.8%4,850,74881.0%4,663,90775.8%4,671,32675.6%-0.20%-3.9%-12.8%
Flag of Montana.svg Montana 733,87891.8%807,82389.5%868,62887.8%901,31883.1%917,60181.5%-1.60%+3.8%-9.5%
Flag of Nebraska.svg Nebraska 1,460,09592.5%1,494,49487.3%1,499,75382.1%1,484,68775.7%1,475,15975.0%-0.70%-1.0%-28.2%
Flag of Nevada.svg Nevada 946,35778.7%1,303,00165.2%1,462,08154.1%1,425,95245.9%1,430,69644.7%-1.20%-3.5%-41.7%
Flag of New Hampshire.svg New Hampshire 1,079,48497.3%1,175,25295.1%1,215,05092.3%1,200,64987.2%1,202,67485.6%-1.60%-1.2%-10.4%
Flag of New Jersey.svg New Jersey 5,718,96674.0%5,557,20966.0%5,214,87859.3%4,816,38151.8%4,781,39351.7%-0.10%-7.6%-30%
Flag of New Mexico.svg New Mexico 764,16450.4%813,49544.7%833,81040.5%772,95236.5%761,95636.1%-0.40%-7.3%-26.6%
Flag of New York.svg New York 12,460,18969.3%11,760,98162.0%11,304,24758.3%10,598,90752.5%10,156,79852.3%-0.20%-6.4%-24.2%
Flag of North Carolina.svg North Carolina 4,971,12775.0%5,647,15570.2%6,223,99565.3%6,312,14860.5%6,338,05059.4%-1.10%+1.4%-19.3 pp
Flag of North Dakota.svg North Dakota 601,59294.2%589,14991.7%598,00788.9%636,16081.7%640,13383.1%1.40%+6.4%-13.1%
Flag of Ohio.svg Ohio 9,444,62287.1%9,538,11184.0%9,359,26381.1%8,954,13575.9%8,911,35675.7%-0.20%-4.3%-12.9%
Flag of Oklahoma.svg Oklahoma 2,547,58881.0%2,556,36874.1%2,575,38168.7%2,407,18860.8%2,409,19959.9%-0.90%-6.5%-25%
Flag of Oregon.svg Oregon 2,579,73290.8%2,857,61683.5%3,005,84878.5%3,036,15871.7%3,045,55471.5%-0.20%+1.0%-21.0%
Flag of Pennsylvania.svg Pennsylvania 10,422,05887.7%10,322,45584.1%10,094,65279.5%9,553,41773.5%9,489,50773.5%0.00%-5.4%-16.2%
Flag of Rhode Island.svg Rhode Island 896,10989.3%858,43381.9%803,68576.4%754,05068.7%739,10667.5%-1.20%-6.2%-23.1%
Flag of South Carolina.svg South Carolina 2,390,05668.5%2,652,29166.1%2,962,74064.1%3,178,55262.1%3,201,89360.9%-1.20%+7.3%-9.3%
Flag of South Dakota.svg South Dakota 634,78891.2%664,58588.0%689,50284.7%705,58379.6%715,01179.0%-0.60%+2.3%-12.7%
Flag of Tennessee.svg Tennessee 4,027,63182.6%4,505,93079.2%4,800,78275.6%4,900,24670.9%4,943,25970.0%-0.90%+2.1%-14.2%
Flag of Texas.svg Texas 10,291,68060.6%10,933,31352.4%11,397,34545.3%11,584,59739.7%11,701,51239.1%-0.60%+1.6%-34.5%
Flag of Utah.svg Utah 1,571,25491.2%1,904,26585.3%2,221,71980.4%2,465,35575.4%2,490,13372.7%-2.70%+11.0%-17.3%
Flag of Vermont.svg Vermont 552,18498.1%585,43196.2%590,22394.3%573,20189.1%570,99188.2%-0.90%-2.9%-9.2%
Flag of Virginia.svg Virginia 4,701,65076.0%4,965,63770.2%5,186,45064.8%5,058,36358.6%5,064,24058.5%-0.10%-2.5%-29.9%
Flag of Washington.svg Washington 4,221,62286.7%4,652,49078.9%4,876,80472.5%4,918,82063.8%4,923,71263.4%-0.40%+0.9%-26.4%
Flag of West Virginia.svg West Virginia 1,718,89695.8%1,709,96694.6%1,726,25693.2%1,598,83489.1%1,575,23188.8%-0.30%-7.4%-7.0%
Flag of Wisconsin.svg Wisconsin 4,464,67791.3%4,681,63087.3%4,738,41183.3%4,634,01878.6%4,631,61778.4%-0.20%-2.2%-13.9%
Flag of Wyoming.svg Wyoming 412,71191.0%438,79988.9%483,87485.9%469,66481.4%470,04080.8%-0.60%-2.9%-10.5%
Flag of American Samoa.svg American Samoa 6821.2%6111.1%
Flag of Guam.svg Guam 10,6666.9%11,0016.9%
Flag of the Northern Mariana Islands.svg Northern Mariana Islands 1,2741.8%9161.7%
Flag of Puerto Rico.svg Puerto Rico 33,9660.9%26,9460.7%24,5480.8%-8.9%
Flag of the United States Virgin Islands.svg U.S. Virgin Islands 8,5807.9%3,8303.6%
Flag of the United States.svg United States of America188,128,29675.6%194,552,77469.1%196,817,55263.7%191,697,64757.8%190,678,05957.6%-0.20%-2.6%–23.5%

In 2020, in 36 out of the 50 US states, non-Latino whites made up a greater percentage of the state's population than the US overall share of 57.8%; however, the 14 states with greater shares of non-whites include the four most populous states (California, Texas, New York, and Florida). The total non-Latino white population shrunk between 2010 and 2020 in 34 out of the 50 states, and the relative share of non-Latino whites in the overall state population has declined in all 50 states during that same time period.

As of 2020, six states are majority-minority: Hawaii, California, New Mexico, Texas, Nevada, and Maryland. All of these states saw larger declines in the relative share of their non-Latino white populations between 1990-2020 than the national average of -23.5% with Nevada dropping by -41.7%, California by -39.3% and Texas by -34.5%.

Historical population by state or territory

.mw-parser-output .legend{page-break-inside:avoid;break-inside:avoid-column}.mw-parser-output .legend-color{display:inline-block;min-width:1.25em;height:1.25em;line-height:1.25;margin:1px 0;text-align:center;border:1px solid black;background-color:transparent;color:black}.mw-parser-output .legend-text{}
Currently are majority minority states
Non-Hispanic whites are less than 60% of the population
Were formerly majority minority states
Green states were formerly majority minority, however by the 1930s, largely due to the Great Migration of African-Americans out of the rural Southern United States to the urban Northeast, had gained a white majority. USMajorityMinorityStates.png
  Currently are majority minority states
  Non-Hispanic whites are less than 60% of the population
  Were formerly majority minority states
Green states were formerly majority minority, however by the 1930s, largely due to the Great Migration of African-Americans out of the rural Southern United States to the urban Northeast, had gained a white majority.
Non-Mexican white (1910-1930) and non-Hispanic white % of population (1940-2010) by U.S. State [10] [11] [12] [13]
State/Territory1900191019201930194019501960197019801990200020102020
Flag of Alabama.svg Alabama 54.7%57.5%61.6%64.3%65.3%67.9%69.9%73.3%73.3%73.3%70.3%67.0%65.1%
Flag of Alaska.svg Alaska 48.3%77.2%77.2%75.8%73.9%67.6%64.1%59.6%
Flag of Arizona.svg Arizona 65.1%74.3%74.5%71.7%63.8%57.8%53.8%
Flag of Arkansas.svg Arkansas 75.2%81.0%82.2%82.2%78.6%74.5%71.7%
Flag of California.svg California 89.5%76.3%66.6%57.2%46.7%40.1%35.9%
Flag of Colorado.svg Colorado 90.3%84.6%82.7%80.7%74.5%70.0%67.4%
Flag of Connecticut.svg Connecticut 97.9%91.4%88.0%83.8%77.5%71.2%65.3%
Flag of Delaware.svg Delaware 86.4%84.1%81.3%79.3%72.5%65.3%61.1%
Flag of Washington, D.C.svg District of Columbia 71.4%26.5%25.7%27.4%27.8%34.8%37.7%
Flag of Florida.svg Florida 71.5%77.9%76.7%73.2%65.4%57.9%53.1%
Flag of Georgia (U.S. state).svg Georgia 65.2%73.4%71.6%70.1%62.6%55.9%51.6%
Flag of Hawaii.svg Hawaii 31.5%38.0%31.1%31.4%22.9%22.7%21.4%
Flag of Idaho.svg Idaho 98.4%95.9%93.9%92.2%88.0%84.0%81.4%
Flag of Illinois.svg Illinois 94.7%83.5%78.0%74.8%67.8%63.7%60.4%
Flag of Indiana.svg Indiana 96.3%91.7%90.2%89.6%85.8%81.5%78.0%
Flag of Iowa.svg Iowa 99.2%98.0%96.9%95.9%92.6%88.7%84.5%
Flag of Kansas.svg Kansas 95.6%92.7%90.5%88.4%83.1%78.2%75.1%
Flag of Kentucky.svg Kentucky 92.5%92.4%91.7%91.7%89.3%86.3%83.9%
Flag of Louisiana.svg Louisiana 63.7%68.2%67.6%65.8%62.5%60.3%58.1%
Flag of Maine.svg Maine 99.7%99.1%98.3%98.0%96.5%94.4%92.7%
Flag of Maryland.svg Maryland 83.3%80.4%73.9%69.6%62.1%54.7%49.5%
Flag of Massachusetts.svg Massachusetts 98.6%95.4%92.3%87.8%81.9%76.1%70.5%
Flag of Michigan.svg Michigan 95.7%87.1%84.1%82.3%78.6%76.6%74.5%
Flag of Minnesota.svg Minnesota 99.0%97.7%96.1%93.7%88.2%83.1%78.6%
Flag of Mississippi.svg Mississippi 50.6%62.6%63.6%63.1%60.7%58.0%56.3%
Flag of Missouri.svg Missouri 93.4%88.6%87.7%86.9%83.8%81.0%79.0%
Flag of Montana.svg Montana 96.2%94.7%93.4%91.8%89.5%87.8%85.7%
Flag of Nebraska.svg Nebraska 98.2%95.2%94.0%92.5%87.3%82.1%77.8%
Flag of Nevada.svg Nevada 91.6%86.7%83.2%78.7%65.2%54.1%47.4%
Flag of New Hampshire.svg New Hampshire 99.9%99.1%98.4%97.3%95.1%92.3%89.4%
Flag of New Jersey.svg New Jersey 94.3%84.7%79.1%74.0%66.0%59.3%54.1%
Flag of New Mexico.svg New Mexico 50.9%53.8%52.6%50.4%44.7%40.5%36.4%
Flag of New York.svg New York 94.6%80.1%75.0%69.3%62.0%58.3%55.0%
Flag of North Carolina.svg North Carolina 71.9%76.5%75.3%75.0%70.2%65.3%62.3%
Flag of North Dakota.svg North Dakota 98.3%96.9%95.5%94.2%91.7%88.9%83.3%
Flag of Ohio.svg Ohio 95.0%89.8%88.2%87.1%84.0%81.1%78.0%
Flag of Oklahoma.svg Oklahoma 89.9%88.1%85.0%81.0%74.1%68.7%64.4%
Flag of Oregon.svg Oregon 98.6%95.8%93.3%90.8%83.5%78.5%
Flag of Pennsylvania.svg Pennsylvania 95.1%90.3%89.1%87.7%84.1%79.5%
Flag of Rhode Island.svg Rhode Island 98.3%96.1%93.4%89.3%81.9%76.4%
Flag of South Carolina.svg South Carolina 57.1%69.0%68.3%68.5%66.1%64.1%
Flag of South Dakota.svg South Dakota 96.2%94.6%92.3%91.2%88.0%84.7%
Flag of Tennessee.svg Tennessee 82.5%83.7%83.1%82.6%79.2%75.6%
Flag of Texas.svg Texas 74.1%69.6%65.7%60.6%52.4%45.3%
Flag of Utah.svg Utah 98.2%93.6%92.4%91.2%85.3%80.4%
Flag of Vermont.svg Vermont 99.7%99.2%98.5%98.1%96.2%94.3%92.2%
Flag of Virginia.svg Virginia 75.3%80.1%78.2%76.0%70.2%64.8%
Flag of Washington.svg Washington 97.7%93.6%90.2%86.7%78.9%72.5%
Flag of West Virginia.svg West Virginia 93.7%95.7%95.6%95.8%94.6%93.2%
Flag of Wisconsin.svg Wisconsin 99.2%95.6%93.6%91.3%87.3%83.3%
Flag of Wyoming.svg Wyoming 95.9%92.1%92.0%91.0%88.9%85.9%
Flag of Puerto Rico.svg Puerto Rico 0.9%0.7%
Flag of the United States.svg United States of America88.4%83.5%79.6%75.6%69.1%63.7%

See also

Related Research Articles

<span class="mw-page-title-main">Demographics of the United States</span>

The United States had an official estimated resident population of 334,914,895 on July 1, 2023, according to the U.S. Census Bureau. This figure includes the 50 states and the Washington, D.C. but excludes the population of five unincorporated U.S. territories as well as several minor island possessions. The United States is the third most populous country in the world, and the most populous in the Americas and the Western Hemisphere. The Census Bureau showed a population increase of 0.4% for the twelve-month period ending in July 2022, below the world average annual rate of 0.9%. The total fertility rate in the United States estimated for 2022 is 1.665 children per woman, which is below the replacement fertility rate of approximately 2.1. By several metrics, including racial and ethnic background, religious affiliation, and percentage of rural and urban divide, Illinois is the most representative of the larger demography of the United States.

<span class="mw-page-title-main">Cloverleaf, Texas</span> Census-designated place in Texas, United States

Cloverleaf is a census-designated place (CDP) in east central Harris County, Texas, United States. The population was 24,100 at the 2020 census.

<span class="mw-page-title-main">Mexican Americans</span> Americans of Mexican ancestry

Mexican Americans are Americans of Mexican heritage. In 2022, Mexican Americans comprised 11.2% of the US population and 58.9% of all Hispanic and Latino Americans. In 2019, 71% of Mexican Americans were born in the United States; they make up 53% of the total population of foreign-born Hispanic Americans and 25% of the total foreign-born population. Chicano is a term used by some to describe the unique identity held by Mexican-Americans. The United States is home to the second-largest Mexican community in the world, behind only Mexico. Most Mexican Americans reside in the Southwest, with over 60% of Mexican Americans living in the states of California and Texas.

In the United States census, the U.S. Census Bureau and the Office of Management and Budget define a set of self-identified categories of race and ethnicity chosen by residents, with which they most closely identify. Residents can indicate their origins alongside their race, and are asked specifically whether they are of Hispanic or Latino origin in a separate question.

<span class="mw-page-title-main">Majority minority in the United States</span> Places with less than 50% non-Hispanic white population

In the United States of America, majority-minority area or minority-majority area is a term describing a U.S. state or jurisdiction whose population is composed of less than 50% non-Hispanic whites. Racial data is derived from self-identification questions on the U.S. census and on U.S. Census Bureau estimates.. The term is often used in voting rights law to designate voting districts that are designed under the Voting Rights Act to enable ethnic or language minorities "the opportunity to elect their candidate of choice." In that context, the term was first used by the Supreme Court in 1977. The Court had previously used the term in employment discrimination and labor relations cases.

The 2010 census estimated Alabama's population at 4,802,740, an increase of 332,636 or 7.5% since 2000. This includes a natural increase of 87,818 and a net migration of 73,178 people into the state. Immigration from outside the United States resulted in a net increase of 30,537 and migration within the country produced a net increase of 42,641.

<span class="mw-page-title-main">White Americans</span> White people of the United States

White Americans are Americans who identify as white people. This group constitutes the majority of the people in the United States. According to the 2020 census, 71%, or 235,411,507 people, were White alone or in combination, and 61.6%, or 204,277,273 people, were White alone. This represented a national white demographic decline from a 72.4% white alone share of the U.S. population in 2010.

<span class="mw-page-title-main">Race and ethnicity in the United States</span>

The United States has a racially and ethnically diverse population. At the federal level, race and ethnicity have been categorized separately. The most recent United States census recognized five racial categories, as well as people who belong to two or more of the racial categories. The United States also recognizes the broader notion of ethnicity. The 2000 census and 2010 American Community Survey inquired about the "ancestry" of residents, while the 2020 census allowed people to enter their "origins". The Census Bureau also classified respondents as either Hispanic or Latino, identifying as an ethnicity, which comprises the minority group in the nation.

According to the U.S. Census Bureau, as of 2023, Texas was the second largest state in population after California, with a population of 30,503,301, an increase of more than 1.3 million people, or 4.7%, since the 29,145,505 of the 2020 census. Its apportioned population in 2020 was 29,183,290. Since the beginning of the 21st century, the state of Texas has experienced strong population growth. Texas has many major cities and metropolitan areas, along with many towns and rural areas. Much of the population is concentrated in the major cities of Dallas–Fort Worth, Austin, San Antonio, Houston, McAllen, and El Paso and their corresponding metropolitan areas. The first four aforementioned main urban centers are also referred to as the Texas Triangle megaregion.

White Hispanic and Latino Americans, also called Euro-Hispanics, Euro-Latinos, White Hispanics, or White Latinos, are Americans of white ancestry and ancestry from Latin America. It also refers to people of European ancestry from Latin America that speak Spanish natively and immigrated to the United States.

<span class="mw-page-title-main">Demographics of Arizona</span>

As of the 2020 United States census, Arizona had a population of 7,151,502.

Tennessee is the fifteenth most populous state in the United States with a population of 7,051,339 as of 2022, and has the twentieth-highest population density. The 2020 United States census reported its population to be 6,916,897.

<span class="mw-page-title-main">Demographics of Hispanic and Latino Americans</span>

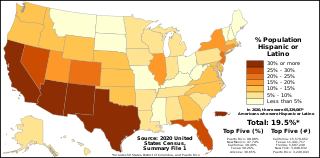
The demographics of Hispanic and Latino Americans depict a population that is the second-largest ethnic group in the United States, 62 million people or 18.7% of the national population.

<span class="mw-page-title-main">Demographics of Georgia (U.S. state)</span>

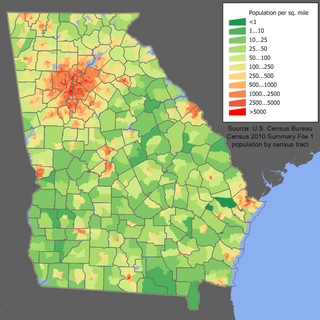
Georgia is a South Atlantic U.S. state with a population of 10,711,908 according to the 2020 United States census, or just over 3% of the U.S. population. The majority of the state's population is concentrated within Metro Atlanta, although other highly populated regions include: West Central and East Central Georgia; West, Central, and East Georgia; and Coastal Georgia; and their Athens, Columbus, Macon and Warner Robins, Augusta, Savannah, Hinesville, and Brunswick metropolitan statistical areas.

<span class="mw-page-title-main">Non-Hispanic whites</span> White Americans who are not Hispanic

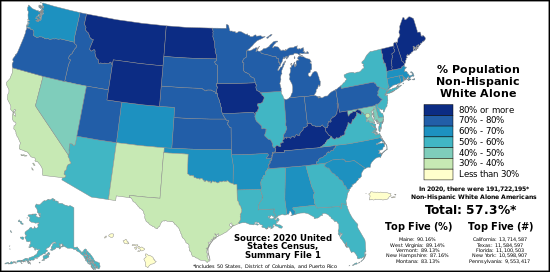
Non-Hispanic Whites, Non-Latino Whites, or more simply White Americans, are Americans classified by the United States census as "white" and not Hispanic. According to the United States Census Bureau yearly estimates, as of July 1, 2022, Non-Hispanic whites make up about 59.3% of the U.S. population, or 197,639,521 people. The United States Census Bureau defines white to include European Americans, Middle Eastern Americans, and North African Americans. Americans of European ancestry are divided into various ethnic groups. More than half of the white population are German, Irish, English, French and Polish Americans. Many Americans are also the product of other European groups that migrated to parts of the US in the 19th and 20th centuries, as the bulk of immigrants from various countries in Northern, Central, Eastern, and Southeastern Europe, as well as the Caucasus region, migrated to the United States.

The racial and ethnic demographics of the United States have changed dramatically throughout its history.

<span class="mw-page-title-main">Hispanics and Latinos in California</span> Ethnic group in the U.S. state of California

Hispanic and Latino Californians are residents of the state of California who are of Hispanic or Latino ancestry. As of the 2020 U.S. Census, Hispanics and Latinos of any race were 39.4% of the state's population, making it the largest ethnicity in California.

Hispanic and Latino Nevadans are residents of the state of Nevada who are of Hispanic or Latino ancestry. As of the 2020 U.S. Census, Hispanics and Latinos of any race were 28.3% of the state's population.

<span class="mw-page-title-main">Demographics of San Francisco</span>

The 2020 United States Census reported that San Francisco had a population of 873,965—an increase from the 2010 Census count of 805,235. The 2022 Census Bureau American Community Survey put the population at 808,437: a decrease of 65,528 from 2020. With a population density of 18,633 per square mile (7,194/km2), San Francisco is the second-most densely populated major American city, behind only New York.

References

  1. U.S. Census Bureau definition of race Archived January 4, 2011, at the Wayback Machine
  2. Tavernise, Sabrina (17 May 2012). "Whites Account for Under Half of Births in U.S." The New York Times.
  3. 1 2 "2012 American Community Survey 1-Year Estimates". American FactFinder, U.S. Census Bureau. Archived from the original on 12 February 2020. Retrieved 23 March 2014.
  4. 1980: Census of Population (PDF). Bureau of the Census. August 1982.
  5. "Historical Census Statistics on Population Totals By Race, 1790 to 1990, and By Hispanic Origin, 1970 to 1990, For The United States, Regions, Divisions, and States". 2008-07-25. Archived from the original on 2008-07-25. Retrieved 2022-06-30.
  6. "2010 Census". Census.gov. Retrieved 2017-08-19.
  7. "Data". data.census.gov. Retrieved 2020-04-29.
  8. "2020 Census Demographic Data Map Viewer". US Census Bureau. Retrieved 24 September 2021.
  9. "Race and Ethnicity in the United States: 2010 Census and 2020 Census". US Census Bureau. Retrieved 24 September 2021.
  10. "Historical Census Statistics on Population Totals By Race, 1790 to 1990, and By Hispanic Origin, 1970 to 1990, For The United States, Regions, Divisions, and States". Census.gov. Archived from the original on July 25, 2008. Retrieved September 15, 2012.
  11. https://www.census.gov/prod/2001pubs/mso01-wp.pdf [ bare URL PDF ]
  12. https://www.census.gov/prod/cen2010/briefs/c2010br-05.pdf [ bare URL PDF ]
  13. "Alabama population by year, county, race, & more". September 2022.