Federal tax revenue by state

Last updated

This is a table of the total federal tax revenue by state, federal district, and territory collected by the U.S. Internal Revenue Service.

Contents

Gross Collections indicates the total federal tax revenue collected by the IRS from each U.S. state, the District of Columbia, and Puerto Rico. The figure includes all Individual federal taxes and Corporate Federal Taxes, income taxes, payroll taxes, estate taxes, gift taxes, and excise taxes. This table does not include federal tax revenue data from U.S. Armed Forces personnel stationed overseas, U.S. territories other than Puerto Rico, and U.S. citizens and legal residents living abroad, even though they may be required to pay federal taxes.

Fiscal Year 2019

This table lists the tax revenue collected from each state, plus the District of Columbia and the territory of Puerto Rico by the IRS in fiscal year 2019, which ran from October 1, 2018, through September 30, 2019. The gross collections total only reflects the revenue collected from the categories listed in the table, and not the entire revenue collected by the IRS. [1]

State
federal district
or territory
Gross collections [1]

(thousands of dollars)

Alabama 26,511,031
Alaska 5,395,473
Arizona 47,743,166
Arkansas 30,572,215
California 472,027,235
Colorado 59,961,429
Connecticut 57,092,781
Delaware 20,073,979
District of Columbia 27,529,823
Florida 210,024,433
Georgia 94,305,868
Hawaii 9,246,293
Idaho 11,343,181
Illinois 162,274,617
Indiana 60,627,045
Iowa 24,914,602
Kansas 26,337,911
Kentucky 35,595,050
Louisiana 39,430,322
Maine 8,130,883
Maryland 78,473,276
Massachusetts 120,035,203
Michigan 81,583,480
Minnesota 102,642,589
Mississippi 11,273,202
Missouri 64,149,074
Montana 6,356,727
Nebraska 25,551,082
Nevada 23,769,524
New Hampshire 12,208,656
New Jersey 140,258,435
New Mexico 9,270,398
New York 304,992,953
North Carolina 87,778,099
North Dakota 6,639,943
Ohio 144,704,811
Oklahoma 29,133,375
Oregon 35,041,125
Pennsylvania 141,973,579
Rhode Island 14,325,645
South Carolina 27,885,047
South Dakota 8,029,363
Tennessee 69,769,299
Texas 292,330,171
Utah 24,335,082
Vermont 4,505,097
Virginia 83,574,427
Washington 100,609,767
West Virginia 7,039,939
Wisconsin 52,872,510
Wyoming 4,743,997
Puerto Rico 3,528,739
U.S. Armed Service members overseas

and Territories other than Puerto Rico

770,480
International12,611,648
TOTAL3,561,904,049

No data for Guam is available for 2019. [1]

Fiscal Year 2018

This table lists the tax revenue collected from each state, plus the District of Columbia and the territory of Puerto Rico by the IRS in fiscal year 2018, which ran from October 1, 2017, through September 30, 2018. The gross collections total only reflects the revenue collected from the categories listed in the table, and not the entire revenue collected by the IRS. [1]

State
federal district
or territory
Gross collections [1]

($)

California 456,555,954,000
New York 281,220,376,000
Texas 280,048,364,000
Florida 205,694,126,000
Illinois 161,189,282,000
New Jersey 138,976,784,000
Ohio 140,891,209,000
Pennsylvania 136,268,950,000
Massachusetts 117,998,443,000
Minnesota 99,354,057,000
Georgia 92,804,948,000
Virginia 84,844,999,000
North Carolina 82,539,491,000
Michigan 83,256,186,000
Washington 90,404,108,000
Missouri 63,139,167,000
Maryland 72,561,209,000
Tennessee 68,888,235,000
Connecticut 53,729,155,000
Indiana 58,698,927,000
Wisconsin 51,992,826,000
Colorado 58,707,795,000
Arizona 46,226,885,000
Louisiana 41,982,123,000
Oklahoma 27,908,169,000
Kentucky 34,754,947,000
Arkansas 32,029,540,000
Oregon 33,802,142,000
Kansas 25,813,743,000
District of Columbia 28,443,717,000
Nebraska 25,312,311,000
Alabama 26,724,809,000
South Carolina 28,552,567,000
Iowa 25,111,982,000
Delaware 19,038,671,000
Utah 23,401,402,000
Nevada 23,317,912,000
Rhode Island 14,725,607,000
Mississippi 11,460,401,000
New Hampshire 12,291,272,000
Idaho 10,858,404,000
New Mexico 9,002,297,000
Hawaii 9,591,724,000
South Dakota 8,200,403,000
North Dakota 6,578,855,000
Maine 7,925,462,000
West Virginia 6,911,139,000
Montana 6,229,347,000
Alaska 5,287,377,000
Wyoming 4,930,650,000
Vermont 4,417,527,000
Puerto Rico 3,443,334,000
TOTAL3,444,039,309,000

No data for Guam is available for 2018. [1]

Fiscal Year 2017

This table lists the tax revenue collected from each state, plus the District of Columbia and the territory of Puerto Rico by the IRS in fiscal year 2018, which ran from October 1, 2016, through September 30, 2017. The gross collections total only reflects the revenue collected from the categories listed in the table, and not the entire revenue collected by the IRS. [1]

State
federal district
or territory
Gross collections [1]

($)

California 440,475,243,000
Texas 270,955,237,000
New York 268,353,669,000
Florida 192,869,033,000
Illinois 162,326,463,000
New Jersey 143,835,479,000
Ohio 142,086,312,000
Pennsylvania 139,797,047,000
Massachusetts 112,996,320,000
Minnesota 104,429,577,000
Georgia 94,277,375,000
Virginia 87,183,756,000
North Carolina 82,855,993,000
Michigan 82,676,161,000
Washington 85,875,647,000
Missouri 71,921,135,000
Maryland 71,246,920,000
Tennessee 69,069,233,000
Connecticut 57,540,270,000
Indiana 58,940,989,000
Wisconsin 53,089,052,000
Colorado 56,742,235,000
Arizona 43,928,177,000
Louisiana 42,724,672,000
Oklahoma 27,113,120,000
Kentucky 35,126,897,000
Arkansas 32,458,328,000
Oregon 32,345,824,000
Kansas 25,563,140,000
District of Columbia 28,302,953,000
Nebraska 25,450,002,000
Alabama 26,583,916,000
South Carolina 26,636,069,000
Iowa 24,642,287,000
Delaware 17,081,357,000
Utah 22,485,663,000
Nevada 21,570,670,000
Rhode Island 14,917,462,000
Mississippi 11,740,655,000
New Hampshire 12,138,352,000
Idaho 10,386,020,000
New Mexico 8,979,166,000
Hawaii 9,415,214,000
South Dakota 7,872,916,000
North Dakota 6,640,269,000
Maine 8,083,275,000
West Virginia 6,980,482,000
Montana 6,080,381,000
Alaska 5,399,946,000
Wyoming 4,393,700,000
Vermont 4,422,942,000
Puerto Rico 3,393,432,000
TOTAL3,402,400,432,000

No data for Guam is available for 2017. [1]

Fiscal Year 2015

This table lists the tax revenue collected from each state, plus the District of Columbia and the territory of Puerto Rico by the IRS in fiscal year 2015, which ran from October 1, 2014, through September 30, 2015. The gross collections total only reflects the revenue collected from the categories listed in the table, and not the entire revenue collected by the IRS. Per capita values are based on population estimates from the Census Bureau for July 1, 2015. [2]

RankState
federal district
or territory
Gross collections [3] Revenue per capita (est.)Ratio to GSP
1 California $405,851,295,000$10,40816.6%
2 Texas $279,904,425,000$10,20417.1%
3 New York $269,716,999,000$13,65918.5%
4 Florida $177,389,488,000$8,76219.9%
5 Illinois $158,042,273,000$12,31020.5%
6 New Jersey $153,917,572,000$17,22626.6%
7 Ohio $140,981,150,000$12,14823.5%
8 Pennsylvania $136,108,810,000$10,64019.9%
9 Massachusetts $108,049,205,000$15,92722.6%
10 Minnesota $106,927,808,000$19,50431.9%
11 Georgia $86,446,602,000$8,47617.2%
12 Virginia $80,242,853,000$9,59016.7%
13 North Carolina $78,736,401,000$7,84615.4%
14 Michigan $77,948,414,000$7,86016.7%
15 Washington $73,334,437,000$10,24216.3%
16 Missouri $64,112,504,000$10,55122.1%
17 Maryland $63,936,798,000$10,66517.5%
18 Tennessee $62,708,662,000$9,50820.2%
19 Connecticut $59,174,581,000$16,50722.6%
20 Indiana $57,972,825,000$8,76717.5%
21 Wisconsin $51,748,831,000$8,97217.2%
22 Colorado $47,210,720,000$8,66414.8%
23 Arizona $42,631,316,000$6,25314.3%
24 Louisiana $42,628,150,000$9,13016.8%
25 Oklahoma $33,942,286,000$8,68718.9%
26 Kentucky $32,708,391,000$7,39216.8%
27 Arkansas $32,508,761,000$10,91726.3%
28 Oregon $31,219,148,000$7,75713.7%
29 Kansas $27,019,291,000$9,29518.1%
30 District of Columbia $25,583,750,000$38,16320.8%
31 Nebraska $25,103,770,000$13,25622.4%
32 Alabama $25,070,261,000$5,16512.0%
33 South Carolina $24,086,257,000$4,92112.1%
34 Iowa $23,969,391,000$7,67814.0%
35 Delaware $22,640,853,000$23,98234.2%
36 Utah $20,178,718,000$6,74713.6%
37 Nevada $18,450,072,000$6,39813.1%
38 Rhode Island $14,373,318,000$13,61625.5%
39 Mississippi $11,468,660,000$3,83610.7%
40 New Hampshire $11,314,985,000$8,50715.8%
41 Idaho $9,785,027,000$5,92015.0%
42 New Mexico $8,969,666,000$4,3129.9%
43 Hawaii $8,221,290,000$5,76910.3%
44 South Dakota $7,732,138,000$9,01317.0%
45 North Dakota $7,711,243,000$10,18914.4%
46 Maine $7,464,280,000$5,61513.5%
47 West Virginia $7,374,299,000$4,00510.4%
48 Montana $5,805,098,000$5,62512.7%
49 Alaska $5,717,640,000$7,75110.5%
50 Wyoming $5,284,146,000$9,00913.2%
51 Vermont $4,495,280,000$7,18015.1%
Puerto Rico [lower-alpha 1] $3,524,557,000$1,015N/A
TOTAL [lower-alpha 2] $3,283,920,138,000$10,23418.3%

GSP is the Gross State Product

Fiscal Year 2012

This table lists the tax revenue collected from each state, plus the District of Columbia and the territory of Puerto Rico by the IRS in fiscal year 2012, which ran from October 1, 2011, through September 30, 2012. The gross collections total only reflects the revenue collected from the categories listed in the table, and not the entire revenue collected by the IRS. Per capita values are based on population estimates from the Census Bureau for July 1, 2012. [4]

RankState
federal district
or territory
Gross collections [5] Revenue per capita (est.)Ratio to GSP [6]
1 California $292,563,574,000$7,690.6614.6%
2 Texas $219,459,878,000$8,421.5915.7%
3 New York $201,167,954,000$10,279.2716.7%
4 Illinois $124,431,227,000$9,664.3717.9%
5 Florida $122,249,635,000$6,328.4215.7%
6 New Jersey $111,377,490,000$12,564.3121.9%
7 Ohio $111,094,276,000$9,623.3621.8%
8 Pennsylvania $108,961,515,000$8,536.9418.1%
9 Massachusetts $79,826,976,000$12,011.0219.8%
10 Minnesota $78,685,402,000$14,627.8826.7%
11 Georgia $65,498,308,000$6,602.6915.1%
12 Virginia $64,297,400,000$7,854.6814.4%
13 North Carolina $61,600,064,000$6,316.6113.5%
14 Michigan $59,210,158,000$5,990.8914.8%
15 Washington $52,443,862,000$7,603.8514.0%
16 Indiana $51,238,512,000$7,837.8317.2%
17 Missouri $48,413,247,000$8,039.4118.7%
18 Maryland $48,107,002,000$8,175.1215.1%
19 Connecticut $47,262,702,000$13,163.8320.6%
20 Tennessee $47,010,303,000$7,281.3717.0%
21 Wisconsin $41,498,033,000$7,246.8015.9%
22 Colorado $41,252,701,000$7,952.2015.1%
23 Arizona $34,850,436,000$5,318.0313.1%
24 Louisiana $34,811,072,000$7,564.5114.3%
25 Oklahoma $27,087,264,000$7,100.5416.8%
26 Arkansas $25,299,832,000$8,578.7423.1%
27 Kentucky $25,085,813,000$5,726.8114.5%
28 Oregon $22,716,602,000$5,825.7411.4%
29 Kansas $21,904,615,000$7,590.2115.8%
30 Delaware $21,835,412,000$23,809.4033.1%
31 Alabama $20,882,949,000$4,330.7411.4%
District of Columbia [lower-alpha 3] $20,747,652,000$32,811.7918.9%
32 Nebraska $19,795,254,000$10,668.2819.9%
33 Iowa $18,753,596,000$6,100.3512.3%
34 South Carolina $18,557,166,000$3,928.5010.5%
35 Utah $15,642,129,000$5,478.3012.0%
36 Nevada $13,727,425,000$4,975.6310.3%
37 Rhode Island $10,992,338,000$10,465.9821.6%
38 Mississippi $10,458,549,000$3,503.7910.3%
39 New Hampshire $8,807,691,000$6,668.8713.6%
40 New Mexico $7,866,206,000$3,771.799.8%
41 Idaho $7,622,490,000$4,776.8113.1%
42 Hawaii $6,511,578,000$4,676.819.0%
43 West Virginia $6,498,502,000$3,502.469.4%
44 Maine $6,229,189,000$4,686.4511.6%
45 North Dakota $5,664,860,000$8,096.9612.3%
46 South Dakota $5,136,249,000$6,163.3512.1%
47 Alaska $4,898,780,000$6,697.369.4%
48 Montana $4,383,727,000$4,361.3110.8%
49 Wyoming $3,828,379,000$6,641.7410.0%
50 Vermont $3,524,887,000$5,630.7112.9%
Puerto Rico [lower-alpha 1] $3,067,234,000$836.42N/A
TOTAL [lower-alpha 2] $2,514,838,095,0007,918.73 (US Avg.)16.1%

GSP is the Gross State Product

Fiscal Year 2011

This table lists the tax revenue collected from each state, plus the District of Columbia and the territory of Puerto Rico by the IRS in fiscal year 2011, which ran from October 1, 2010, through September 30, 2011. The gross collections total only reflects the revenue collected from the categories listed in the table, and not the entire revenue collected by the IRS. Per capita values are based on population estimates from the Census Bureau for July 1, 2011. [7]

RankState
federal district
or territory
Gross collections [8] Revenue per capita (est.)Ratio to GSP
1 California $281,227,298,000$7,462.7914.4%
2 New York $202,149,306,000$10,365.7717.5%
3 Texas $198,295,817,000$7,736.3315.2%
4 Illinois $119,116,442,000$9,262.7317.8%
5 Florida $116,758,697,000$6,118.7015.5%
6 New Jersey $112,103,329,000$12,688.8723.0%
7 Ohio $112,069,407,000$9,710.5423.2%
8 Pennsylvania $103,134,437,000$8,092.8217.8%
9 Massachusetts $77,218,196,000$11,687.3319.7%
10 Minnesota $72,676,800,000$13,591.3125.8%
11 Georgia $60,601,096,000$6,175.9314.5%
12 Virginia $60,074,032,000$7,412.5414.0%
13 North Carolina $56,809,844,000$5,886.3612.9%
14 Michigan $55,625,833,000$5,631.9714.4%
15 Washington $52,531,569,000$7,698.8914.8%
16 Maryland $49,083,255,000$8,405.2816.3%
17 Missouri $46,794,981,000$7,787.5018.8%
18 Connecticut $45,561,956,000$12,702.9719.8%
19 Tennessee $45,189,610,000$7,061.1117.0%
20 Indiana $43,886,554,000$6,734.8315.8%
21 Colorado $40,328,519,000$7,882.3615.3%
22 Wisconsin $38,866,764,000$6,806.9815.3%
23 Louisiana $35,888,004,000$7,844.7714.5%
24 Arizona $32,920,415,000$5,090.2812.7%
25 Arkansas $26,326,077,000$8,958.7724.9%
26 Kentucky $24,451,664,000$5,599.4314.8%
27 Oklahoma $24,400,086,000$6,447.9515.7%
28 Oregon $22,366,343,000$5,782.0611.5%
29 Delaware $21,088,276,000$23,221.4732.1%
30 Alabama $20,394,671,000$4,245.6311.8%
31 Kansas $19,758,229,000$6,883.4715.1%
District of Columbia $19,619,128,000$31,693.8518.2%
32 Iowa $17,805,295,000$5,810.9412.0%
33 South Carolina $17,465,006,000$3,737.1510.5%
34 Nebraska $15,664,192,000$8,502.8216.6%
35 Utah $14,700,936,000$5,223.5711.8%
36 Nevada $13,032,725,000$4,791.3910.0%
37 Rhode Island $10,428,091,000$9,925.4120.8%
38 Mississippi $9,183,541,000$3,084.369.4%
39 New Hampshire $8,702,370,000$6,603.6813.7%
40 New Mexico $8,039,313,000$3,867.5210.1%
41 West Virginia $6,386,378,000$3,442.969.6%
42 Idaho $6,345,865,000$4,006.8811.0%
43 Maine $6,153,147,000$4,631.5011.9%
44 Hawaii $6,127,725,000$4,446.419.1%
45 North Dakota $4,917,384,000$7,181.3912.2%
46 Alaska $4,860,572,000$6,714.809.5%
47 South Dakota $4,624,947,000$5,615.5711.5%
48 Montana $4,197,002,000$4,206.8211.0%
49 Wyoming $3,516,453,000$6,197.979.3%
50 Vermont $3,333,342,000$5,319.8012.9%
Puerto Rico $3,313,199,000$896.89N/A
TOTAL [lower-alpha 2] $2,406,114,118,0007,631.63 (Avg.)16.0%

Maps and graphs

Map of total federal tax revenue by state in 2007.
Legend:
.mw-parser-output .legend{page-break-inside:avoid;break-inside:avoid-column}.mw-parser-output .legend-color{display:inline-block;min-width:1.25em;height:1.25em;line-height:1.25;margin:1px 0;text-align:center;border:1px solid black;background-color:transparent;color:black}.mw-parser-output .legend-text{}
<$25 billion
$25-$50 billion
$50-$75 billion
$75-$100 billion
$100-$125 billion
$125-$150 billion
$150-$175 billion
$175-$200 billion
>$200 billion US states by federal tax revenue.svg
Map of total federal tax revenue by state in 2007.
Legend:
Map of average federal tax revenue per capita by state in 2007.
Legend:
<$4,000
$4,000-$6,000
$6,000-$8,000
$8,000-$10,000
$10,000-$12,000
$12,000-$14,000
$14,000-$16,000
$16,000-$18,000
>$18,000 US states by federal tax revenue per capita.svg
Map of average federal tax revenue per capita by state in 2007.
Legend:
Share of federal revenue from different tax sources. Individual income taxes (blue), payroll taxes/FICA (green), corporate income taxes (red). Share of Federal Revenue from Different Tax Sources (Individual, Payroll, and Corporate) 1950 - 2010.gif
Share of federal revenue from different tax sources. Individual income taxes (blue), payroll taxes/FICA (green), corporate income taxes (red).

See also

Federal taxes:

State taxes:

General:

Notes

  1. 1 2 Puerto Rico is not a U.S. state but residents pay federal taxes; however, most are not required to pay federal income tax.
  2. 1 2 3 Ratio to GSP is excluding Puerto Rico.
  3. The District of Columbia is not a U.S. state, but its residents pay federal taxes.

Citations

  1. 1 2 3 4 5 6 7 8 9 "SOI Tax Stats" . Retrieved August 21, 2020.
  2. "Table 1. Annual Estimates of the Resident Population for the United States, Regions, States, and Puerto Rico: April 1, 2010 to July 1, 2016 (NST-EST2016-01)". Census.gov. U.S. Census Bureau, Population Division. December 2016. Retrieved February 3, 2017.
  3. "Internal Revenue Service Data Book, 2015" (PDF). IRS.gov. Statistics of Income Division, Communications and Data Dissemination Section. p. 12. Retrieved February 3, 2017.
  4. "Table 1. Annual Estimates of the Population for the United States, Regions, States, and Puerto Rico: April 1, 2010 to July 1, 2012 (NST-EST2012-01)". Census.gov. U.S. Census Bureau, Population Division. December 2012. Retrieved November 4, 2013.
  5. "Internal Revenue Service Data Book, 2012" (PDF). IRS.gov. Statistics of Income Division, Communications and Data Dissemination Section. p. 12. Retrieved November 4, 2013.
  6. "Archived copy" (PDF). Archived from the original (PDF) on November 22, 2017. Retrieved March 9, 2018.{{cite web}}: CS1 maint: archived copy as title (link)
  7. "Table 1. Annual Estimates of the Population for the United States, Regions, States, and Puerto Rico: April 1, 2010 to July 1, 2012 (NST-EST2012-01)" (xls). Census.gov. U.S. Census Bureau, Population Division. December 2012. Retrieved November 4, 2013.
  8. "Internal Revenue Service Data Book, 2011" (PDF). IRS.gov. Statistics of Income Division, Communications and Data Dissemination Section. p. 12. Retrieved November 4, 2013.

New table is available for 2015 to update the data. Also - would be good to be able to see some trends in the data in terms of growth by state in terms of taxes paid

Related Research Articles

<span class="mw-page-title-main">Taxation in the United States</span>

The United States of America has separate federal, state, and local governments with taxes imposed at each of these levels. Taxes are levied on income, payroll, property, sales, capital gains, dividends, imports, estates and gifts, as well as various fees. In 2020, taxes collected by federal, state, and local governments amounted to 25.5% of GDP, below the OECD average of 33.5% of GDP. The 21. Revenue Statistics 2021: The Initial Impact of COVID-19 on OECD Tax Revenues, OECD Publishing, Paris, doi:10.1787/6e87f932-en. Tax-to-GDP figures for 2020 are preliminary.</ref>

<span class="mw-page-title-main">Insular area</span> U.S. territory that is neither a U.S. state nor the District of Columbia

In the law of the United States, an insular area is a U.S.-associated jurisdiction that is not part of the 50 states or the District of Columbia. This includes fourteen U.S. territories administered under U.S. sovereignty, as well as three sovereign states each with a Compact of Free Association with the United States. The term also may be used to refer to the previous status of the Philippine Islands and the Trust Territory of the Pacific Islands when it existed.

<span class="mw-page-title-main">Territories of the United States</span>

Territories of the United States are sub-national administrative divisions overseen by the federal government of the United States. The various American territories differ from the U.S. states and Indian reservations as they are not sovereign entities. In contrast, each state has a sovereignty separate from that of the federal government and each federally recognized Native American tribe possesses limited tribal sovereignty as a "dependent sovereign nation." Territories are classified by incorporation and whether they have an "organized" government through an organic act passed by the Congress. American territories are under American sovereignty and, consequently, may be treated as part of the United States proper in some ways and not others. Unincorporated territories in particular are not considered to be integral parts of the United States, and the Constitution of the United States applies only partially in those territories.

Excise tax in the United States is an indirect tax on listed items. Excise taxes can be and are made by federal, state and local governments and are not uniform throughout the United States. Certain goods, such as gasoline, diesel fuel, alcohol, and tobacco products, are taxed by multiple governments simultaneously. Some excise taxes are collected from the producer or retailer and not paid directly by the consumer, and as such often remain "hidden" in the price of a product or service, rather than being listed separately.

<span class="mw-page-title-main">Economy of California</span> Overview of the economy of the State of California

The economy of the State of California is the largest in the United States, with a $3.6 trillion gross state product (GSP) as of 2022. It is the largest sub-national economy in the world. If California were a sovereign nation (2022), it would rank in terms of nominal GDP as the world's fifth largest economy, behind Germany and ahead of India. Additionally, California's Silicon Valley is home to some of the world's most valuable technology companies, including Apple, Alphabet, and Nvidia. In total, over 10% of Fortune 1000 companies were based in California in 2018, the most of any state.

<span class="mw-page-title-main">Income tax in the United States</span> Form of taxation in the United States

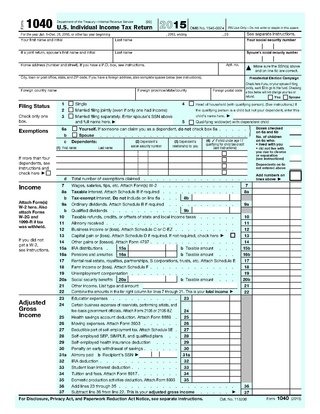
The United States federal government and most state governments impose an income tax. They are determined by applying a tax rate, which may increase as income increases, to taxable income, which is the total income less allowable deductions. Income is broadly defined. Individuals and corporations are directly taxable, and estates and trusts may be taxable on undistributed income. Partnerships are not taxed, but their partners are taxed on their shares of partnership income. Residents and citizens are taxed on worldwide income, while nonresidents are taxed only on income within the jurisdiction. Several types of credits reduce tax, and some types of credits may exceed tax before credits. An Alternative Minimum Tax (AMT) applies at the federal and some state levels.

<span class="mw-page-title-main">State tax levels in the United States</span> Indicate both the tax burden and the services a state can afford to provide residents

State tax levels indicate both the tax burden and the services a state can afford to provide residents.

<span class="mw-page-title-main">Household income in the United States</span> US family income

Household income is an economic standard that can be applied to one household, or aggregated across a large group such as a county, city, or the whole country. It is commonly used by the United States government and private institutions to describe a household's economic status or to track economic trends in the US.

Tax protesters in the United States have advanced a number of arguments asserting that the assessment and collection of the federal income tax violates statutes enacted by the United States Congress and signed into law by the President. Such arguments generally claim that certain statutes fail to create a duty to pay taxes, that such statutes do not impose the income tax on wages or other types of income claimed by the tax protesters, or that provisions within a given statute exempt the tax protesters from a duty to pay.

<span class="mw-page-title-main">Economy of Puerto Rico</span> Classified as a high income economy by the World Bank

The economy of Puerto Rico is classified as a high income economy by the World Bank and as the most competitive economy in Latin America by the World Economic Forum. The main drivers of Puerto Rico's economy are manufacturing, primarily pharmaceuticals, textiles, petrochemicals, and electronics; followed by the service industry, notably finance, insurance, real estate, and tourism. The geography of Puerto Rico and its political status are both determining factors on its economic prosperity, primarily due to its relatively small size as an island; its lack of natural resources used to produce raw materials, and, consequently, its dependence on imports; as well as its relationship with the United States federal government, which controls its foreign policies while exerting trading restrictions, particularly in its shipping industry.

<span class="mw-page-title-main">Internal Revenue Service</span> Revenue service of the United States federal government

The Internal Revenue Service (IRS) is the revenue service for the United States federal government, which is responsible for collecting U.S. federal taxes and administering the Internal Revenue Code, the main body of the federal statutory tax law. It is an agency of the Department of the Treasury and led by the Commissioner of Internal Revenue, who is appointed to a five-year term by the President of the United States. The duties of the IRS include providing tax assistance to taxpayers; pursuing and resolving instances of erroneous or fraudulent tax filings; and overseeing various benefits programs, including the Affordable Care Act.

Taxation in Puerto Rico consists of taxes paid to the United States federal government and taxes paid to the Government of the Commonwealth of Puerto Rico. Payment of taxes to the federal government, both personal and corporate, is done through the federal Internal Revenue Service (IRS), while payment of taxes to the Commonwealth government is done through the Puerto Rico Department of Treasury.

The United States federal government defines and delineates the nation's metropolitan areas for statistical purposes, using a set of standard statistical area definitions. As of 2020, the U.S. Office of Management and Budget (OMB) defined and delineated 392 metropolitan statistical areas (MSAs) and 547 micropolitan statistical areas (μSAs) in the United States and Puerto Rico. Many of these 939 MSAs and μSAs are, in turn, components of larger combined statistical areas (CSAs) consisting of adjacent MSAs and μSAs that are linked by commuting ties; as of 2020, 551 metropolitan and micropolitan areas are components of the 175 defined CSAs. A collective term for MSAs, μSAs, and CSAs is primary statistical areas (PSAs), though that term is not used by OMB.

The political status of Puerto Rico has ramifications into many spheres of Puerto Rican life, and there are limits to the level of autonomy the Puerto Rican government has. For example, the Island's government is not fully autonomous, and the level of federal presence in the Island is common place, including a branch of the United States Federal District Court. There are also implications relative to the American citizenship carried by people born in Puerto Rico. Specifically, although people born in the Commonwealth of Puerto Rico are natural born U.S. citizens, their citizenship is not protected by the Citizenship Clause of the 14th Amendment to the U.S. Constitution. As such, the American citizenship of Puerto Ricans can be taken away by the U.S. Congress unilaterally. Puerto Ricans are also covered by a group of "fundamental civil rights" but, since Puerto Rico is not a state, Puerto Ricans are not covered by the full American Bill of Rights. As for taxation, Puerto Ricans pay U.S. federal taxes, but most residents of the island are not required to file federal income tax returns. Representation-wise, Puerto Ricans have no voting representative in the U.S. Congress, but do have a Resident Commissioner who has a voice in Congress. Puerto Ricans must also serve in the United States military anytime conscription is ordered, with the same duties as a US citizen residing in the 50 states.

References