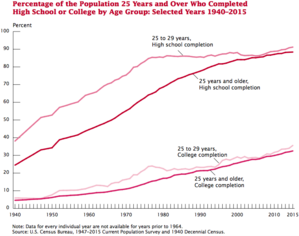
This graph shows the educational attainment since 1940.
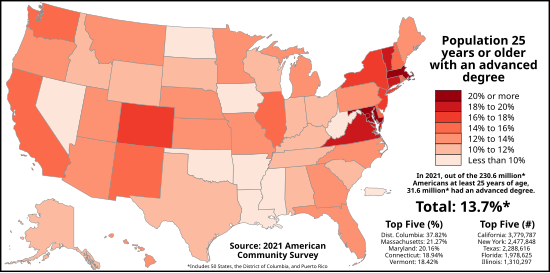
Proportion of Americans with an Advanced degree (e.g. Master's, Doctorate) in each U.S. state, the District of Columbia, and Puerto Rico as of the 2021 American Community Survey
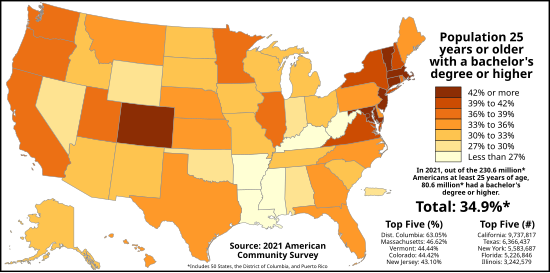
Proportion of Americans with a bachelor's degree or higher in each U.S. state, the District of Columbia, and Puerto Rico as of the 2021 American Community Survey
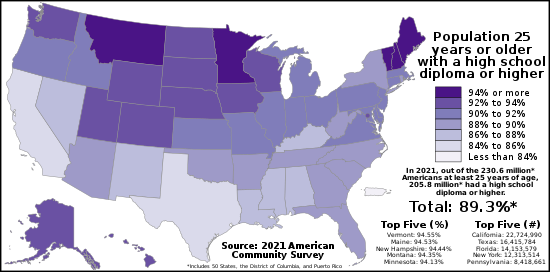
Proportion of Americans with a high school diploma or higher in each U.S. state, the District of Columbia, and Puerto Rico as of the 2021 American Community Survey
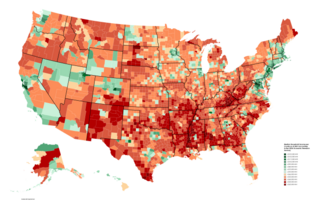
2008 - 2012 Bachelor's Degree or Higher (5-year estimate) by County (percent)
The educational attainment of the U.S. population refers to the highest level of education completed.[2] The educational attainment of the U.S. population is similar to that of many other industrialized countries with the vast majority of the population having completed secondary education and a rising number of college graduates that outnumber high school dropouts. As a whole, the population of the United States is spending more years in formal educational programs. As with income, levels differ by race, age, household configuration, and geography.[3]
Information on educational attainment of the U.S. population has been collected in every decennial census since 1940.[4] At a national level, reports show rates of educational attainment by age, sex, race, and Hispanic origin. Differing at the regional and state levels, educational attainment data are shown by sex, race, and Hispanic origin (not age).[4]
Overall, the demographics with the highest educational attainment in the United States are also those with the highest household income and wealth.[3]
In 2018, nearly 9/10 (90 percent) of all adults 25 years or older reported they had completed at least high school, or obtained a GED/high school equivalency certificate. Over one in three adults (35 percent) had attained at least a bachelor's degree. Both of these measures are all time highs. In 2003, the percentage of the adult population who had completed high school or had not completed high school but obtained a GED increased for the first time since 2000, when it was 84 percent. This increase follows a general trend that the Current Population Survey has shown since educational attainment was first measured in 1947.[3]
Since 1983, the percentage of people either graduating from high school or failing to complete high school but getting a GED certification has increased from 85% to 90%. The greatest increases in educational attainment were documented in the 1950s, 60s, and 70s. In the 1950s and much of the 1960s high school graduates constituted about 50% of those considered adults (25 and above). For adults aged between 25 and 30, the percentage of either high school graduates or GED obtainers was roughly 50% in 1950 versus 90% today.[3]
According to The United States Census Bureau,[4] from 1940 to 1980, respondents were asked to what their highest grade or year of school completed was. Here are two examples of the questions asked:
What is the highest grade (or year) of school this person has ever attended?
Did he finish the highest grade (or year) he attended?
The answers consisted mostly of the following:
No school completed or never attended school
Nursery school (added as a choice in 1960)
Elementary school, grades 1, 2, 3, etc. to 8
High school 1st to 4th year…1, 2, 3, 4
College, 1st year, 2nd year, etc.
However, in 1990, the Census Bureau changed educational attainment question as society became more educated as a whole. Now, respondents are asked to report what their highest level of school/highest degree received is. Responses may include; "High school graduate" and "Bachelor's degree."[4]
Gender
For the past fifty years, there has been a gap in the educational achievement of males and females in the United States, but which gender has been underperforming has fluctuated over the years. In the 1970s and 1980s, data showed girls trailing behind boys in a variety of academic performance measures, specifically in test scores in math and science.[6]
Achievement gaps between boys and girls in the United States are more pronounced in reading and writing than in math and science.
Data in the last twenty years[when?] shows the general trend of girls outperforming boys in academic achievement in terms of class grades across all subjects and college graduation rates, but boys score higher on standardized tests and are better represented in higher-paying and more prestigious STEM fields (science, technology, engineering, and math).[6]
Employment Rates Linked to Gender and Educational Attainment
While the correlation between educational achievement and employment rates applies to both men and women, it's notably stronger for women. In 2021, among individuals aged 25–34, only 43% of women with education below the upper secondary level were employed, compared to 82% of those with tertiary education. For men, these figures were 69% and 88%, respectively.[7] The significant gender gap observed among younger adults with education below the upper secondary level is unlikely solely due to differences in employability; rather, it's more likely tied to the persistence of traditional gender roles. Women who anticipate fulfilling caregiving responsibilities at home instead of pursuing careers may have less motivation to pursue formal education, leading to lower educational attainment. This is evidenced by the fact that inactivity rates among younger women with education below the upper secondary level are, on average, more than twice as high as those for men, resulting in lower employment rates across OECD countries.
Gender gap in literacy
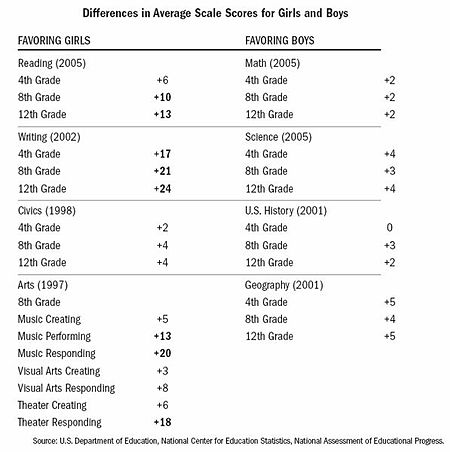
Traditionally, girls have outperformed boys in reading and writing. Although this gap may be minimal in kindergarten, it grows as students continue their education. According to the 2004 National Reading Assessment measured by the US Department of Education, the gap between boys and girls, only slightly noticeable in 4th grade, left boys 14 points behind girls during their 12th grade year.[8] On the 2008 test, female students continued to have higher average reading scores than male students at all three ages. The gap between male and female 4th graders was 7 points in 2008. By 12th grade, there was an 11-point gap between males and females.[8]
On the 2002 National Writing Assessment, boys scored on average 17 points lower than girls in 4th grade. The average gap increased to 21 points by 8th grade and widened to 24 points by senior year in high school.[9] In the more recent 2007 National Assessment of Writing Skills, female students continued to score higher than male students, though margins closed slightly from previous assessments. The average score for female eighth-graders was 20 points higher than males, down 1 point from the 2002 score. For twelfth-graders, females outscored males by 18 points as opposed to 24 points in 2002.[10]
All of these assessments were conducted on a 100-point scale.[8][9][10]
A recent study has since discovered that many schools are not heavily focused in the performance of how young males grow in their educational development as they are with girls. [45].
Women have different issues in educational attainment. New studies have shown that, when it comes to completing their education, women are pushed to go after a bachelor degree but that financial issues affect them. [46]
Graduation rates
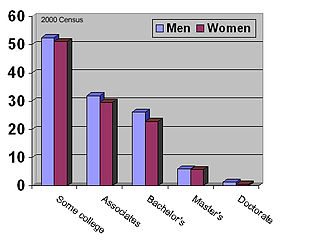
Overall, women have surpassed men in terms of completion of secondary and post-secondary education. In 2015/2016, women earned 61% of associate degrees, 57% of bachelor's degrees, 59% of master's degrees, and 53% of doctorates.[11] A similar pattern is also seen in high school education, where, in 2016, 7.1% of males, but only 5.1% of females dropped out of high school.[12]
In 2015/2016, 56 percent of college students were female and 44 percent were male. From 1990 until 2015, the number of males enrolled in college increased by 41 percent, and the number of female students rose by 53 percent.[11] In 2015/2016, 51% of degrees earned by males were bachelor's, which is slightly higher than that of females for whom 48% of degrees earned were bachelor's degrees.[11] As of 2006, the numbers of both men and women receiving a bachelor's degree has increased significantly, but the increasing rate of female college graduates exceeds the increasing rate for males.[13]
In 2007, the United States Census Bureau estimated that 18,423,000 males over the age of 18 held a bachelor's degree, while 20,501,000 females over the age 18 held one. In addition, fewer males held master's degrees: 6,472,000 males compared to 7,283,000 females. However, more men held professional and doctoral degrees than women. 2,033,000 males held professional degrees compared to 1,079,000, and 1,678,000 males had received a doctoral degree compared to 817,000 females.[14]
Women were projected to earn 64.2% of associate degrees, 59.9% of bachelor's degrees, 62.9% of master's degrees, and 55.5% of Doctorates by 2016/2017.[15]
Gender Gaps and communities
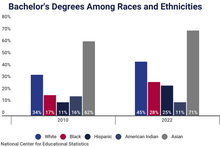
The increase in educational attainment has slightly increased in certain communities. In the stat below you can see that there is not a huge shift in Asian communities from 2010 to 2022 in comparison to African-American and white communities there has been an increase in those communities achieving their degrees. [47].
The statistics of Bachelor Degrees between female and males in America
There have been reports as of last year stating that there have not been much improvements of marginalized communities going to college because that increase is ever so slight.
Other communities reports are not as open to the public as we mainly focus on the two main communities when it comes to educational status and that itself is an issue because education is a topic that affects every person because that is the system we are born into and that we either have the choice to continue or not given certain circumstances.
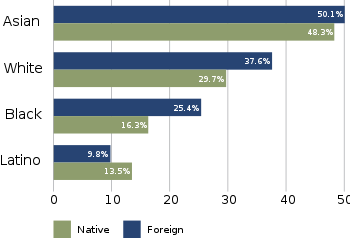
While the educational attainment of all races increased during the 1990s, with the gap between African Americans and non-Hispanic whites decreasing, differences between the races remain, especially among those with a bachelor's degree or higher. Asian Americans had the highest educational attainment of any race, followed by whites who had a higher percentage of high school graduates but a lower percentage of college graduates. Persons identifying as Hispanic or Latino, without regard to race, had the lowest educational attainment. The gap was the largest between foreign-born Asian Americans, over half (50.1%) of whom had a bachelor's degree or higher and foreign-born Hispanics, 9.8% of whom had a four-year college degree.[3]
Hispanics and Latinos also trailed far behind in terms of graduating from high school; it was the only major group for which high school graduates constituted less than 80% of the population. This large inequality might partially be explained by the influx of uneducated foreign-born Hispanic Americans who had not been offered the chance to complete secondary education in their home country and who had not completed secondary education in the United States.
Overall, nearly half (49.8%) of Asian Americans, nearly a third (30%) of non-Hispanic whites, 17.3% of non-Hispanic blacks, and just over a tenth (11.4%) of Hispanics or Latinos had a four-year college degree. The same differences decrease significantly at the high school level with 89.4% of non-Hispanic whites, 87.6% of Asian Americans, 80.0% of African Americans, and 57% of Hispanics or Latinos having graduated from high school.[3]
In 2015, the average SAT scores on the math section were 598 for Asian-Americans, 534 for whites, 457 for HispanicLatinos and 428 for blacks.[16] Additionally, 10% of Asian-Americans, 8% of whites, 3% of Mexican Americans, 3% of Native Americans and 2% of blacks scored above 600 on the SAT verbal section in 1990.[17] Race gaps on the SATs are especially pronounced at the tails of the distribution. In a perfectly equal distribution, the racial breakdown of scores at every point in the distribution should ideally mirror the demographic composition of test-takers as whole i.e. 51% whites, 21% Hispanic Latinos, 14% blacks, and 14% Asian-Americans. But among the highest top scorers, over 60% of those scoring between a 750 and 800 (perfect scores) are East Asians of Taiwanese, Japanese, Korean and Han Chinese descent, while only 33% are white, compared to 5% Hispanic Latinos and 2% blacks.[16] In August 2020, the US Justice Department argued that Yale University discriminated against Asian candidates on the basis of their race, a charge the university denied.[18]
The Racial achievement gap in the United States refers to these educational disparities between differing ethnic groups. Several racial achievement gaps remain present today because not all groups of students are advancing at the same rates. These racial achievement gaps have many individual and economic implications and there have been many efforts in education reform to narrow the gaps.
Immigrants
The difference among races and cultures in 2003, both native and foreign born, in regard to those who have earned a bachelor's degree or higher
Among some broad ethnic groups, notably Asians, Europeans, and Africans, foreign-born immigrants show a higher educational attainment than native-born Americans in the same group. According to the U.S census, African immigrants achieved the most college degrees at about 43.8 percent, compared to 42.5 percent of Asian-Americans, 28.9 percent for immigrants from Europe, Russia and Canada and 23.1 percent of the U.S. population as a whole.[19][20][21][dead link]
The opposite is true among Hispanics, where the dramatically lower educational attainment of the foreign-born population decreased the overall educational attainment of the general Hispanophone population.[3] The rate of immigrants
with a high school diploma (67 percent) was dramatically lower than that of the native population (88 percent), but paradoxically, the percentage with a bachelor's degree was the same (27 percent)... At the bachelor's level, foreign born blacks and non-Hispanic whites fared better than their native counterparts. Foreign-born Hispanics, in contrast, had a smaller proportion with a bachelor's degree than the native population... The low educational attainment of foreign-born Hispanics, who compose more than 50 percent of the Hispanic population, contributes to the low attainment levels of the entire Hispanic population. — US Census Bureau, 2003
Only among Hispanics and Latinos was the proportion of college graduates larger among the native born population. In the general population the proportion of persons with a bachelor's degree or higher was the same among the foreign-born and native-born population (27.2%). As stated above fewer foreign born Americans completed high school than native born Americans. Overall, 87.5% of the native born population had graduated from high school, versus 67.2%. Among whites the difference was three percentage points, the same as for African Americans. Among Asian Americans the difference was five percentage points. It was thirty percentage points among Hispanics or Latinos.[3]
African immigrants have been among the more highly educated groups in the United States since the 1990s.[22][23] This phenomenon is related to the large "brain drain" in Africa.[24]
Income
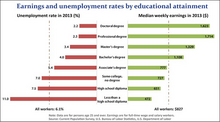
Chart of unemployment and salary based on education attainment Data are for persons age 25 and over. Earnings are for full-time wage and salary workers.
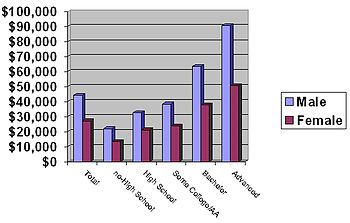
Educational attainment is strongly correlated with income in the United States. Although the incomes of both men and women are associated with higher educational attainment (higher incomes for higher educational attainment), large income gaps linked to race and gender remained at each educational level. In 2003, average incomes ranged from $13,459 for a male high-school dropout to $90,761 for a male with an advanced degree. The most significant average income difference was between those who had some college education or an associate degree and those who had a bachelor's degree. While those with some college averaged $31,046, those with a bachelor's degree averaged $51,194, over $20,000 (64.9%) a year more.[3]
The second most dramatic difference in average income was between those with a bachelor's degree with $51,940 and those with an advanced degree who made $72,824, roughly $21,000 (42.2%) more. The least significant difference was between those who had graduated from high school and those who had either some college or an associate degree. Here the difference was a mere $3,766 or 13.8%. The difference between those with a high school diploma ($30,000) and those who did not complete high school ($18,826) was $8,454 or 45%. Overall, the income in the United States for all sexes, races and levels of educational attainment was $36,308 annually.[3]
Even though African immigrants are claimed to have higher educational attainment rates than any other group, they were the hardest hit during the recession beginning in 2007.[25][20][26][27] This shows that race and/or ethnicity may play a role in income levels and job selection.[26]
The change in median personal and household income since 1991 also varied greatly with educational attainment. While both the overall median personal and household income increased since 1991, this increase did not take place on all levels of educational attainment. The overall income increased over the course of the 1990s, reaching its high in 1999, but has been decreasing ever since. In 1991 the median household income in the US was $40,873 in 2003 dollars, while the median household income in 2003 was $45,016. In 1999, however, the median household income was $46,236, 2.7% higher than today. While this trend held true for all levels of educational attainment the extent of chronicle fluctuations in income were greatly influenced by educational attainment.[28][29]
Overall, the median household and personal income decreased for those with more than a 9th grade education but less than a four-year college degree since 1991. In other words, the median household income decreased for households and individuals at the high school drop-outs and graduate, some-college, and an associate degree level. Income did, however, increase for those with a bachelor's degree or more. The following table shows the median household income according to the educational attainment of the householder. All incomes are adjusted for inflation and are in 2019 dollars. These data only apply to households whose householder is aged twenty-five or older. The highest and lowest points of the median household income are presented in bold face.[28][29]
Year
Overall Median
Less than 9th grade
High school drop-out
High school graduate
Some college
Associate degree
Bachelor's degree
Bachelor's degree or more
Master's degree
Professional degree
Doctorate degree
1991
$56,965
$24,270
$32,189
$52,293
$64,525
$72,877
$89,407
$95,952
$101,281
$143,090
$129,078
1993
$56,197
$24,320
$31,388
$50,142
$61,533
$69,155
$89,941
$98,040
$105,422
$153,161
$130,601
1995
$58,881
$25,138
$30,578
$52,433
$62,092
$70,385
$88,330
$97,011
$108,555
$137,047
$133,697
1997
$60,849
$24,762
$31,629
$53,821
$63,756
$72,110
$94,082
$100,844
$108,529
$146,948
$138,988
1999
$64,474
$26,506
$33,436
$54,833
$67,755
$75,694
$98,901
$107,315
$114,482
(Not avail.)
$149,510
2001
$63,100
$26,229
$33,656
$52,190
$66,311
$74,058
$97,223
$104,633
$114,212
(Not avail.)
$134,339
2003
$62,726
$26,178
$31,656
$51,326
$63,894
$72,416
$95,766
$102,341
$109,440
(Not avail.)
$134,924
2005
$62,618
$26,540
$32,381
$50,118
$63,363
$71,795
$95,042
$101,282
$106,327
(Not avail.)
(Not avail.)
2007
$63,566
$25,716
$30,273
$50,006
$62,320
$74,326
$95,923
$104,456
$112,060
(Not avail.)
(Not avail.)
2009
$60,884
$25,843
$30,583
$47,358
$57,828
$67,833
$90,205
$98,810
$109,486
$147,857
$144,380
2011
$58,376
$24,860
$28,132
$44,907
$54,093
$63,712
$89,142
$95,674
$103,605
$137,363
$121,945
2013
$58,515
$26,596
$28,220
$44,741
$54,615
$61,762
$87,416
$94,989
$105,473
$143,612
$133,324
2015
$62,636
$28,329
$28,441
$45,373
$56,012
$67,428
$94,952
$102,444
$109,338
$147,449
$130,835
2017
$65,314
$27,729
$31,392
$46,901
$57,949
$67,022
$95,712
$104,316
$112,878
$145,040
$146,126
2019
$70,308
$30,355
$31,326
$48,708
$61,911
$69,573
$100,164
$108,646
$117,439
$162,127
$142,347
Average
$61,694
$26,225
$31,019
$49,677
$61,197
$70,010
$93,480
$101,117
$109,235
$146,369
$136,161
SOURCE: US Census Bureau, 2020[31] Yellow indicates the year with the lowest median income while green indicates the year with the highest reported median income.
Income by education and race
Among the races, educational attainment retains its dramatic effect on average income which varies significantly at each educational level. European Americans (White Americans) had the highest average income at every level of educational attainment. However, the proportion of those having college degrees is greater among Asian Americans than among non-Hispanic whites, and the overall highest average income is found among Asians. All races except Whites ranked last on at least one level with African Americans ranking last on the non-high school, high school and advanced degree level.[3]
Asians were second highest on the college graduate level and had the highest overall income among the general population. They also had the lowest average annual income for those with some college education or an associate degree. Racial income difference were also significant at every level of educational attainment with the largest racial inequality being between European and African Americans who did not complete high school and those with advanced college degrees.[3]
Overall, European Americans with an advanced degree had the highest average annual income with $74,122. Asian Americans had the second highest with $72,852. Hispanics and African Americans had the lowest annual incomes among those with advanced degrees averaging $67,679 and $59,944 annually. The largest racial inequity was between European Americans with a bachelor's degree who made $53,185 and Hispanics who made $12,263 or 29.9% less with an average annual income of $40,949.[3] However, Asian Americans as a whole earn more than any other race due to a greater percentage of them being educated overall, an example of Simpson's paradox.
Occupation
The rising demand for skilled workers indicates that job markets are able to accommodate an increasing number of highly qualified individuals, offering them improved employment opportunities. Conversely, adults with lower educational backgrounds face more daunting prospects in the labor market. They tend to earn lower wages and are at a higher risk of experiencing unemployment.[32] In the foreseeable future, their unemployment risk is expected to escalate further due to the likelihood of automation affecting many jobs that require lower qualifications.[33] Studies suggest that around 14% of current jobs could vanish due to automation within the next 15–20 years, while another 32% are anticipated to undergo significant changes as specific tasks become automated [34]
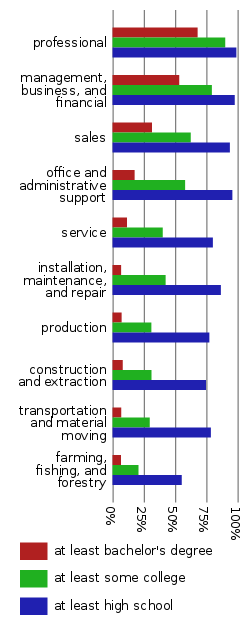
The educational attainment of employed civilians age 25 to 64 according to occupational field
The educational attainment varied significantly among the different types of occupations. The professional/managerial fields were the only two occupational fields where college graduates with a bachelor's degree or higher represented the majority. Among professional occupations, 99.1% of the population graduated from high school, 90.2% had some college education or an associate degree and over two thirds, 68.2% had a bachelor's degree or higher.[3]
Business and managerial occupations were second with 97.8% having graduated from high school, 79.5% having some college or an associate degree and just over half, 53.4% having a bachelor's degree or higher. While nearly all employment fields feature a population where over 80% had graduated from high school with over a third having some college education or an associate degree, the fields relating to agriculture, construction, manufacturing, and transportation did not. These, often described as blue collar, fields featured a labor force where less than a tenth of the population had a bachelor's degree or higher, less than half had some college or an associate degree, and less than 80% had graduated from high school.[3]
Overall, the least educated occupational field was agriculture, ranking last on all educational levels. Here 55.4% had graduated from high school, roughly one fifth (20.8%) had some college education or an associate degree and 6.8% had a bachelor's degree or higher. While the largest occupational field, that consisting of professionals and relating occupations was also the largest field, the fields with lower educational attainment combined were larger than the professional and managerial fields combined. Overall, 38.02% were employed in the professional and managerial fields while 61.89% were employed in the other white and blue collar fields were those with a bachelor's degree or higher constituted less than a third of the work force.[3]
The percent of the labor force in the Professional/Managerial and relating occupations, white collar occupations and blue collar occupations
Religion
The Pew Research Center's 2014 Religious Landscape Study found educational attainment varied considerably across religious groups.[35]
Membership in these religious groups can be highly correlated with demographic groups and geographic areas, so membership in a particular religion is not the only explanation for these differences, and vice versa.
Conservative Protestant Christian women who are more involved in their churches complete around one year more of schooling than those who are less involved. However, fundamentalist Christian students will likely have a harder time receiving higher education. This is due to the fact that fundamentalist Christians discourage college preparatory high school courses due to their emphasis on humanism, evolution, and tolerance. This in turn lowers their chances of getting into university, along with higher educational institutions sometimes discriminating against these fundamentalist groups.[36]
Using data from the 1987–88 National Survey of Families and Households,[37] Evelyn L. Lehrer found that the religion with the highest level of educational attainment was Jews, that Catholics and mainline protestants fell in the middle, and fundamentalists had the lowest levels of educational attainment.[38]
Michael A Kortt and Joseph Drew found that educational attainment in regards to religion can change with time. Specifically they found that:
Christian Men in the Silent Generation had less educational attainment, but that their attainment increased for most denominations in future generations.
However, Christian groups that are not part of the National Council of Churches (NCC) retained low educational attainment because of their more tightly held conservative beliefs.
Additionally, educational attainment increased for Jewish males from Generation Y onward and from Generation X onward for non-Christian males of other religions.
Anglican and non-NCC Women mirrored the educational attainment levels of non-NCC men.
Jewish women had more educational attainment than non-religious women earlier than Jewish men did.
Other non-Christian religious women also achieved higher educational attainment in proportion to non-religious women earlier than their male counterparts, but this did not continue in Generation Y.[39]
Geography
Educational attainment among the population aged 25 and above varied rather slightly with geography region. The population of the Northeastern United States, which had the smallest population of any region with thirty-six million residents, had the highest percentage of high-school and college graduates. The western United States had the highest percentage of those with some college or an associate degree and ranked second for college graduates. The South which had by far the largest population with roughly sixty-six million people had the lowest educational attainment at every level.[3]
The proportion of high school graduates was the largest in the Midwest while the proportion of those with some college or an associate degree was the second and that of those with a bachelor's degree or higher was the third largest of any region.
Social class and education
Educational attainment is one of the primary indicators of social class in the United States.[40] While the American social class system is a vaguely defined concept with many contradicting theories,[41][42] educational attainment emerges as one of the top assessments of social class. Not only is a high educational attainment a status symbol by itself, but it is also very closely related to the other two main indicators of social class: occupation and income. A graduate degree and the roughly seven to eight years of post-secondary education serve as the main requirement for entering the "professions" and becoming part of the professional middle class.[40]
Education is a major key in becoming a more privileged member of the American middle class.[40][42] Overall, educational attainment is the main entrance barrier into more privileged parts of the middle class as it is not only of high value but is also the requirement for becoming a professional and earning the corresponding income.[40] This corresponding income is typically significantly higher than that of someone without this higher level of educational attainment in the United States. Exceptions include some entrepreneurs who can rank anywhere in the class system but are usually not referred to as professional middle class unless they are of the professions.
In the United States, it is also important to differentiate between the statistical middle class, often defined as consisting of those who are neither rich nor poor, and the professional middle class. Recent research has shown that not only is the statistical middle of society (those with income roughly 80% to 120% of the national median or members of the mid-quintile) no longer able to afford the lifestyle indicative of the middle class,[43] but there also seems to be a widening income gap in between those who may be described as being middle class.
Education is not only the main requirement for becoming a member of the professional middle class, it is also key to a comfortable lifestyle and economic security.[40] Those in the statistical middle may have to fear lay-offs and cost-cutting downsizing as well as out-sourcing, while some of those in the professional middle class are less subject to economic fluctuations and are more likely to enjoy upper-middle range incomes even in the face of recessions. Increasingly however even the professional middle class is facing lay-offs and job elimination due to downsizing and replacement of full-time workers with part-time workers—this is particularly evident in colleges and universities where, by 2009, half of the faculty were part-time; another 25% were full-time but with short-term contracts, thus showing that advanced education is not necessarily associated with high salaries and economic stability.[44]
Educational attainment in social theory
Mean financial wealth of U.S. families by education of the head of household, 1989–2010Mean income of U.S. families by education of the head of household, 1989–2010
Bourdieu and cultural capital
Many scholars have studied educational attainment in the US as a form of social reproduction and stratification. In 1977, Pierre Bourdieu presented the idea that education leads to social reproduction and a stratified society by honoring the cultural capital of elite classes. Students who possess the valued cultural capital, according to Bourdieu, are rewarded with high academic achievement.[45]
When elite class members enter the workforce, they are channeled into high paying jobs and powerful positions within society, while those who did not achieve the same level of academic success fall into subordinate occupations and status levels. By rewarding the desired cultural capital with high academic achievement, upper classes are able and prepared to reach higher levels of educational attainment. Members of the working class, on the other hand, are not rewarded for their cultural capital in schools, and are instead socialized for working class jobs.
Lareau and concerted cultivation
Annette Lareau also addresses the factors that lead to social stratification in educational attainment. Lareau's idea of concerted cultivation refers to an active involvement of parents in a child's learning and development experiences by creating and controlling organized activities for their children. According to Lareau, middle-class parents engage in concerted cultivation to teach their children, while lower- and working-class parents do not. Laureau further explains that schools firmly encourage and expect parents to use concerted cultivation as a child-rearing strategy.[46]
The child-rearing practices of lower- and working-class families thus do not comply with the standards of educational institutions. As a result, lower- and working-class students develop a sense of "distance, distrust, and constraint" in educational institutions, while children of middle-class families gain a sense of entitlement. These differences in child-rearing practices lead to children of lower- and working-class families to lack the necessary life skills that the children of the middle class possess, further isolating them from educational opportunities. In the United States, education attainment typically is viewed as a sign of social status.
Collins and credentialism
Randall Collins contributed the idea of credentialism to the study of class-based differences in educational attainment. Collins maintains that public schools are socializing institutions that teach and reward middle-class values of competition and achievement. In this view, elites are selectively separated from other students and placed into prestigious schools and colleges, where they are trained to hold positions of power.[47]
Ochiltree County is a county located in the panhandle of the U.S. state of Texas. As of the 2020 census, its population was 10,015. The county seat is Perryton. The county was created in 1876 and organized in 1889. and is named for William Beck Ochiltree, who was an attorney general of the Republic of Texas. It was previously one of 30 prohibition or entirely dry counties in the state of Texas.
Benton is a city in Butler County, Kansas, United States. As of the 2020 census, the population of the city was 943. It is located northeast of Wichita along K-254 highway.
In the United States, education is provided in public and private schools and by individuals through homeschooling. State governments set overall educational standards, often mandate standardized tests for K–12 public school systems and supervise, usually through a board of regents, state colleges, and universities. The bulk of the $1.3 trillion in funding comes from state and local governments, with federal funding accounting for about $260 billion in 2021 compared to around $200 billion in past years.
Social class in the United States refers to the idea of grouping Americans by some measure of social status, typically by economic status. However, it could also refer to social status and/or location. The idea that American society can be divided into social classes is disputed, and there are many competing class systems.
Achievement gaps in the United States are observed, persistent disparities in measures of educational performance among subgroups of U.S. students, especially groups defined by socioeconomic status (SES), race/ethnicity and gender. The achievement gap can be observed through a variety of measures, including standardized test scores, grade point average, dropout rates, college enrollment, and college completion rates. The gap in achievement between lower income students and higher income students exists in all nations and it has been studied extensively in the U.S. and other countries, including the U.K. Various other gaps between groups exist around the globe as well.
Household income is an economic standard that can be applied to one household, or aggregated across a large group such as a county, city, or the whole country. It is commonly used by the United States government and private institutions to describe a household's economic status or to track economic trends in the US.
Though the American middle class does not have a definitive definition, contemporary social scientists have put forward several ostensibly congruent theories on it. Depending on the class model used, the middle class constitutes anywhere from 25% to 75% of households.
Bachelor's degree or higher is a commonly used term by the United States Census Bureau and other U.S. government agencies on the federal as well as state and local level. The term describes the portion of the population that has either a bachelor's degree or a higher degree such as a master's or doctorate degree. In 2017, 33.4% of the population over 25 years old in the United States had a bachelor's degree or higher.
The African-American middle class consists of African-Americans who have middle-class status within the American class structure. It is a societal level within the African-American community that primarily began to develop in the early 1960s, when the ongoing Civil Rights Movement led to the outlawing of de jure racial segregation. The African American middle class exists throughout the United States, particularly in the Northeast and in the South, with the largest contiguous majority black middle-class neighborhoods being in the Washington, DC suburbs in Maryland. The African American middle class is also prevalent in the Atlanta, Charlotte, Houston, Dallas, Los Angeles, New Orleans, New York, San Antonio and Chicago areas.
Personal income is an individual's total earnings from wages, investment interest, and other sources. The Bureau of Labor Statistics reported a median weekly personal income of $1,037 for full-time workers in the United States in Q1 2022. For the year 2020, the U.S. Census Bureau estimates that the median annual earnings for all workers was $41,535; and more specifically estimates that median annual earnings for those who worked full-time, year round, was $87,546.
Affluence refers to an individual's or household's economical and financial advantage in comparison to others. It may be assessed through either income or wealth.
The terms average Joe, ordinary Joe, regular Joe, Joe Sixpack, Joe Lunchbucket, Joe Snuffy, Joe Blow, Joe Schmoe, and ordinary Jane, average Jane, and plain Jane, are used primarily in North America to refer to a completely average person, typically an average American. It can be used both to give the image of a hypothetical "completely average person" or to describe an existing person. Parallel terms in other languages for local equivalents exist worldwide.
In sociology, the upper middle class of the United States is the social group constituted by higher-status members of the middle class in American society. This is in contrast to the term lower middle class, which refers to the group at the opposite end of the middle class scale. There is considerable debate as to how the upper middle class might be defined. According to Max Weber, the upper middle class consists of well-educated professionals with graduate degrees and comfortable incomes.
Educational inequality is the unequal distribution of academic resources, including but not limited to school funding, qualified and experienced teachers, books, and technologies, to socially excluded communities. These communities tend to be historically disadvantaged and oppressed. Individuals belonging to these marginalized groups are often denied access to schools with adequate resources. Inequality leads to major differences in the educational success or efficiency of these individuals and ultimately suppresses social and economic mobility. Inequality in education is broken down into different types: regional inequality, inequality by sex, inequality by social stratification, inequality by parental income, inequality by parent occupation, and many more.
In the United States, despite the efforts of equality proponents, income inequality persists among races and ethnicities. Asian Americans have the highest median income, followed by White Americans, Hispanic Americans, African Americans, and Native Americans. A variety of explanations for these differences have been proposed—such as differing access to education, two parent home family structure, high school dropout rates and experience of discrimination and deep-seated and systemic anti-Black racism—and the topic is highly controversial.
The racial achievement gap in the United States refers to disparities in educational achievement between differing ethnic/racial groups. It manifests itself in a variety of ways: African-American and Hispanic students are more likely to earn lower grades, score lower on standardized tests, drop out of high school, and they are less likely to enter and complete college than whites, while whites score lower than Asian Americans.
Socioeconomic mobility in the United States refers to the upward or downward movement of Americans from one social class or economic level to another, through job changes, inheritance, marriage, connections, tax changes, innovation, illegal activities, hard work, lobbying, luck, health changes or other factors.
Causes of income inequality in the United States describes the reasons for the unequal distribution of income in the US and the factors that cause it to change over time. This topic is subject to extensive ongoing research, media attention, and political interest.
Higher education in the United States is an optional stage of formal learning following secondary education. Higher education, also referred to as post-secondary education, third-stage, third-level, or tertiary education occurs most commonly at one of the 3,899 Title IV degree-granting institutions in the country. These may be public universities, private universities, liberal arts colleges, community colleges, or for-profit colleges. Learning environments vary greatly depending on not only the type of institution, but also the different goals implemented by the relevant county and state.
↑ Note that these add up to more than 100% because they are cumulative; e.g. it is assumed that all people with doctorates also have undergraduate and high school degrees, and are thus counted twice in the "lower" categories. Age 25 is used rather than age 18 because there are few people aged 18 or over with advanced degrees. "Educational Attainment in the United States: 2018". U.S. Census Bureau. Retrieved June 23, 2018. Percentages are calculated based on census data by counting people that had attained that level or higher.
1 2 Kafir, Krista (April 2007). "Taking the Boy Crisis in Education Seriously: How School Choice can Boost Achievement Among Boys and Girls." Independent Women's Forum.
↑ Bourdieu, P. (1977) Cultural Reproduction and Social Reproduction. In: Karabel, J., & Halsey, A. H. (eds.) Power and Ideology in Education. Oxford University Press, New York, pp. 487-511.
This page is based on this Wikipedia article Text is available under the CC BY-SA 4.0 license; additional terms may apply. Images, videos and audio are available under their respective licenses.