This is a list of countries by research and development (R&D) spending in real terms, based on data published by World Bank, United Nations Economic Commission for Europe and the Organisation for Economic Co-operation and Development.
According to World Bank, ″Gross domestic expenditures on research and development (R&D) include both capital and current expenditures in the four main sectors: Business enterprise, Government, Higher education and Private non-profit. R&D covers basic research, applied research, and experimental development.″ [3]
According to United Nations Economic Commission for Europe, ″Research and development (R&D) expenditure as a proportion of Gross Domestic Product (GDP) is defined as the total intramural expenditure on research and experimental development (R&D) performed in the national territory during a specific reference period expressed as a percentage of national gross domestic product (GDP).″ [4]
According to the Organisation for Economic Co-operation and Development, ″Gross domestic spending on R&D is defined as the total expenditure (current and capital) on R&D carried out by all resident companies, research institutes, university and government laboratories, etc., in a country. It includes R&D funded from abroad, but excludes domestic funds for R&D performed outside the domestic economy.″ [2]
The following table provides information on R&D spending, based on data published by World Bank, [5] United Nations Economic Commission for Europe, [6] and the Organisation for Economic Co-operation and Development. [2] The indicator is measured in USD constant prices using 2015 base year and Purchasing Power Parities (PPPs) by OECD and as percentage of GDP.
Sorting is alphabetical by country code, according to ISO 3166-1 alpha-3.
Country/Territory/Region/Group | Population | WB | UNECE | OECD | |||||||
---|---|---|---|---|---|---|---|---|---|---|---|
Source: UN or official state figures | Year | % of GDP | Year | % of GDP | Year | % of GDP | Year | Mil. USD | Year | USD per capita | |
Angola | 34,094,077 | 2023 | 0.03% | 2016 | |||||||
Albania | 2,761,785 | 2023 | 0.15% | 2008 | |||||||
United Arab Emirates | 9,282,410 | 2020 | 1.50% | 2021 | |||||||
Argentina | 46,654,581 | 2023 | 0.52% | 2021 | 0.52% | 2021 | 4288.02 | 2021 | 92 | ||
Armenia | 2,981,200 | 2023 | 0.21% | 2021 | 0.21% | 2021 | |||||
American Samoa | 49,710 | 2020 | 0.40% | 2006 | |||||||
Australia | 26,461,912 | 2023 | 1.83% | 2019 | 1.80% | 2019 | 21738.74 | 2019 | 822 | ||
Austria | 9,159,993 | 2024 | 3.26% | 2021 | 3.19% | 2020 | 3.26% | 2021 | 14885.40 | 2021 | 1,625 |
Azerbaijan | 10,151,517 | 2023 | 0.21% | 2021 | 0.21% | 2021 | |||||
Burundi | 12,837,740 | 2022 | 0.21% | 2018 | |||||||
Belgium | 11,810,018 | 2023 | 3.43% | 2021 | 3.46% | 2020 | 3.43% | 2021 | 19249.36 | 2021 | 1,630 |
Burkina Faso | 22,752,315 | 2023 | 0.25% | 2021 | |||||||
Bulgaria | 6,447,710 | 2022 | 0.77% | 2021 | 0.85% | 2020 | |||||
Bahrain | 1,577,059 | 2023 | 0.10% | 2014 | |||||||
Bosnia and Herzegovina | 3,277,082 | 2022 | 0.19% | 2021 | 0.19% | 2021 | |||||
Belarus | 9,200,617 | 2023 | 0.46% | 2021 | 0.47% | 2021 | |||||
Bermuda | 64,055 | 2021 | 0.23% | 2020 | |||||||
Bolivia | 12,006,031 | 2022 | 0.16% | 2009 | |||||||
Brazil | 203,080,756 | 2022 | 1.15% | 2020 | |||||||
Brunei | 445,400 | 2022 | 0.28% | 2018 | |||||||
Botswana | 2,410,338 | 2021 | 0.56% | 2013 | |||||||
Canada | 40,528,396 | 2023 | 1.70% | 2021 | 1.70% | 2020 | 1.55% | 2022 | 29313.56 | 2022 | 723 |
Switzerland | 8,931,306 | 2023 | 3.36% | 2021 | 3.19% | 2019 | 3.36% | 2021 | 19885.57 | 2021 | 2,227 |
Chile | 19,960,889 | 2023 | 0.33% | 2020 | 0.33% | 2020 | 1377.39 | 2020 | 69 | ||
China | 1,409,670,000 | 2023 | 2.43% | 2021 | 2.43% | 2021 | 620103.38 | 2021 | 440 | ||
Ivory Coast | 29,389,150 | 2021 | 0.07% | 2016 | |||||||
DR Congo | 95,370,000 | 2019 | 0.41% | 2015 | |||||||
Colombia | 52,215,503 | 2023 | 0.29% | 2020 | 0.29% | 2020 | 1835.89 | 2020 | 35 | ||
Cape Verde | 491,233 | 2021 | 0.07% | 2011 | |||||||
Costa Rica | 5,262,225 | 2023 | 0.28% | 2021 | 0.28% | 2021 | 276.19 | 2021 | 52 | ||
Cuba | 11,089,511 | 2022 | 0.52% | 2020 | |||||||
Cyprus | 918,100 | 2021 | 0.83% | 2021 | 0.81% | 2020 | |||||
Czech Republic | 10,882,235 | 2023 | 2.00% | 2021 | 1.99% | 2020 | 2.00% | 2021 | 8007.91 | 2021 | 736 |
Germany | 84,607,016 | 2023 | 3.14% | 2021 | 3.11% | 2020 | 3.13% | 2021 | 129348.45 | 2021 | 1,529 |
Denmark | 5,961,249 | 2024 | 2.81% | 2021 | 2.97% | 2020 | 2.76% | 2021 | 8818.40 | 2021 | 1,479 |
Algeria | 45,400,000 | 2022 | 0.53% | 2017 | |||||||
Ecuador | 16,938,986 | 2022 | 0.44% | 2014 | |||||||
Egypt | 104,462,545 | 2023 | 0.91% | 2021 | |||||||
Spain | 48,592,909 | 2024 | 1.43% | 2021 | 1.41% | 2020 | 1.43% | 2021 | 24006.51 | 2021 | 494 |
Estonia | 1,366,491 | 2024 | 1.75% | 2021 | 1.75% | 2020 | 1.75% | 2021 | 848.70 | 2021 | 621 |
Ethiopia | 107,334,000 | 2023 | 0.27% | 2017 | |||||||
Finland | 5,574,011 | 2023 | 2.99% | 2021 | 2.91% | 2020 | 2.99% | 2021 | 7607.10 | 2021 | 1,365 |
France | 68,373,000 | 2024 | 2.22% | 2021 | 2.35% | 2020 | 2.22% | 2021 | 63751.58 | 2021 | 932 |
Faroe Islands | 54,547 | 2023 | 0.85% | 2003 | |||||||
Gabon | 2,233,272 | 2021 | 0.58% | 2009 | |||||||
United Kingdom | 67,026,292 | 2021 | 2.91% | 2021 | 1.72% | 2019 | 2.91% | 2021 | 83706.92 | 2021 | 1,249 |
Georgia | 3,736,400 | 2023 | 0.25% | 2021 | 0.25% | 2021 | |||||
Ghana | 30,832,019 | 2021 | 0.38% | 2010 | |||||||
Gambia | 2,417,471 | 2022 | 0.07% | 2018 | |||||||
Greece | 10,413,982 | 2023 | 1.46% | 2021 | 1.50% | 2020 | 1.46% | 2021 | 4336.30 | 2021 | 416 |
Greenland | 56,865 | 2023 | 0.65% | 2004 | |||||||
Guatemala | 17,602,431 | 2023 | 0.06% | 2021 | |||||||
Guam | 153,836 | 2020 | 0.26% | 2005 | |||||||
Hong Kong | 7,498,100 | 2023 | 0.97% | 2021 | |||||||
Honduras | 9,745,149 | 2023 | 0.06% | 2019 | |||||||
Croatia | 3,855,641 | 2022 | 1.24% | 2021 | 1.24% | 2020 | |||||
Hungary | 9,597,085 | 2023 | 1.64% | 2021 | 1.59% | 2020 | 1.64% | 2021 | 5219.98 | 2021 | 544 |
Indonesia | 279,118,866 | 2023 | 0.28% | 2020 | |||||||
India | 1,392,329,000 | 2023 | 0.65% | 2020 | 42 | ||||||
Ireland | 5,281,600 | 2023 | 1.13% | 2021 | 1.23% | 2020 | 1.11% | 2021 | 5636.94 | 2021 | 1,067 |
Iran | 84,055,000 | 2022 | 0.79% | 2019 | |||||||
Iraq | 43,324,000 | 2023 | 0.04% | 2021 | |||||||
Iceland | 396,960 | 2023 | 2.81% | 2021 | 2.47% | 2020 | 2.81% | 2021 | 522.67 | 2021 | 1,317 |
Israel | 9,842,000 | 2023 | 5.56% | 2021 | 5.35% | 2020 | 5.56% | 2021 | 21031.65 | 2021 | 2,137 |
Italy | 58,919,345 | 2023 | 1.45% | 2021 | 1.53% | 2020 | 1.45% | 2021 | 33135.88 | 2021 | 562 |
Jamaica | 2,825,544 | 2019 | 0.06% | 2002 | |||||||
Jordan | 11,302,000 | 2022 | 0.70% | 2016 | |||||||
Japan | 124,090,000 | 2024 | 3.30% | 2021 | 3.30% | 2021 | 172062.49 | 2021 | 1,387 | ||
Kazakhstan | 20,033,546 | 2024 | 0.13% | 2021 | 0.13% | 2021 | |||||
Kenya | 51,526,000 | 2023 | 0.69% | 2010 | |||||||
Kyrgyzstan | 7,100,000 | 2023 | 0.08% | 2021 | 0.09% | 2020 | |||||
Cambodia | 17,091,464 | 2023 | 0.12% | 2015 | |||||||
South Korea | 51,439,038 | 2022 | 4.93% | 2021 | 4.93% | 2021 | 110148.08 | 2021 | 2,141 | ||
Kuwait | 4,670,713 | 2020 | 0.19% | 2020 | |||||||
Laos | 7,443,000 | 2022 | 0.04% | 2002 | |||||||
Saint Lucia | 178,696 | 2018 | 0.27% | 1999 | |||||||
Sri Lanka | 22,037,000 | 2023 | 0.12% | 2020 | |||||||
Lesotho | 2,306,000 | 2023 | 0.05% | 2015 | |||||||
Lithuania | 2,886,515 | 2024 | 1.11% | 2021 | 1.15% | 2020 | 1.11% | 2021 | 1146.70 | 2021 | 397 |
Luxembourg | 672,050 | 2023 | 1.04% | 2021 | 1.12% | 2020 | 1.04% | 2021 | 735.37 | 2021 | 1,113 |
Latvia | 1,872,500 | 2024 | 0.74% | 2021 | 0.69% | 2020 | 0.74% | 2021 | 420.07 | 2021 | 224 |
Macau | 681,300 | 2023 | 0.38% | 2021 | |||||||
Morocco | 37,022,000 | 2023 | 0.66% | 2010 | |||||||
Monaco | 39,050 | 2022 | 0.04% | 2005 | |||||||
Moldova | 2,512,758 | 2023 | 0.23% | 2021 | 0.23% | 2021 | |||||
Madagascar | 26,923,353 | 2021 | 0.01% | 2017 | |||||||
Mexico | 129,406,736 | 2023 | 0.30% | 2020 | 0.33% | 2017 | 7673.49 | 2017 | 59 | ||
North Macedonia | 1,832,696 | 2021 | 0.38% | 2021 | 0.38% | 2021 | |||||
Mali | 22,395,489 | 2022 | 0.17% | 2021 | |||||||
Malta | 519,562 | 2021 | 0.67% | 2021 | 0.67% | 2020 | |||||
Myanmar | 55,770,232 | 2022 | 0.15% | 2021 | |||||||
Montenegro | 616,695 | 2023 | 0.36% | 2019 | 0.36% | 2019 | |||||
Mongolia | 3,457,548 | 2022 | 0.13% | 2020 | |||||||
Mozambique | 32,419,747 | 2022 | 0.31% | 2015 | |||||||
Mauritania | 4,475,683 | 2023 | 0.01% | 2018 | |||||||
Mauritius | 1,261,041 | 2023 | 0.37% | 2021 | |||||||
Malaysia | 33,379,500 | 2023 | 0.95% | 2020 | |||||||
Namibia | 2,641,857 | 2023 | 0.35% | 2014 | |||||||
Nigeria | 216,783,381 | 2022 | 0.13% | 2007 | |||||||
Nicaragua | 6,733,763 | 2022 | 0.11% | 2015 | |||||||
Netherlands | 17,947,684 | 2023 | 2.31% | 2021 | 2.30% | 2020 | 2.27% | 2021 | 21650.62 | 2021 | 1,206 |
Norway | 5,550,203 | 2023 | 1.94% | 2021 | 2.28% | 2020 | 1.94% | 2021 | 7008.90 | 2021 | 1,263 |
Nepal | 29,164,578 | 2021 | 0.30% | 2010 | |||||||
New Zealand | 5,305,600 | 2023 | 1.45% | 2021 | 1.47% | 2021 | 3060.20 | 2021 | 577 | ||
Oman | 5,113,071 | 2023 | 0.29% | 2021 | |||||||
Pakistan | 241,499,431 | 2023 | 0.16% | 2021 | |||||||
Panama | 4,337,406 | 2021 | 0.16% | 2021 | |||||||
Peru | 33,396,698 | 2022 | 0.17% | 2020 | |||||||
Philippines | 112,892,781 | 2023 | 0.32% | 2018 | |||||||
Papua New Guinea | 11,781,559 | 2021 | 0.03% | 2016 | |||||||
Poland | 37,653,000 | 2023 | 1.44% | 2021 | 1.39% | 2020 | 1.43% | 2021 | 18309.58 | 2021 | 486 |
Puerto Rico | 3,205,691 | 2023 | 0.43% | 2015 | |||||||
Portugal | 10,467,366 | 2022 | 1.68% | 2021 | 1.61% | 2020 | 1.73% | 2022 | 6110.54 | 2022 | 584 |
Paraguay | 6,109,644 | 2022 | 0.16% | 2020 | |||||||
Palestine | 5,483,450 | 2023 | 0.45% | 2013 | |||||||
Qatar | 2,656,032 | 2023 | 0.68% | 2021 | |||||||
Romania | 19,051,562 | 2023 | 0.47% | 2021 | 0.47% | 2020 | 0.47% | 2021 | 2531.10 | 2021 | 133 |
Russia | 146,424,729 | 2023 | 1.09% | 2020 | 1.09% | 2020 | 1.10% | 2020 | 40322.30 | 2020 | 275 |
Rwanda | 13,246,394 | 2022 | 0.76% | 2019 | |||||||
Saudi Arabia | 32,175,224 | 2022 | 0.45% | 2021 | |||||||
Sudan | 41,984,500 | 2018 | 0.22% | 2005 | |||||||
Senegal | 18,275,743 | 2023 | 0.58% | 2015 | |||||||
Singapore | 5,917,600 | 2023 | 2.16% | 2020 | 2.22% | 2020 | 11435.91 | 2020 | 1,933 | ||
El Salvador | 6,884,888 | 2022 | 0.16% | 2020 | |||||||
Serbia | 6,641,197 | 2023 | 0.99% | 2021 | 0.99% | 2021 | |||||
Slovakia | 5,426,468 | 2023 | 0.92% | 2021 | 0.90% | 2020 | 0.92% | 2021 | 1692.63 | 2021 | 312 |
Slovenia | 2,123,103 | 2023 | 2.13% | 2021 | 2.14% | 2020 | 2.13% | 2021 | 1683.49 | 2021 | 793 |
Sweden | 10,551,707 | 2023 | 3.42% | 2021 | 3.49% | 2020 | 3.40% | 2021 | 18504.33 | 2021 | 1,754 |
Eswatini | 1,223,362 | 2023 | 0.27% | 2015 | |||||||
Seychelles | 100,447 | 2022 | 0.22% | 2016 | |||||||
Syria | 22,923,000 | 2021 | 0.02% | 2015 | |||||||
Chad | 17,414,717 | 2022 | 0.30% | 2016 | |||||||
Togo | 8,095,498 | 2022 | 0.20% | 2014 | |||||||
Thailand | 68,263,022 | 2021 | 1.33% | 2020 | |||||||
Tajikistan | 10,077,600 | 2023 | 0.09% | 2020 | 0.09% | 2020 | |||||
Trinidad and Tobago | 1,367,510 | 2023 | 0.06% | 2020 | |||||||
Tunisia | 11,850,232 | 2023 | 0.75% | 2019 | |||||||
Turkey | 85,372,377 | 2023 | 1.40% | 2021 | 1.09% | 2020 | 1.40% | 2021 | 37144.00 | 2021 | 435 |
Taiwan | 23,420,442 | 2023 | 3.77% | 2021 | 51229.88 | 2021 | 2,187 | ||||
Tanzania | 61,741,120 | 2022 | 0.51% | 2013 | |||||||
Uganda | 45,562,000 | 2023 | 0.14% | 2014 | |||||||
Ukraine | 36,700,000 | 2023 | 0.29% | 2021 | 0.29% | 2021 | |||||
Uruguay | 3,444,263 | 2023 | 0.45% | 2020 | |||||||
United States | 335,893,238 | 2024 | 3.46% | 2021 | 3.42% | 2020 | 3.46% | 2021 | 709712.90 | 2021 | 2,113 |
Uzbekistan | 36,599,764 | 2023 | 0.13% | 2021 | 0.13% | 2021 | |||||
Saint Vincent and the Grenadines | 110,872 | 2022 | 0.11% | 2002 | |||||||
Venezuela | 28,302,000 | 2019 | 0.34% | 2014 | |||||||
U.S. Virgin Islands | 87,146 | 2020 | 0.03% | 2007 | |||||||
Vietnam | 100,300,000 | 2023 | 0.43% | 2021 | |||||||
South Africa | 62,027,503 | 2022 | 0.60% | 2020 | 0.60% | 2020 | 4457.37 | 2020 | 72 | ||
Zambia | 19,610,769 | 2022 | 0.28% | 2008 | |||||||
WORLD | 8,091,885,000 | 2024 | 2.71% | 2021 | |||||||
Low & middle income (WB) | 1.64% | 2020 | |||||||||
Low-income (WB) | |||||||||||
Middle-income (WB) | 1.64% | 2020 | |||||||||
Lower middle income (WB) | 0.58% | 2017 | |||||||||
Upper middle income (WB) | 2.24% | 2021 | |||||||||
High-income (WB) | 2.94% | 2021 | |||||||||
European Union | 447,319,916 | 2020 | 2.28% | 2021 | 2.16% | 2021 | 400168.50 | 2021 | 895 | ||
OECD (Organisation for Economic Cooperation and Development) | 1,376,606,820 | 2022 | 3.01% | 2021 | 2.72% | 2021 | 1618857.48 | 2021 | 1,176 |
The economy of Canada is a highly developed mixed economy, with the world's tenth-largest economy as of 2023, and a nominal GDP of approximately US$2.117 trillion. Canada is one of the world's largest trading nations, with a highly globalized economy. In 2021, Canadian trade in goods and services reached $2.016 trillion. Canada's exports totalled over $637 billion, while its imported goods were worth over $631 billion, of which approximately $391 billion originated from the United States. In 2018, Canada had a trade deficit in goods of $22 billion and a trade deficit in services of $25 billion. The Toronto Stock Exchange is the tenth-largest stock exchange in the world by market capitalization, listing over 1,500 companies with a combined market capitalization of over US$3 trillion.
Gross Domestic Product (GDP) is a monetary measure of the market value of all the final goods and services produced and rendered in a specific time period by a country or countries. GDP is more often used by the government of a single country to measure its economic health. Due to its complex and subjective nature, this measure is often revised before being considered a reliable indicator.
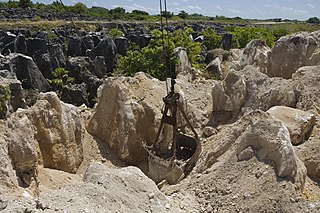
The economy of Nauru is tiny, based on a population in 2019 of only 11,550 people. The economy has historically been based on phosphate mining. With primary phosphate reserves exhausted by the end of the 2010s, Nauru has sought to diversify its sources of income. In 2020, Nauru's main sources of income were the sale of fishing rights in Nauru's territorial waters, and revenue from the Regional Processing Centre.
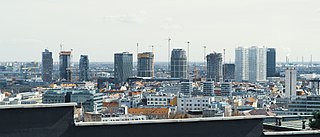
The economy of Slovakia is based upon Slovakia becoming an EU member state in 2004, and adopting the euro at the beginning of 2009. Its capital, Bratislava, is the largest financial centre in Slovakia. As of Q1 2018, the unemployment rate was 5.72%.
The economy of the Gambia is heavily reliant on agriculture. The Gambia has no significant mineral or other natural resources, and has a limited agricultural base. About 75% of the population depends on crops and livestock for its livelihood. Small-scale manufacturing activity features the processing of peanuts, fish, and animal hides.
The world economy or global economy is the economy of all humans in the world, referring to the global economic system, which includes all economic activities conducted both within and between nations, including production, consumption, economic management, work in general, financial transactions and trade of goods and services. In some contexts, the two terms are distinct: the "international" or "global economy" is measured separately and distinguished from national economies, while the "world economy" is simply an aggregate of the separate countries' measurements. Beyond the minimum standard concerning value in production, use and exchange, the definitions, representations, models and valuations of the world economy vary widely. It is inseparable from the geography and ecology of planet Earth.
Research and development is the set of innovative activities undertaken by corporations or governments in developing new services or products, and improving existing ones. Research and development constitutes the first stage of development of a potential new service or the production process.
Income in India discusses the financial state in India. With rising economic growth and prosperity, India's income is also rising rapidly. As an overview, India's per capita net national income or NNI was around Rs. 98,374 in 2022-23. The per-capita income is a crude indicator of the prosperity of a country. In contrast, the gross national income at constant prices stood at over 128 trillion rupees. The same year, GRI growth rate at constant prices was around 6.6 percent. While GNI and NNI are both indicators for a country's economic performance and welfare, the GNI is related to the GDP or the Gross Domestic Product plus the net receipts from abroad, including wages and salaries, property income, net taxes and subsidies receivable from abroad. On the other hand, the NNI of a country is equal to its GNI net of depreciation.
Research and development intensity is generally defined as expenditures by a firm on its research and development (R&D) divided by the firm's sales. There are two types of R&D intensity: direct and indirect. R&D intensity varies, in general, according to a firm's industry sector, product knowledge, manufacturing, and technology, and is a metric that can be used to gauge the level of a company's investment to spur innovation in and through basic and applied research. A further aim of R&D spending, ultimately, is to increase productivity as well as an organization's salable output.
This is a comparison between Indian states and countries by gross domestic product (PPP). Many of the states of India have large GDP which would rank highly on a list of countries by GDP.
This article includes a list of China's historical gross domestic product (GDP) values, the market value of all final goods and services produced by a nation in a given year. The GDP dollar estimates presented here are either calculated at market or government official exchange rates (nominal), or derived from purchasing power parity (PPP) calculations. This article also includes historical GDP growth.
System of Environmental-Economic Accounting (SEEA) is a framework to compile statistics linking environmental statistics to economic statistics. SEEA is described as a satellite system to the United Nations System of National Accounts (SNA). This means that the definitions, guidelines and practical approaches of the SNA are applied to the SEEA. This system enables environmental statistics to be compared to economic statistics as the system boundaries are the same after some processing of the input statistics. By analysing statistics on the economy and the environment at the same time it is possible to show different patterns of sustainability for production and consumption. It can also show the economic consequences of maintaining a certain environmental standard.
International comparisons, or national evaluation indicators, focuses on the quantitative, qualitative, and evaluative analysis of one country in relation to others. Often, the objective is to compare one country's performance to others in order to assess what countries have achieved, what needs to change in order for them to perform better, or a country's progress in reaching certain objectives.
Sustainable Development Goal 9 is about "industry, innovation and infrastructure" and is one of the 17 Sustainable Development Goals adopted by the United Nations General Assembly in 2015. SDG 9 aims to build resilient infrastructure, promote sustainable industrialization and foster innovation.
Sustainable Development Goal 8 is about "decent work and economic growth" and is one of the 17 Sustainable Development Goals which were established by the United Nations General Assembly in 2015. The full title is to "Foster sustained, inclusive and sustainable economic growth, full and productive employment and decent work for all." Progress towards targets will be measured, monitored and evaluated by 17 indicators.
Sustainable Development Goal 1, one of the 17 Sustainable Development Goals established by the United Nations in 2015, calls for the end of poverty in all forms. The official wording is: "No Poverty". Member countries have pledged to "Leave No One Behind": underlying the goal is a "powerful commitment to leave no one behind and to reach those farthest behind first".
This article includes 2 lists of countries of the world and their total expenditure on health as a percent of gross domestic product (GDP). Total expenditure includes both public and private expenditures. See also: List of countries by total health expenditure per capita.