Meteorological history of Hurricane Patricia

Last updated

With maximum sustained winds of 215 mph (345 km/h) and a minimum pressure of 872 mbar (hPa; 25.75 inHg), Hurricane Patricia is the second-most intense tropical cyclone ever observed, just shy of Typhoon Tip in 1979 which had a minimum pressure of 870 mbar (hPa; 25.69 inHg). It is also the strongest tropical cyclone ever recorded in the Western Hemisphere. [2] It exceeded the previous sustained wind record of 190 mph (305 km/h) set by Hurricane Allen in 1980 and the pressure record of 882 mbar (hPa; 26.05 inHg) set by Hurricane Wilma in 2005, both in the Atlantic basin. [40] In the Eastern Pacific basin, north of the equator and east of the International Date Line, the previous basin record-holder was Hurricane Linda in 1997 with winds of 185 mph (300 km/h) and a pressure of 902 mbar (hPa; 26.64 inHg). [23] Reconnaissance also found a pressure gradient of 24 mbar (hPa; 0.709 inHg) per nautical mile early on October 23, among the steepest gradients ever observed in a tropical cyclone. [2]

Comparison of Dvorak-enhanced (BD curve) infrared imagery of Hurricanes Linda (left) and Patricia (right). The "cold dark gray" ring around Patricia's eye represents cloud tops of -81 degC (-114 degF) or colder, more intense than the "cold medium gray" ring surrounding Linda's eye. Hurricanes Linda and Patricia Dvorak comparison.png
Comparison of Dvorak-enhanced (BD curve) infrared imagery of Hurricanes Linda (left) and Patricia (right). The "cold dark gray" ring around Patricia's eye represents cloud tops of −81 °C (−114 °F) or colder, more intense than the "cold medium gray" ring surrounding Linda's eye.

On a global scale, Patricia's one-minute maximum sustained winds rank as the highest ever reliably observed or estimated globally in a tropical cyclone, surpassing Typhoon Haiyan of 2013, although the intensity of Haiyan was only estimated via satellite imagery (T8.0, the highest rating on the Dvorak scale). Since no aircraft reconnaissance was available for Haiyan, the record set by Patricia is uncertain and comparing the intensities of the two storms is problematic. [42] According to the World Meteorological Organization, Typhoon Nancy of 1961 also produced 215 mph (345 km/h) sustained winds; however, it is widely accepted that Western Pacific reconnaissance during the 1940s to 1960s overestimated cyclone intensity and Nancy's record is considered questionable. [43] [44] The most powerful wind gust produced by a tropical cyclone, as well as the highest non-tornadic winds ever recorded, is still retained by Cyclone Olivia in 1996: 253 mph (407 km/h) was observed on Barrow Island, Western Australia. [45]

The magnitude of Patricia's rapid intensification is among the fastest ever observed. In a 24-hour period, 06:00–06:00 UTC October 22–23, its maximum sustained winds increased from 85 mph (140 km/h) to 205 mph (335 km/h). This represents a record increase of 120 mph (195 km/h). During the same period, Patricia's central pressure fell by 95 mbar (hPa; 2.81 inHg). [2] This fell just short of the world-record intensification set by Typhoon Forrest in 1983, which featured a pressure drop of 100 mbar (hPa; 2.953 inHg) in just under 24 hours. [46] With a pressure of 932 mbar (hPa; 27.52 inHg), Patricia is the strongest landfalling Pacific hurricane on record. The previous record was 941 mbar (hPa; 27.79 inHg) set by Hurricane Odile in 2014. However, this was broken by Hurricane Otis's 929 mbar (hPa; 27.43 inHg). Similarly, the hurricane featured the fastest weakening while still over water in NHC's area of responsibility, with a pressure rise of 54 mbar (hPa; 1.59 inHg) in the five hours before it made landfall. Furthermore, a dropsonde observed a 700 mbar height temperature of 32.2 °C (90.0 °F) in the eye of Patricia. This is one of the highest temperatures ever observed in a tropical cyclone's eye worldwide. [2]

See also

Other record-strength tropical cyclones:

  • Hurricane Linda in 1997  – Previous record intensity in eastern Pacific basin, during a similarly strong El Niño event
  • Typhoon Megi in 2010  – Research reconnaissance observed similarly intense sustained winds
  • Typhoon Goni in 2020  – Strongest landfalling tropical cyclone by 1-minute sustained winds
  • Typhoon Nancy in 1961  – Tied with Patricia for the highest winds observed in a tropical cyclone, considered unreliable
  • Typhoon Tip in 1979  – Most intense tropical cyclone recorded in terms of pressure
  • Hurricane Wilma in 2005  – Previous record low central pressure in the Western Hemisphere, still record low for the Atlantic
  • Hurricane Allen in 1980  – Previous record high sustained winds in the Western Hemisphere, still record high for the Atlantic
  • Typhoon Forrest in 1983  – Record-fastest intensification of any tropical cyclone; underwent a 100 mbar (hPa; 2.953 inHg) pressure drop in just under 24 hours

Notes

  1. These sea surface temperatures were at record levels for mid-October in the region and were largely undisturbed since Hurricane Carlos in June. [2]
  2. Post-storm reanalysis concluded that Patricia's peak intensity occurred between the reconnaissance flights, and thus the actual minimum pressure at peak intensity was estimated at 872 mbar (hPa; 25.75 inHg). However, this measured value of 879 mbar (hPa; 25.96 inHg)—extrapolated from a direct observation of 883 mbar (hPa; 26.07 inHg) with surface winds of 52 mph (84 km/h)—remains the lowest directly-measured central pressure in a Western Hemisphere tropical cyclone. [2]
  3. The maximum SFMR winds for the 06:00 UTC mission were operationally withheld for quality assurance and later determined to be accurate. [2]
  4. This pressure value was extrapolated from an observation of 885 mbar (hPa; 26.13 inHg) with surface winds of 66 mph (106 km/h). [2]
  5. The landfall pressure is based upon several observations in the hurricane's eye and has an error margin of ± 2–3 mbar (hPa; 0.06–0.09 inHg). [2]

Related Research Articles

<span class="mw-page-title-main">Timeline of the 2005 Atlantic hurricane season</span>

The 2005 Atlantic hurricane season was an event in the annual tropical cyclone season in the north Atlantic Ocean. It was the second most active Atlantic hurricane season in recorded history, and the most extreme in the satellite era. Officially, the season began on June 1, 2005 and ended on November 30, 2005. These dates, adopted by convention, historically delimit the period in each year when most tropical systems form. The season's first storm, Tropical Storm Arlene, developed on June 8. The final storm, Tropical Storm Zeta, formed in late December and persisted until January 6, 2006. Zeta is only the second December Atlantic storm in recorded history to survive into January, joining Hurricane Alice in 1955.

<span class="mw-page-title-main">Timeline of the 2008 Atlantic hurricane season</span>

The 2008 Atlantic hurricane season was an event in the annual tropical cyclone season in the north Atlantic Ocean. An above-average Atlantic hurricane season season, it was the first on record to have a major hurricane in every month from July to November.

<span class="mw-page-title-main">Timeline of the 1995 Atlantic hurricane season</span>

The 1995 Atlantic hurricane season was an event in the annual tropical cyclone season in the north Atlantic Ocean. This Atlantic hurricane season saw a near-record number of named tropical storms. This extremely active season followed four consecutive years in which there was below normal activity. The season officially began on June 1, 1995 and ended on November 30, 1995. These dates, adopted by convention, historically describe the period in each year when most tropical systems form. The season's first system, Hurricane Allison, developed on June 3; its last, Hurricane Tanya, became extratropical on November 2.

<span class="mw-page-title-main">Timeline of the 2001 Atlantic hurricane season</span>

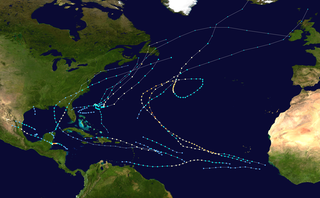
The 2001 Atlantic hurricane season was an above-average Atlantic hurricane season in which fifteen named storms formed. The season officially began on June 1 and ended on November 30, dates that conventionally delimit the period of each year when most tropical cyclones form in the Atlantic basin. The season's first tropical cyclone, Tropical Storm Allison, formed on June 5 while the season's final system, Hurricane Olga, dissipated on December 6.

<span class="mw-page-title-main">Timeline of the 2009 Atlantic hurricane season</span>

The 2009 Atlantic hurricane season was an event in the annual tropical cyclone season in the North Atlantic Ocean. It was a below-average Atlantic hurricane season with nine named storms, the fewest since the 1997 season. The season officially began on June 1, 2009, and ended on November 30, 2009, dates that conventionally delimit the period of each year when most tropical cyclones develop in the Atlantic basin. The first storm to form was Tropical Depression One on May 28, 2009, while the last storm, Hurricane Ida, dissipated on November 10.

<span class="mw-page-title-main">Timeline of the 2000 Atlantic hurricane season</span>

The 2000 Atlantic hurricane season was an event in the annual tropical cyclone season in the north Atlantic Ocean. There was above-normal activity during the season, with nearly all its activity occurring during a three-month period, August–October. The season officially began on June 1, 2000 and ended on November 30, 2000. These dates, adopted by convention, historically describe the period in each year when most tropical systems form. Although two tropical depressions formed in June, the first named storm, Alberto, did not arise until August 4. The season's final storm, an unnamed subtropical storm, became extratropical on October 29.

<span class="mw-page-title-main">Timeline of the 2002 Atlantic hurricane season</span>

The 2002 Atlantic hurricane season was an average Atlantic hurricane season in which twelve named storms formed. Although Tropical Storm Arthur formed on July 14, the season officially began on June 1 and ended on November 30, dates that conventionally delimit the period of each year when most tropical cyclones develop in the Atlantic basin. The season's final storm, Tropical Depression Fourteen, dissipated on October 16.

<span class="mw-page-title-main">2015 Pacific hurricane season</span>

The 2015 Pacific hurricane season is the second-most active Pacific hurricane season on record, with 26 named storms, only behind the 1992 season. A record-tying 16 of those storms became hurricanes, and a record 11 storms further intensified into major hurricanes throughout the season. The Central Pacific, the portion of the Northeast Pacific Ocean between the International Date Line and the 140th meridian west, had its most active year on record, with 16 tropical cyclones forming in or entering the basin. Moreover, the season was the third-most active season in terms of accumulated cyclone energy, amassing a total of 290 units. The season officially started on May 15 in the Eastern Pacific and on June 1 in the Central Pacific; they both ended on November 30. These dates conventionally delimit the period of each year when most tropical cyclones form in the Northeast Pacific basin. However, the formation of tropical cyclones is possible at any time of the year. This was shown when a tropical depression formed on December 31. The above-average activity during the season was attributed in part to the very strong 2014–2016 El Niño event.

<span class="mw-page-title-main">Timeline of the 2010 Pacific hurricane season</span>

The 2010 Pacific hurricane season was one of the least active seasons on record, featuring the fewest named storms since 1977. The season officially started on May 15 in the eastern Pacific—east of 140°W—and on June 1 in the central Pacific—between the International Date Line and 140°W—and lasted until November 30. These dates typically cover the period of each year when most tropical cyclones form in the eastern Pacific basin. The season's first storm, Tropical Storm Agatha, developed on May 29; the season's final storm, Tropical Storm Omeka, degenerated on December 21.

<span class="mw-page-title-main">Timeline of the 1990 Atlantic hurricane season</span>

The 1990 Atlantic hurricane season featured the most named storms of any hurricane season at the time. During the season, 14 tropical cyclones in the Atlantic Ocean became named storms. The season officially started on June 1, 1990, and ended on November 30. These dates, adopted by the convention, historically delimit the period each year when most Atlantic tropical systems form. However, storm formation is possible at any time of the year, as was the case this season, when Tropical Depression One formed on May 24; Hurricane Nana, the season's final storm, dissipated on October 21.

<span class="mw-page-title-main">Timeline of the 2011 Atlantic hurricane season</span>

The 2011 Atlantic hurricane season was an event in the annual hurricane season in the north Atlantic Ocean. It was well above average, with 19 tropical storms forming. Even so, it was the first season on record in which the first eight storms failed to attain hurricane strength. The season officially began on June 1, 2011, and ended on November 30, 2011, dates that conventionally delimit the period of each year when most tropical cyclones develop in the Atlantic basin. The season's first storm, Tropical Storm Arlene did not form until June 28. The final storm to develop, Tropical Storm Sean, dissipated on November 11.

<span class="mw-page-title-main">Timeline of the 2012 Atlantic hurricane season</span>

The 2012 Atlantic hurricane season was an event in the annual hurricane season in the north Atlantic Ocean. For the third year in a row there were 19 named storms. The season officially began on June 1, 2012, and ended on November 30, 2012, dates that conventionally delimit the period of each year when most tropical cyclones develop in the Atlantic basin. Surprisingly, two preseason storms formed: Alberto on May 19, and Beryl on May 26. This was the first such occurrence since the 1951 season. The final storm to dissipate was Sandy, on October 29. Altogether, ten storms became hurricanes, of which two intensified into major hurricanes.

<span class="mw-page-title-main">Timeline of the 2015 Atlantic hurricane season</span>

The 2015 Atlantic hurricane season was an event in the annual hurricane season in the north Atlantic ocean.(there were 15 different recorded hurricanes this year). It was the third consecutive year to feature below-average tropical cyclone activity, with eleven named storms. The season officially began on June 1, 2015 and ended on November 30, 2015. These dates, adopted by convention, historically describe the period in each year when most tropical systems form. However, systems can and do form outside these dates, as did the season's first storm, Tropical Storm Ana, which developed on May 8; the season's final storm, Hurricane Kate, lost its tropical characteristics on November 11.

<span class="mw-page-title-main">Timeline of the 2015 Pacific hurricane season</span>

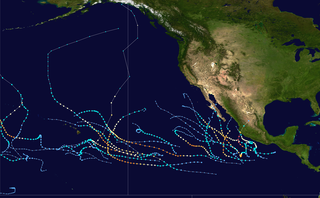
The 2015 Pacific hurricane season was the second-most active Pacific hurricane season on record, and featured the strongest tropical cyclone ever observed in the Western Hemisphere: Hurricane Patricia. The season officially started on May 15 in the Eastern Pacific—east of 140°W—and on June 1 in the Central Pacific—between the International Date Line and 140°W—and ended on November 30. These dates typically cover the period of each year when most tropical cyclones form in the Northeastern Pacific tropical cyclone basin. The season's first storm, Hurricane Andres, developed on May 28; the season's final storm, Tropical Depression Nine-C, dissipated on December 31, well after the official end of the season.

<span class="mw-page-title-main">Meteorological history of Hurricane Dennis</span>

The meteorological history of Hurricane Dennis spanned twenty-two days, beginning with its inception as a tropical wave over Africa on June 26, 2005, and terminating with its dissipation on July 18 over the Great Lakes of North America. The incipient wave that became Dennis emerged over the Atlantic Ocean on June 29 and moved briskly to the west. Dry air initially inhibited development, though once this abated the wave was able to consolidate into a tropical depression on July 4. The depression soon crossed Grenada before entering the Caribbean whereupon increasingly favorable environmental factors, such as low wind shear and high sea surface temperatures, fueled intensification. Turning west-northwest, the system achieved tropical storm status on July 5 and hurricane status the following day.

<span class="mw-page-title-main">Timeline of the 2016 Pacific hurricane season</span> Hurricane season timeline

The 2016 Pacific hurricane season was an event in the annual cycle of tropical cyclone formation, in which tropical cyclones form in the eastern Pacific Ocean. The season officially started on May 15 in the eastern Pacific–east of 140°W–and on June 1 in the central Pacific–between the International Date Line and 140°W–and ended on November 30. These dates typically cover the period of each year when most tropical cyclones form in the eastern Pacific basin. However the first storm, Pali, formed 5 months before the official start of the season on January 7, which broke the record for having the earliest forming storm within the basin.

<span class="mw-page-title-main">Timeline of the 2016 Atlantic hurricane season</span>

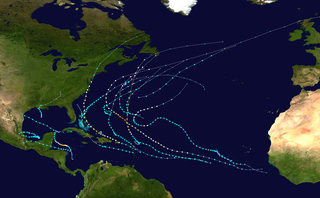
The 2016 Atlantic hurricane season was an event in the annual tropical cyclone season in the north Atlantic Ocean. It was the costliest, as well as the first above-average, Atlantic hurricane season since the 2012 season. It featured the highest number of deaths since the 2008 season and also yielded the highest number of named storm landfalls on the United States since that year. The season officially began on June 1 and concluded on November 30, dates which conventionally delimit the period during each year when a majority of tropical cyclones form in the Atlantic Ocean. The season's first cyclone, Alex, developed on January 12, while the final storm of the season, Otto, closed-out the season by exiting into the Eastern Pacific on November 25, becoming the first Atlantic–Pacific crossover hurricane since Hurricane Cesar–Douglas in 1996.

<span class="mw-page-title-main">Meteorological history of Hurricane Matthew</span>

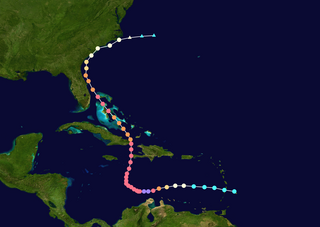
Hurricane Matthew was the first Category 5 Atlantic hurricane since Felix in 2007 and the southernmost Category 5 Atlantic hurricane on record. The system originated from a tropical wave that emerged off the west coast of Africa on September 22, and ultimately dissipated as an extratropical cyclone near Atlantic Canada on October 10. Late on September 29, it began a period of explosive intensification that brought it to Category 5 strength early on October 1. It weakened slightly and remained a Category 4 until its landfalls in Haiti and Cuba, afterwards it traversed through the Bahamas and paralleled the coast of Florida until making landfall in South Carolina as a Category 1 hurricane. Matthew later transitioned into a post-tropical cyclone on October 10.

<span class="mw-page-title-main">Timeline of the 2018 Atlantic hurricane season</span>

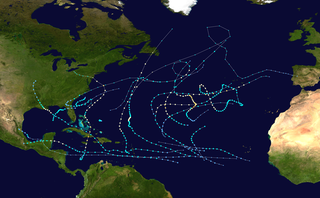
The 2018 Atlantic hurricane season was an event in the annual hurricane season in the north Atlantic Ocean. It was an above-average season for tropical cyclones for the third consecutive year. Though the season officially began on June 1, 2018 and ended November 30, 2018, dates adopted by convention and historically describe the period during each year when most tropical cyclones form, it effectively started with the formation of Tropical Storm Alberto on May 25. The season's final storm, Hurricane Oscar, dissipated on October 31.

References

  1. "World Meteorological Organization retires storm names Erika, Joaquin and Patricia" (Press release). National Oceanic and Atmospheric Administration. April 25, 2016. Archived from the original on June 1, 2016. Retrieved April 26, 2016.
  2. 1 2 3 4 5 6 7 8 9 10 11 12 13 14 15 16 17 18 19 20 21 22 23 24 25 26 27 28 29 30 31 32 33 34 35 36 37 38 39 40 41 42 43 44 45 Todd B. Kimberlain; Eric S. Blake & John P. Cangialosi (February 1, 2016). Hurricane Patricia (PDF) (Report). Tropical Cyclone Report. Miami, Florida: National Hurricane Center . Retrieved February 5, 2016.
  3. 1 2 Lance F. Bosart; Philippe P. Papin; Andrew S. Levine & A. M. Bentley (April 19, 2016). "The Influence of a Precursor Central American Gyre and a Northerly Surge into the Gulf of Tehuantepec on the Formation of Hurricane Patricia in October 2015". 32nd Conference on Hurricanes and Tropical Meteorology. Vol. 2016. American Meteorological Society. pp. A54F–07. Bibcode:2016AGUFM.A54F..07B. Archived from the original on April 28, 2016. Retrieved April 21, 2016.{{cite book}}: |journal= ignored (help)
  4. Philippe P. Papin; Kyle S. Griffin; Lance F. Bosart & Ryan D. Torn (2013). "A Climatology of Central American Gyres" (PDF). University of Albany. Archived (PDF) from the original on May 9, 2016. Retrieved April 21, 2016.
  5. Todd B. Kimberlain (October 17, 2015). Tropical Weather Outlook (.TXT) (Report). Miami, Florida: National Hurricane Center. Archived from the original on March 4, 2016. Retrieved February 5, 2016.
  6. Philip J. Klotzbach (January 15, 2010). "On the Madden–Julian Oscillation–Atlantic Hurricane Relationship" (PDF). Journal of Climate . 23 (2). American Meteorological Society: 282–293. Bibcode:2010JCli...23..282K. doi:10.1175/2009JCLI2978.1. Archived (PDF) from the original on November 1, 2012. Retrieved February 5, 2016.
  7. Todd B. Kimberlain (October 18, 2015). Tropical Weather Outlook (.TXT) (Report). Miami, Florida: National Hurricane Center. Archived from the original on March 4, 2016. Retrieved February 5, 2016.
  8. Todd B. Kimberlain (October 19, 2015). Tropical Weather Outlook (.TXT) (Report). Miami, Florida: National Hurricane Center. Archived from the original on November 23, 2015. Retrieved February 5, 2016.
  9. Dave Roberts (October 19, 2015). Tropical Weather Outlook (.TXT) (Report). Miami, Florida: National Hurricane Center. Archived from the original on March 4, 2016. Retrieved February 5, 2016.
  10. Richard J. Pasch (October 21, 2015). Tropical Storm Patricia Discussion Number 4 (Report). Miami, Florida: National Hurricane Center. Archived from the original on April 28, 2016. Retrieved February 5, 2016.
  11. Jack L. Beven (October 21, 2015). Tropical Storm Patricia Discussion Number 5 (Report). Miami, Florida: National Hurricane Center. Archived from the original on April 28, 2016. Retrieved February 5, 2016.
  12. 1 2 Todd B. Kimberlain (October 20, 2015). Tropical Depression Twenty-E Discussion Number 1 (Report). Miami, Florida: National Hurricane Center. Archived from the original on April 28, 2016. Retrieved April 15, 2016.
  13. Richard J. Pasch (October 22, 2015). Hurricane Patricia Discussion Number 8 (Report). Miami, Florida: National Hurricane Center. Archived from the original on April 28, 2016. Retrieved February 5, 2016.
  14. 1 2 Stacy R. Stewart (October 22, 2015). Tropical Storm Patricia Discussion Number 7 (Report). Miami, Florida: National Hurricane Center. Archived from the original on April 28, 2016. Retrieved April 15, 2016.
  15. 1 2 Michael J. Brennan (October 22, 2015). Hurricane Patricia Discussion Number 11 (Report). Miami, Florida: National Hurricane Center. Archived from the original on April 28, 2016. Retrieved April 15, 2016.
  16. Eric S. Blake (October 23, 2015). Hurricane Patricia Discussion Number 12 (Report). Miami, Florida: National Hurricane Center. Archived from the original on April 28, 2016. Retrieved April 15, 2016.
  17. Eric S. Blake (October 23, 2015). Hurricane Patricia Intermediate Advisory Number 11a (Report). Miami, Florida: National Hurricane Center. Archived from the original on March 20, 2016. Retrieved April 24, 2016.
  18. Scott Stripling (October 22, 2015). Tropical Weather Discussion (Report). Miami, Florida: National Hurricane Center. Archived from the original on July 14, 2017. Retrieved May 12, 2018.
  19. 1 2 Josh Morgerman (November 2, 2015). iCyclone Chase Report: Hurricane Patricia (PDF) (Report). iCyclone. Archived (PDF) from the original on December 8, 2015. Retrieved November 2, 2015.
  20. Scott Sistek (October 25, 2015). "Watch: 'Most intense turbulence' as NOAA flies through Hurricane Patricia". KOMO-TV . American Broadcasting Company. Archived from the original on February 5, 2016. Retrieved December 29, 2015.
  21. Jack L. Beven (October 23, 2015). Hurricane Patricia Discussion Number 16 (Report). Miami, Florida: National Hurricane Center. Archived from the original on April 28, 2016. Retrieved October 24, 2015.
  22. Patricia Tocó Tierra en Costa de Jalisco (PDF) (Report) (in Spanish). Comisión Nacional de Agua. October 24, 2015. Archived from the original (PDF) on December 8, 2015. Retrieved October 26, 2015.
  23. 1 2 National Hurricane Center; Hurricane Research Division; Central Pacific Hurricane Center (April 26, 2024). "The Northeast and North Central Pacific hurricane database 1949–2023". United States National Oceanic and Atmospheric Administration's National Weather Service. Archived from the original on May 29, 2024. A guide on how to read the database is available here. PD-icon.svg This article incorporates text from this source, which is in the public domain.
  24. Josh Morgerman (October 27, 2014). "Great Mexico Hurricane of 1959: Reanalyzing a Monster". iCyclone. Archived from the original on April 28, 2016. Retrieved October 24, 2015.
  25. Eric S. Blake & Stacy R. Stewart (October 23, 2015). "Hurricane Patricia Tropical Cyclone Update". Miami, Florida: National Hurricane Center. Archived from the original on April 28, 2016. Retrieved October 24, 2015.
  26. "7 Day Observations from Data Collection Platform (DCP) CCXJ1". National Weather Service. October 23, 2015. Archived from the original on February 5, 2016. Retrieved October 29, 2015.
  27. Eric S. Blake & Stacy R. Stewart (October 24, 2015). Hurricane Patricia Discussion Number 17 (Report). Miami, Florida: National Hurricane Center. Archived from the original on April 28, 2016. Retrieved February 8, 2016.
  28. John P. Cangialosi & Stacy R. Stewart (October 24, 2015). Hurricane Patricia Discussion Number 18 (Report). Miami, Florida: National Hurricane Center. Archived from the original on April 28, 2016. Retrieved February 8, 2016.
  29. Jack L. Beven (October 24, 2015). Tropical Depression Patricia Discussion Number 19 (Report). Miami, Florida: National Hurricane Center. Archived from the original on April 28, 2016. Retrieved February 8, 2016.
  30. Jeff Masters & Bob Henson (October 24, 2015). "Patricia's Remnants to Fuel Dangerous Rains in Texas". Weather Underground. Archived from the original on October 25, 2015. Retrieved October 25, 2015.
  31. Amanda K. Fanning (October 24, 2015). Storm Summary Number 10 for Southern Plains Heavy Rainfall (Report). College Park, Maryland: Weather Prediction Center. Archived from the original on June 7, 2017. Retrieved October 26, 2015.
  32. Amanda K. Fanning (October 24, 2015). Storm Summary Number 15 for Southern Plains Heavy Rainfall (Report). College Park, Maryland: Weather Prediction Center. Archived from the original on May 24, 2024. Retrieved October 26, 2015.
  33. Brown, Daniel; Kelly, Larry (October 25, 2023). Hurricane Otis Tropical Cyclone Update (Report). Miami, Florida. Retrieved October 24, 2023.
  34. Kimberlain, Todd B.; Blake, Eric S.; Cangialosi, John P. (February 1, 2016). Hurricane Patricia (PDF) (Report). Tropical Cyclone Report. Miami, Florida: National Hurricane Center. Retrieved February 4, 2016.
  35. Gunther, Emil B. (April 1977). "Eastern North Pacific Tropical Cyclones of 1976". Monthly Weather Review. 105 (4). Eastern Pacific Hurricane Center: 508–522. Bibcode:1977MWRv..105..508G. doi:10.1175/1520-0493(1977)105<0508:EPTCO>2.0.CO;2 . Retrieved October 11, 2011.
  36. The 1992 Central Pacific Tropical Cyclone Season (PDF) (Report). Honolulu, Hawaii: Central Pacific Hurricane Center. 1993. Retrieved November 24, 2003.
  37. 1 2 Blake, Eric S; Gibney, Ethan J; Brown, Daniel P; Mainelli, Michelle; Franklin, James L; Kimberlain, Todd B; Hammer, Gregory R (2009). Tropical Cyclones of the Eastern North Pacific Basin, 1949-2006 (PDF). Archived (PDF) from the original on April 11, 2024. Retrieved June 14, 2013.
  38. Franklin, James L. (December 26, 2002). Hurricane Kenna (PDF) (Report). Tropical Cyclone Report. Miami, Florida: National Hurricane Center. Retrieved October 11, 2011.
  39. Bucci, Lisa; Brown, Daniel (October 10, 2023). Hurricane Lidia Intermediate Advisory Number 31A (Report). Miami, Florida: National Hurricane Center. Retrieved October 11, 2023.
  40. "North Atlantic Hurricane Best Tracks (HURDAT2)". Hurricane Research Division . National Hurricane Center. February 17, 2016. Archived from the original on June 2, 2016. Retrieved April 30, 2016.
  41. "Tropical Cyclones: Image Enhancements FAQ". Cooperative Institute for Meteorological Satellite Studies . Madison, Wisconsin: University of Wisconsin-Madison. n.d. Archived from the original on February 13, 2016. Retrieved February 4, 2016.
  42. Dennis Mersereau (October 23, 2015). "At 200 MPH, Hurricane Patricia Is Now the Strongest Tropical Cyclone Ever Recorded". The Vane. Gawker Media. Archived from the original on October 23, 2015. Retrieved October 23, 2015.
  43. Christopher W. Landsea (April 21, 2010). "Subject: E1) Which is the most intense tropical cyclone on record?". Frequently Asked Questions. National Oceanic and Atmospheric Administration. Archived from the original on December 6, 2010. Retrieved October 24, 2015.
  44. "5 Things to Know About Hurricane Patricia". Atlanta, Georgia: The Weather Channel. October 23, 2015. Archived from the original on March 15, 2016. Retrieved October 24, 2015.
  45. "World: Maximum Surface Wind Gust (3-Second)". World Meteorological Organization. 2010. Archived from the original on March 3, 2016. Retrieved October 24, 2015.
  46. "Tropical Cyclone: Fastest Intensification of Tropical Cyclone". World Meteorological Organization. n.d. Archived from the original on April 20, 2016. Retrieved October 24, 2015.
Hurricane Patricia
Patricia 2015 path.png
Track of Hurricane Patricia