Constituencies
† Conservative ‡ Labour ¤ Liberal Democrat * Brexit Party
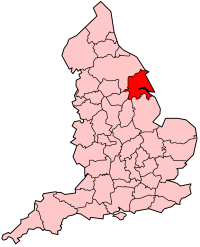
The region [nb 1] of Yorkshire and the Humber is divided into 54 parliamentary constituencies which is made up of 25 borough constituencies and 29 county constituencies. Since the general election of December 2019, [1] 24 are represented by Conservative MPs and 30 by Labour MPs.
† Conservative ‡ Labour ¤ Liberal Democrat * Brexit Party
See 2023 Periodic Review of Westminster constituencies for further details.
Following the abandonment of the Sixth Periodic Review (the 2018 review), the Boundary Commission for England formally launched the 2023 Review on 5 January 2021. The Commission calculated that the number of seats to be allocated to the Yorkshire and the Humber region will be unchanged, at 54. [5] Initial proposals were published on 8 June 2021 and, following two periods of public consultation, revised proposals were published on 8 November 2022. The final proposals were published on 28 June 2023.
Under the proposals, the following constituencies for the region will come into effect at the 2024 general election: [6]
| Constituency | Electorate | Ceremonial county | Local authority |
|---|---|---|---|
| Barnsley North CC | 76,794 | South Yorkshire | Barnsley |
| Barnsley South CC | 75,896 | South Yorkshire | Barnsley |
| Beverley and Holderness CC | 71,102 | East Riding of Yorkshire | East Riding of Yorkshire |
| Bradford East BC | 72,150 | West Yorkshire | Bradford |
| Bradford South BC | 70,890 | West Yorkshire | Bradford |
| Bradford West BC | 71,258 | West Yorkshire | Bradford |
| Bridlington and The Wolds CC | 72,501 | East Riding of Yorkshire | East Riding of Yorkshire |
| Brigg and Immingham CC | 71,628 | Lincolnshire | North East Lincolnshire / North Lincolnshire |
| Calder Valley CC | 75,987 | West Yorkshire | Calderdale |
| Colne Valley CC | 71,518 | West Yorkshire | Kirklees |
| Dewsbury and Batley BC | 70,226 | West Yorkshire | Kirklees |
| Doncaster Central CC | 75,007 | South Yorkshire | Doncaster |
| Doncaster East and the Isle of Axholme CC | 70,113 | Lincolnshire / South Yorkshire | Doncaster / North Lincolnshire |
| Doncaster North CC | 71,739 | South Yorkshire | Doncaster |
| Goole and Pocklington CC | 76,337 | East Riding of Yorkshire | East Riding of Yorkshire |
| Great Grimsby and Cleethorpes BC | 77,050 | Lincolnshire | North East Lincolnshire |
| Halifax CC | 74,563 | West Yorkshire | Calderdale |
| Harrogate and Knaresborough BC | 75,800 | North Yorkshire | North Yorkshire |
| Huddersfield BC | 76,044 | West Yorkshire | Kirklees |
| Keighley and Ilkley CC | 72,954 | West Yorkshire | Bradford |
| Kingston upon Hull East BC | 72,622 | East Riding of Yorkshire | Kingston upon Hull |
| Kingston upon Hull North and Cottingham BC | 76,039 | East Riding of Yorkshire | East Riding of Yorkshire / Kingston upon Hull |
| Kingston upon Hull West and Haltemprice CC | 74,321 | East Riding of Yorkshire | East Riding of Yorkshire / Kingston upon Hull |
| Leeds Central and Headingley BC | 75,396 | West Yorkshire | Leeds |
| Leeds East CC | 75,330 | West Yorkshire | Leeds |
| Leeds North East CC | 70,976 | West Yorkshire | Leeds |
| Leeds North West CC | 71,607 | West Yorkshire | Leeds |
| Leeds South BC | 74,726 | West Yorkshire | Leeds |
| Leeds South West and Morley BC | 71,376 | West Yorkshire | Leeds |
| Leeds West and Pudsey BC | 70,270 | West Yorkshire | Leeds |
| Normanton and Hemsworth CC | 75,388 | West Yorkshire | Wakefield |
| Ossett and Denby Dale CC | 71,595 | West Yorkshire | Kirklees / Wakefield |
| Penistone and Stocksbridge CC | 71,377 | South Yorkshire | Barnsley / Sheffield |
| Pontefract, Castleford and Knottingley CC | 72,751 | West Yorkshire | Wakefield |
| Rawmarsh and Conisbrough CC | 70,272 | South Yorkshire | Doncaster / Rotherham |
| Richmond and Northallerton CC | 72,744 | North Yorkshire | North Yorkshire |
| Rother Valley CC | 70,814 | South Yorkshire | Rotherham |
| Rotherham BC | 75,345 | South Yorkshire | Rotherham |
| Scarborough and Whitby CC | 73,862 | North Yorkshire | North Yorkshire |
| Scunthorpe CC | 74,278 | Lincolnshire | North Lincolnshire |
| Selby CC | 74,761 | North Yorkshire / West Yorkshire | Leeds / North Yorkshire |
| Sheffield Brightside and Hillsborough BC | 71,154 | South Yorkshire | Sheffield |
| Sheffield Central BC | 70,453 | South Yorkshire | Sheffield |
| Sheffield Hallam CC | 76,637 | South Yorkshire | Sheffield |
| Sheffield Heeley BC | 74,614 | South Yorkshire | Sheffield |
| Sheffield South East BC | 76,223 | South Yorkshire | Sheffield |
| Shipley CC | 74,095 | West Yorkshire | Bradford |
| Skipton and Ripon CC | 76,758 | North Yorkshire | North Yorkshire |
| Spen Valley CC | 72,169 | West Yorkshire | Kirklees |
| Thirsk and Malton CC | 76,623 | North Yorkshire | North Yorkshire |
| Wakefield and Rothwell BC | 73,968 | West Yorkshire | Leeds / Wakefield |
| Wetherby and Easingwold CC | 71,455 | North Yorkshire / West Yorkshire | North Yorkshire / Leeds |
| York Central BC | 74,854 | North Yorkshire | York |
| York Outer CC | 72,720 | North Yorkshire | York |
Primary data source: House of Commons research briefing - General election results from 1918 to 2019 [7]
The number of votes cast for each political party who fielded candidates in constituencies comprising the Yorkshire and the Humber region in the 2019 general election were as follows:
| Party | Votes | % | Change from 2017 | Seats | Change from 2017 |
|---|---|---|---|---|---|
| Conservative | 1,097,376 | 43.1% | 26 | ||
| Labour | 989,787 | 38.9% | 28 | ||
| Liberal Democrats | 205,225 | 8.1% | 0 | 0 | |
| Brexit | 150,579 | 5.9% | new | 0 | 0 |
| Greens | 57,362 | 2.3% | 0 | 0 | |
| Others | 46,604 | 1.7% | 0 | 0 | |
| Total | 2,546,933 | 100.0 | 54 |

Key:
CON - Conservative Party, including National Liberal Party up to 1966
LAB - Labour Party
LIB - Liberal Party up to 1979; SDP-Liberal Alliance 1983 & 1987; Liberal Democrats from 1992
UKIP/Br - UK Independence Party 2010 to 2017 (included in Other up to 2005 and in 2019); Brexit Party in 2019
Green - Green Party of England and Wales (included in Other up to 2005)

Key:
CON - Conservative Party, including National Liberal Party up to 1966
LAB - Labour Party
LIB - Liberal Party up to 1979; SDP-Liberal Alliance 1983 & 1987; Liberal Democrats from 1992
The ceremonial county of Shropshire, England, is divided into 5 parliamentary constituencies – 1 borough constituency and 4 county constituencies. As with all constituencies for the House of Commons in the modern age, each constituency elects one Member of Parliament by the first-past-the-post system.

As a result of the Fifth Periodical Review of the Boundary Commission for Scotland, Scotland is covered by 59 constituencies of the House of Commons of the United Kingdom Parliament: 19 burgh constituencies and 40 county constituencies. These constituencies were used from the 2005 to the 2019 general elections, and will be replaced by new constituencies at the next election.
The region of South West England has, since the 2010 general election, 55 parliamentary constituencies which is made up of 15 borough constituencies and 40 county constituencies. At that election the Conservative Party held the largest number of constituencies, with 36. The Liberal Democrats had 15 and Labour had 4. At the 2015 general election the Liberal Democrats lost all of their seats, while the Conservatives gained one seat from Labour, leaving the Conservatives with 51 and Labour with 4. In the 2017 general election, the Conservatives remained, by far, the largest party with 47 seats, though losing three to Labour, who won 7, and one to the Liberal Democrats, who won 1. In the 2019 general election, the Conservatives increased their number of seats to 48 by regaining Stroud from Labour, who held their other six seats, while the Liberal Democrats retained their sole seat in Bath.
The region of North East England is divided into 29 parliamentary constituencies which is made up of 19 borough constituencies and 10 county constituencies. Since the 2019 general election, 17 are represented by Labour MPs and 11 by Conservative MPs. One is an independent.
The region of East Midlands is divided into 46 parliamentary constituencies which is made up of 12 borough constituencies and 34 county constituencies. Since the 2019 United Kingdom general election, 35 are represented by Conservative MPs, 8 by Labour MPs, 2 by independent MPs, and 1 by a Reform UK MP.
The region of the East of England is divided into 58 parliamentary constituencies which is made up of 16 borough constituencies and 42 county constituencies. Since the general election of December 2019, 49 are represented by Conservative MPs, seven by Labour MPs, one by a Liberal Democrat MP, and one by an independent MP.
The region of West Midlands is divided into 59 parliamentary constituencies which is made up of 35 borough constituencies and 24 county constituencies. Since the general election of December 2019, 42 are represented by Conservative MPs, 16 by Labour MPs, and 1 by a Liberal Democrat MP.
The region of North West England is divided into 75 parliamentary constituencies, of which 39 are borough constituencies and 36 are county constituencies. Since the general election of December 2019, 30 are represented by Conservative MPs, 41 by Labour MPs, 1 by a Liberal Democrat MP, 1 by the Speaker, and 1 by a Workers MP.
The region of South East England is divided into 84 parliamentary constituencies, which are made up of 23 borough constituencies and 61 county constituencies. Since the general election of December 2019, 72 are represented by Conservative MPs, 9 by Labour MPs, 2 by Liberal Democrat MPs, and 1 by a Green MP.