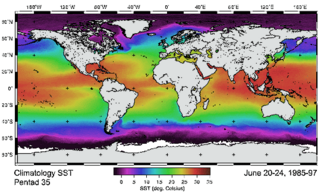
Satellite temperature measurements are inferences of the temperature of the atmosphere at various altitudes as well as sea and land surface temperatures obtained from radiometric measurements by satellites. These measurements can be used to locate weather fronts, monitor the El Niño-Southern Oscillation, determine the strength of tropical cyclones, study urban heat islands and monitor the global climate. Wildfires, volcanos, and industrial hot spots can also be found via thermal imaging from weather satellites.

A microwave radiometer (MWR) is a radiometer that measures energy emitted at one millimeter-to-metre wavelengths (frequencies of 0.3–300 GHz) known as microwaves. Microwave radiometers are very sensitive receivers designed to measure thermally-emitted electromagnetic radiation. They are usually equipped with multiple receiving channels to derive the characteristic emission spectrum of planetary atmospheres, surfaces or extraterrestrial objects. Microwave radiometers are utilized in a variety of environmental and engineering applications, including remote sensing, weather forecasting, climate monitoring, radio astronomy and radio propagation studies.

Within the atmospheric sciences, atmospheric physics is the application of physics to the study of the atmosphere. Atmospheric physicists attempt to model Earth's atmosphere and the atmospheres of the other planets using fluid flow equations, radiation budget, and energy transfer processes in the atmosphere. In order to model weather systems, atmospheric physicists employ elements of scattering theory, wave propagation models, cloud physics, statistical mechanics and spatial statistics which are highly mathematical and related to physics. It has close links to meteorology and climatology and also covers the design and construction of instruments for studying the atmosphere and the interpretation of the data they provide, including remote sensing instruments. At the dawn of the space age and the introduction of sounding rockets, aeronomy became a subdiscipline concerning the upper layers of the atmosphere, where dissociation and ionization are important.
The Special Sensor Microwave/Imager (SSM/I) is a seven-channel, four-frequency, linearly polarized passive microwave radiometer system. It is flown on board the United States Air Force Defense Meteorological Satellite Program (DMSP) Block 5D-2 satellites. The instrument measures surface/atmospheric microwave brightness temperatures (TBs) at 19.35, 22.235, 37.0 and 85.5 GHz. The four frequencies are sampled in both horizontal and vertical polarizations, except the 22 GHz which is sampled in the vertical only.

A motion detector is an electrical device that utilizes a sensor to detect nearby motion. Such a device is often integrated as a component of a system that automatically performs a task or alerts a user of motion in an area. They form a vital component of security, automated lighting control, home control, energy efficiency, and other useful systems.

The Advanced Very-High-Resolution Radiometer (AVHRR) instrument is a space-borne sensor that measures the reflectance of the Earth in five spectral bands that are relatively wide by today's standards. AVHRR instruments are or have been carried by the National Oceanic and Atmospheric Administration (NOAA) family of polar orbiting platforms (POES) and European MetOp satellites. The instrument scans several channels; two are centered on the red (0.6 micrometres) and near-infrared (0.9 micrometres) regions, a third one is located around 3.5 micrometres, and another two the thermal radiation emitted by the planet, around 11 and 12 micrometres.
Atmospheric sounding or atmospheric profiling is a measurement of vertical distribution of physical properties of the atmospheric column such as pressure, temperature, wind speed and wind direction, liquid water content, ozone concentration, pollution, and other properties. Such measurements are performed in a variety of ways including remote sensing and in situ observations.

The coastal zone color scanner (CZCS) was a multi-channel scanning radiometer aboard the Nimbus 7 satellite, predominately designed for water remote sensing. Nimbus 7 was launched 24 October 1978, and CZCS became operational on 2 November 1978. It was only designed to operate for one year (as a proof-of-concept), but in fact remained in service until 22 June 1986. Its operation on board the Nimbus 7 was limited to alternate days as it shared its power with the passive microwave scanning multichannel microwave radiometer.
Electro-optical MASINT is a subdiscipline of Measurement and Signature Intelligence, (MASINT) and refers to intelligence gathering activities which bring together disparate elements that do not fit within the definitions of Signals Intelligence (SIGINT), Imagery Intelligence (IMINT), or Human Intelligence (HUMINT).

Wave radar is a type of radar for measuring wind waves. Several instruments based on a variety of different concepts and techniques are available, and these are all often called. This article, gives a brief description of the most common ground-based radar remote sensing techniques.

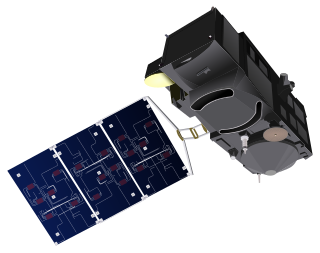
Sentinel-3 is an Earth observation heavy satellite series developed by the European Space Agency as part of the Copernicus Programme. It currently consists of 2 satellites: Sentinel-3A and Sentinel-3B. After initial commissioning, each satellite was handed over to EUMETSAT for the routine operations phase of the mission. Two recurrent satellites— Sentinel-3C and Sentinel-3D— will follow in approximately 2025 and 2028 respectively to ensure continuity of the Sentinel-3 mission.
The Community Radiative Transfer Model (CRTM) is a fast radiative transfer model for calculations of radiances for satellite infrared or microwave radiometers.
Frank Wentz is the CEO and director of Remote Sensing Systems, a company he founded in 1974, which specializes in satellite microwave remote sensing research. Together with Carl Mears, he is best known for developing a satellite temperature record from MSU and AMSU. Intercomparison of this record with the earlier UAH satellite temperature record, developed by John Christy and Roy Spencer, revealed deficiencies in the earlier work; specifically, the warming trend in the RSS version is larger than the University of Alabama in Huntsville (UAH) one. From 1978 to 1982, Wentz was a member of NASA's SeaSat Experiment Team involved in the development of physically based retrieval methods for microwave scatterometers and radiometers. He has also investigated the effect of climate change on satellite-derived evaporation, precipitation and surface wind values. His findings are different from most climate change model predictions.
Collocation is a procedure used in remote sensing to match measurements from two or more different instruments. This is done for two main reasons: for validation purposes when comparing measurements of the same variable, and to relate measurements of two different variables either for performing retrievals or for prediction. In the second case the data is later fed into some type of statistical inverse method such as an artificial neural network, statistical classification algorithm, kernel estimator or a linear least squares. In principle, most collocation problems can be solved by a nearest neighbor search, but in practice there are many other considerations involved and the best method is highly specific to the particular matching of instruments. Here we deal with some of the most important considerations along with specific examples.
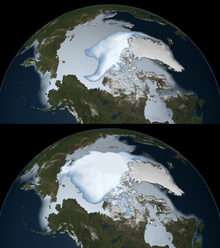
With increased interest in sea ice and its effects on the global climate, efficient methods are required to monitor both its extent and exchange processes. Satellite-mounted, microwave radiometers, such SSMI, AMSR and AMSU, are an ideal tool for the task because they can see through cloud cover, and they have frequent, global coverage. A passive microwave instrument detects objects through emitted radiation since different substance have different emission spectra. To detect sea ice more efficiently, there is a need to model these emission processes. The interaction of sea ice with electromagnetic radiation in the microwave range is still not well understood. In general is collected information limited because of the large-scale variability due to the emissivity of sea ice.

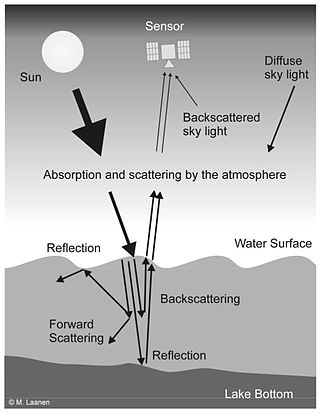
Water Remote Sensing is the observation of water bodies such as lakes, oceans, and rivers from a distance in order to describe their color, state of ecosystem health, and productivity. Water remote sensing studies the color of water through the observation of the spectrum of water leaving radiance. From the spectrum of color coming from the water, the concentration of optically active components of the upper layer of the water body can be estimated via specific algorithms. Water quality monitoring by remote sensing and close-range instruments has obtained considerable attention since the founding of EU Water Framework Directive.
Satellite surface salinity refers to measurements of surface salinity made by remote sensing satellites. The radiative properties of the ocean surface are exploited in order to estimate the salinity of the water's surface layer.

Remote sensing is used in the geological sciences as a data acquisition method complementary to field observation, because it allows mapping of geological characteristics of regions without physical contact with the areas being explored. About one-fourth of the Earth's total surface area is exposed land where information is ready to be extracted from detailed earth observation via remote sensing. Remote sensing is conducted via detection of electromagnetic radiation by sensors. The radiation can be naturally sourced, or produced by machines and reflected off of the Earth surface. The electromagnetic radiation acts as an information carrier for two main variables. First, the intensities of reflectance at different wavelengths are detected, and plotted on a spectral reflectance curve. This spectral fingerprint is governed by the physio-chemical properties of the surface of the target object and therefore helps mineral identification and hence geological mapping, for example by hyperspectral imaging. Second, the two-way travel time of radiation from and back to the sensor can calculate the distance in active remote sensing systems, for example, Interferometric synthetic-aperture radar. This helps geomorphological studies of ground motion, and thus can illuminate deformations associated with landslides, earthquakes, etc.
Remote sensing in oceanography is a widely used observational technique which enables researchers to acquire data of a location without physically measuring at that location. Remote sensing in oceanography mostly refers to measuring properties of the ocean surface with sensors on satellites or planes, which compose an image of captured electromagnetic radiation. A remote sensing instrument can either receive radiation from the Earth’s surface (passive), whether reflected from the Sun or emitted, or send out radiation to the surface and catch the reflection (active). All remote sensing instruments carry a sensor to capture the intensity of the radiation at specific wavelength windows, to retrieve a spectral signature for every location. The physical and chemical state of the surface determines the emissivity and reflectance for all bands in the electromagnetic spectrum, linking the measurements to physical properties of the surface. Unlike passive instruments, active remote sensing instruments also measure the two-way travel time of the signal; which is used to calculate the distance between the sensor and the imaged surface. Remote sensing satellites often carry other instruments which keep track of their location and measure atmospheric conditions.
The sea surface skin temperature (SSTskin), or ocean skin temperature, is the temperature of the sea surface as determined through its infrared spectrum (3.7–12 μm) and represents the temperature of the sublayer of water at a depth of 10–20 μm. High-resolution data of skin temperature gained by satellites in passive infrared measurements is a crucial constituent in determining the sea surface temperature (SST).


