1820 United States census

Last updated

1820 United States census

  1810 August 7, 1820 (1820-08-07) 1830  

Seal of the United States Marshals Service.svg
Seal of the United States Marshals Service, which administered the census
General information
CountryUnited States
Authority Office of the United States Marshal
Results
Total population9,638,454 (Increase2.svg 33.1%)
Most populous state New York
1,532,881
Least populous state Illinois
55,211

The 1820 United States census was the fourth census conducted in the United States. It was conducted on August 7, 1820. The 1820 census included six new states: Louisiana, Indiana, Mississippi, Illinois, Alabama and Maine. There has been a district wide loss of 1820 census records for Arkansas Territory, Missouri Territory, [1] and New Jersey.

Contents

The total population was determined to be 9,638,453, of which 1,538,022 were slaves. The center of population was about 120 miles (193 km) west-northwest of Washington in Hardy County, Virginia (now in West Virginia).

This was the first census in which any states recorded a population of over one million New York, Virginia, and Pennsylvania as well as the first in which a city recorded a population of over 100,000 New York. It was also the first census in which Baltimore was ranked as the country's second-most populous city. Thirdly, in this census and the 14 subsequent ones, New York was the most populous state until being superseded by California in the 1970 census.

Census questions

The 1820 census contains a great deal more information than previous censuses. Enumerators listed the following data in columns, left to right:

  1. Name of the head of family
    1. of free white males under age 10
    2. of free white males age 10 to under 16
    3. of free white males age 16 to 18
    4. of free white males age 16 to under 26
    5. of free white males age 26 to under 45
    6. of free white males age 45 and up
    7. of free white females under age 10
    8. of free white females age 10 to under 16
    9. of free white females age 16 to under 26
    10. of free white females age 26 to under 45
    11. of free white females age 45 and up
    12. of foreigners not naturalized
    13. of persons engaged in agriculture
    14. of persons engaged in commerce
    15. of persons engaged in manufacture
    16. of male slaves under 14
    17. of male slaves age 14 to under 26
    18. of male slaves age 26 to under 45
    19. of male slaves age 45 and up
    20. of female slaves under 14
    21. of female slaves age 14 to under 26
    22. of female slaves age 26 to under 45
    23. of female slaves age 45 and up
    24. of free male colored persons under 14
    25. of free male colored persons age 14 to under 26
    26. of free male colored persons age 26 to under 45
    27. of free male colored persons age 45 and up
    28. of free female colored persons under 14
    29. of free female colored persons age 14 to under 26
    30. of free female colored persons age 26 to under 45
    31. of free female colored persons age 45 and up
    32. of all other persons except Indians not taxed

Several of these columns were for special counts, and not to be included in the aggregate total. Doing so would have resulted in counting some individuals twice. Census takers were asked to use double lines, red ink or some other method of distinguishing these columns so that double counting would not occur. For example, the count of free white males between 16 and 18 was a special count, because these individuals were also supposed to be tabulated in the column for free white males of age 16 and under 26.

The other special counts were foreigners not naturalized, persons engaged in agriculture, persons engaged in commerce, and persons engaged in manufacture.

Census takers were also instructed to count each individual in only one of the occupational columns. For example, if an individual was engaged in agriculture, commerce, and manufacture, the census taker had to judge which one the individual was primarily engaged in.

Note to researchers

Censustaking was not yet an exact science. Before 1830, enumerators lacked pre-printed forms, and drew up their own, sometimes resulting in pages without headings, line tallies, or column totals. As a result, census records for many towns before 1830 are idiosyncratic. This is not to suggest that they are less reliable than subsequent censuses, but that they may require more work on the part of the researcher.

State rankings

RankStatePopulation
01New York1,532,981
02Virginia [2] 1,075,069
03Pennsylvania1,049,458
04North Carolina638,829
05Ohio581,434
06Kentucky564,317
07Massachusetts523,287
08South Carolina502,741
09Tennessee422,823 [lower-alpha 1]
10Maryland407,350
11Georgia340,989
12Maine298,335
13New Jersey277,575
14Connecticut275,202
15New Hampshire244,161
16Vermont235,981 [lower-alpha 2]
17Louisiana153,407
18Indiana147,178
19Alabama144,317 [4]
XWest Virginia [5] 136,808
20Rhode Island83,059
21Mississippi75,448
22Delaware72,749
XMissouri66,586
23Illinois55,211
XDistrict of Columbia [6] 23,336
XArkansas14,273
XMichigan7,452
XWisconsin1,444

Notes

  1. Printed as 422,813 in the 1820 report, but later corrected. [3]
  2. Printed as 235,764 in the 1820 report, but later corrected. [3]

City rankings

RankCityStatePopulation [7] [8] Region (2016) [9]
01 New York New York 123,706 Northeast
02 Baltimore Maryland 78,444 South
03 Philadelphia Pennsylvania 63,802 Northeast
04 Boston Massachusetts 43,298 Northeast
05 New Orleans Louisiana 27,176 South
06 Charleston South Carolina 24,780 South
07 Northern Liberties Pennsylvania 19,678 Northeast
08 Southwark Pennsylvania 14,713 Northeast
09 Washington District of Columbia 13,247 South
10 Salem Massachusetts 12,731 Northeast
11 Albany New York 12,630 Northeast
12 Richmond Virginia 12,067 South
13 Providence Rhode Island 11,767 Northeast
14 Cincinnati Ohio 9,642 Midwest
15 Portland Maine 8,581 Northeast
16 Norfolk Virginia 8,478 South
17 Alexandria District of Columbia 8,218 South
18 Savannah Georgia 7,523 South
19 Georgetown District of Columbia 7,360 South
20 Portsmouth New Hampshire 7,327 Northeast
21 Newport Rhode Island 7,319 Northeast
22 Nantucket Massachusetts 7,266 Northeast
23 Pittsburgh Pennsylvania 7,248 Northeast
24 Brooklyn New York 7,175 Northeast
25 New Haven Connecticut 7,147 Northeast
26 Kensington Pennsylvania 7,118 Northeast
27 Newburyport Massachusetts 6,852 Northeast
28 Petersburg Virginia 6,690 South
29 Lancaster Pennsylvania 6,633 Northeast
30 Charlestown Massachusetts 6,591 Northeast
31 Newark New Jersey 6,507 Northeast
32 Gloucester Massachusetts 6,384 Northeast
33 Marblehead Massachusetts 5,630 Northeast
34 Hudson New York 5,310 Northeast
35 Lexington Kentucky 5,279 South
36 Wilmington Delaware 5,268 South
37 Troy New York 5,264 Northeast
38 Hartford Connecticut 4,726 Northeast
39 Middleborough Massachusetts 4,687 Northeast
40 Smithfield Rhode Island 4,678 Northeast
41 Groton Connecticut 4,664 Northeast
42 Taunton Massachusetts 4,520 Northeast
43 Lynn Massachusetts 4,515 Northeast
44 Middletown New Jersey 4,369 Northeast
45 Plymouth Massachusetts 4,348 Northeast
46 Reading Pennsylvania 4,332 Northeast
47 Beverly Massachusetts 4,283 Northeast
48 Woodbridge New Jersey 4,226 Northeast
49 Deep River Connecticut 4,165 Northeast
50 Fairfield Connecticut 4,151 Northeast
51 Roxbury Massachusetts 4,135 Northeast
52 Lyme Connecticut 4,069 Northeast
53 Louisville Kentucky 4,012 South
54 Evesham New Jersey 3,977 Northeast
55 New Bedford Massachusetts 3,947 Northeast
56 Trenton New Jersey 3,942 Northeast
57 Schenectady New York 3,939 Northeast
58 Springfield Massachusetts 3,914 Northeast
59 Andover Massachusetts 3,889 Northeast
60 Danbury Connecticut 3,873 Northeast
61 Greenwich Connecticut 3,790 Northeast
62 Gilmanton New Hampshire 3,752 Northeast
63 South Kingstown Rhode Island 3,723 Northeast
64 New Bern North Carolina 3,663 South
65 Frederick Maryland 3,640 South
66 York Pennsylvania 3,545 Northeast
67 Fayetteville North Carolina 3,532 South
68 Elizabeth New Jersey 3,515 Northeast
69 Spring Garden Pennsylvania 3,498 Northeast
70 South Amboy New Jersey 3,406 Northeast
71 East Hartford Connecticut 3,375 Northeast
72 New London Connecticut 3,330 Northeast
73 Bristol Rhode Island 3,197 Northeast
74 East Hampton Connecticut 3,159 Northeast
75 Coventry Rhode Island 3,139 Northeast
76 Londonderry New Hampshire 3,127 Northeast
77 Glastonbury Connecticut 3,114 Northeast
78 Franklin, Somerset County New Jersey 3,071 Northeast
79 Haverhill Massachusetts 3,070 Northeast
80 Farmington Connecticut 3,042 Northeast
81 Granby Connecticut 3,012 Northeast
82 Norwalk Connecticut 3,004 Northeast
83 Harrisburg Pennsylvania 2,990 Northeast
84 Norwich Connecticut 2,983 Northeast
85 Utica New York 2,972 Northeast
86 Worcester Massachusetts 2,962 Northeast
87 Carlisle Pennsylvania 2,908 Northeast
88 Berlin Connecticut 2,877 Northeast
89 Nassau New York 2,873 Northeast
90 Dover New Hampshire 2,871 Northeast
91 Concord New Hampshire 2,838 Northeast
92 Orange New Jersey 2,830 Northeast
93 Pittsfield Massachusetts 2,768 Northeast
94 Raleigh North Carolina 2,674 South
95 Hagerstown Maryland 2,670 South
96 Cumberland Rhode Island 2,653 Northeast
97 Piscataway New Jersey 2,648 Northeast
98 Wilmington North Carolina 2,633 South
99 Middletown Connecticut 2,618 Northeast
100 Hackensack New Jersey 2,592 Northeast

Related Research Articles

<span class="mw-page-title-main">Westmoreland County, Virginia</span> County in Virginia, United States

Westmoreland County is a county located in the Northern Neck of the Commonwealth of Virginia. As of the 2020 census, the population sits at 18,477. Its county seat is Montross.

<span class="mw-page-title-main">Southampton County, Virginia</span> County in Virginia, United States

Southampton County is a county located on the southern border of the Commonwealth of Virginia. North Carolina is to the south. As of the 2020 census, the population was 17,996. Its county seat is Courtland.

<span class="mw-page-title-main">Pulaski County, Virginia</span> County in Virginia, United States

Pulaski County is a county located in the southwestern part of the U.S. state of Virginia. As of the 2020 census, the population was 33,800. Its county seat is Pulaski. Pulaski County is part of the Blacksburg–Christiansburg, VA Metropolitan Statistical Area.

<span class="mw-page-title-main">Northampton County, Virginia</span> County in Virginia, United States

Northampton County is a county located in the Commonwealth of Virginia. As of the 2020 census, the population was 12,282. Its county seat is Eastville. Northampton and Accomack Counties are a part of the larger Eastern Shore of Virginia.

<span class="mw-page-title-main">Albany, Ohio</span> Village in Ohio, United States

Albany is a village in Athens County, Ohio, United States. The population was 917 at the 2020 census.

<span class="mw-page-title-main">Ripley, Ohio</span> Village in Ohio, United States

Ripley is a village in Union Township, Brown County, Ohio, United States, along the Ohio River 50 miles southeast of Cincinnati. The population was 1,591 at the 2020 census.

<span class="mw-page-title-main">Salina, Oklahoma</span> Town in Oklahoma, United States

Salina is a town in Mayes County, Oklahoma, United States. The population was 1,396 at the 2010 census, a slight decline from the figure of 1,422 recorded in 2000.

<span class="mw-page-title-main">Lincolnia, Virginia</span> Census-designated place in Virginia, United States

Lincolnia is a census-designated place (CDP) in Fairfax County, Virginia, United States. The population was 22,828 at the 2010 census, an increase of over 44% from 2000.

<span class="mw-page-title-main">Mount Vernon, Virginia</span> Census-designated place in Virginia, United States

Mount Vernon is a census-designated place (CDP) and unincorporated community in Fairfax County, Virginia, United States. The population was 12,416 at the 2010 census. Primarily due to its historical significance and natural recreation and beauty, the Mount Vernon area receives over one million tourists each year.

In the United States census, the U.S. Census Bureau and the Office of Management and Budget define a set of self-identified categories of race and ethnicity chosen by residents, with which they most closely identify. Residents can indicate their origins alongside their race, and are asked specifically whether they are of Hispanic or Latino origin in a separate question.

<span class="mw-page-title-main">Slave states and free states</span> Historical division of United States in which slavery was legal or not

In the United States before 1865, a slave state was a state in which slavery and the internal or domestic slave trade were legal, while a free state was one in which they were prohibited. Between 1812 and 1850, it was considered by the slave states to be politically imperative that the number of free states not exceed the number of slave states, so new states were admitted in slave–free pairs. There were, nonetheless, some slaves in most free states up to the 1840 census, and the Fugitive Slave Clause of the U.S. Constitution, as implemented by the Fugitive Slave Act of 1793 and the Fugitive Slave Act of 1850, provided that a slave did not become free by entering a free state and must be returned to his or her owner.

<span class="mw-page-title-main">Free Negro</span> Emancipated people of color

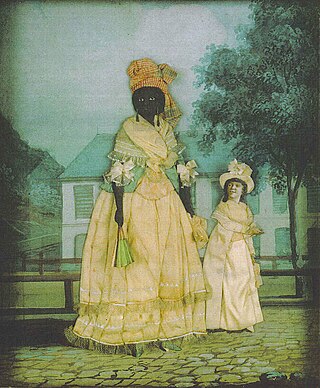
In the British colonies in North America and in the United States before the abolition of slavery in 1865, free Negro or free Black described the legal status of African Americans who were not enslaved. The term was applied both to formerly enslaved people (freedmen) and to those who had been born free, whether of African or mixed descent.

<span class="mw-page-title-main">1850 United States census</span> Seventh US census

The 1850 United States census was the seventh decennial United States Census Conducted by the Census Office, it determined the resident population of the United States to be 23,191,876—an increase of 35.9 percent over the 17,069,453 persons enumerated during the 1840 census. The total population included 3,204,313 slaves.

<span class="mw-page-title-main">1840 United States census</span> Sixth US census

The 1840 United States census was the sixth census of the United States. Conducted by U.S. marshals on June 1, 1840, it determined the resident population of the United States to be 17,069,453 – an increase of 32.7 percent over the 12,866,020 persons enumerated during the 1830 census. The total population included 2,487,355 slaves. In 1840, the center of population was about 260 miles (418 km) west of Washington, near Weston, Virginia.

<span class="mw-page-title-main">1790 United States census</span> First US census

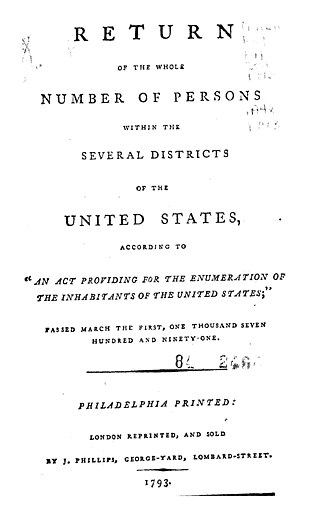
The 1790 United States census was the first United States census. It recorded the population of the whole United States as of Census Day, August 2, 1790, as mandated by Article 1, Section 2, of the Constitution and applicable laws. In the first census, the population of the United States was enumerated to be 3,929,214 inhabitants.

<span class="mw-page-title-main">1810 United States census</span> Third US census

The 1810 United States census was the third census conducted in the United States. It was conducted on August 6, 1810. It showed that 7,239,881 people were living in the United States, of whom 1,191,362 were slaves.

<span class="mw-page-title-main">1830 United States census</span> Fifth US census

The 1830 United States census, the fifth census undertaken in the United States, was conducted on June 1, 1830. The only loss of census records for 1830 involved some countywide losses in Massachusetts, Maryland, and Mississippi.

The Chestnut Ridge people (CRP) are a mixed-race community concentrated in an area northeast of Philippi, Barbour County in north-central West Virginia, with smaller related communities in the adjacent counties of Harrison and Taylor. They are often referred to as "Mayles", or "Guineas".

<span class="mw-page-title-main">History of slavery in Vermont</span> History of slavery in early Vermont

Vermont was amongst the first places to abolish slavery by constitutional dictum. Although estimates place the number of slaves at 25 in 1770, slavery was banned outright upon the founding of Vermont in July 1777, and by a further provision in its Constitution, existing male slaves became free at the age of 21 and females at the age of 18. Not only did Vermont's legislature agree to abolish slavery entirely, it also moved to provide full voting rights for African-American males. According to the Smithsonian's National Museum of African American History and Culture, "Vermont's July 1777 declaration was not entirely altruistic either. While it did set an independent tone from the 13 colonies, the declaration's wording was vague enough to let Vermont's already-established slavery practices continue."

References

  1. "Missouri historical review. v.32 1937-38". HathiTrust. Retrieved December 13, 2023.
  2. State included territory of future state of West Virginia, so including total population.
  3. 1 2 "Population, 1870-1790, in each State and Territory, by Counties, in Aggregate, and as White, Free Colored, Slave, Chinese, and Indian" (PDF). U.S. Census Bureau.
  4. Forstall, Richard L. (1996). Population of States and Counties of the United States: 1790 to 1990 . Washington: U.S. Bureau of the Census, pp. 8–11. ISBN   0-934213-48-8. Retrieved 19 May 2021. Due to the late arrival of returns from the counties of Lawrence, Perry, and Washington, the population of the state was incorrectly listed as 127,901 in the official state total. [subnote 1]
  5. Between 1790 and 1860, the state of West Virginia was part of Virginia; the data presented here reflects the present-day boundary and is also included in the total population of Virginia.
  6. The District of Columbia is not a state but was created with the passage of the Residence Act of 1790. The territory that formed that federal capital was originally donated by both Maryland and Virginia; however, the Virginia portion was returned by Congress in 1846.
  7. Population of the 100 Largest Cities and Other Urban Places in the United States: 1790 to 1990, U.S. Census Bureau, 1998
  8. "Population of Connecticut Towns 1756-1820". Connecticut Secretary of the State. State of Connecticut. Archived from the original on January 13, 2017. Retrieved April 13, 2020.
  9. "Regions and Divisions". U.S. Census Bureau. Archived from the original on December 3, 2016. Retrieved September 9, 2016.

Notes on references

  1. The relevant note on p. 10 erroneously switches the population values for Perry and Washington counties. The correct values can be found on page 121 of the final census report for 1820.