| ||||||||||||||||||||||||||
Turnout | 63.03% [1] 0.26 pp | |||||||||||||||||||||||||
---|---|---|---|---|---|---|---|---|---|---|---|---|---|---|---|---|---|---|---|---|---|---|---|---|---|---|
| ||||||||||||||||||||||||||
| ||||||||||||||||||||||||||
|
Elections in Tennessee |
---|
Government |
The 2000 United States presidential election in Tennessee was held on November 7, 2000, and was part of the 2000 United States presidential election. Voters chose 11 representatives, or electors, to the Electoral College, who voted for president and vice president.
Tennessee was won by Governor George W. Bush by a 3.87% margin of victory, despite having voted for President Bill Clinton in 1992 and 1996 and being the home state of Vice President Al Gore. If Gore had carried his home state, he, instead of Bush, would have been elected president. [2]
Gore's defeat was considered somewhat of an upset, as he had previously won every county in Tennessee in 1990 and was considered to have been a popular senator in the state prior to his election as vice president.
This was the last of three consecutive elections in which Tennessee was decided by single-digit margins, and as of 2020, this is the last election with such results. Since 2000, Tennessee has rapidly moved away from swing state status and become a Republican stronghold. [3] Gore was the first major party nominee to lose his home state since George McGovern lost South Dakota in 1972. Additionally, this was the first election where a presidential nominee won the state with more than a million votes. As of the 2020 presidential election [update] , this is the last election in which Campbell County, Lewis County, Robertson County, Gibson County, Dickson County, Bedford County, Franklin County, Warren County, Henry County, Marshall County, Giles County, Marion County, White County, Hickman County, DeKalb County, Crockett County, Cannon County, and Decatur County voted for the Democratic nominee. Gore's victories in Marion and Campbell remain the last time that a Democrat has carried any county in staunchly Republican East Tennessee. This is also the last time that Tennessee voted to the left of Arizona, Colorado, Virginia, and North Carolina.
| |||||||||||||||||||
81 delegates to the Democratic National Convention (68 pledged, 13 unpledged) The number of pledged delegates received is determined by the popular vote | |||||||||||||||||||
---|---|---|---|---|---|---|---|---|---|---|---|---|---|---|---|---|---|---|---|
| |||||||||||||||||||
Results by county Gore: 75–80% 80–85% 85–90% 90–95% 95–100% |
The 2000 Tennessee Democratic presidential primary was held on March 14, 2000, as one of 6 contests scheduled the following week after Super Tuesday. The Tennessee primary was an open primary, with the state awarding 81 delegates towards the 2000 Democratic National Convention, of which 68 were pledged delegates allocated on the basis of the results of the primary.
Vice president Al Gore easily decided the primary in his home state, winning 92.1% of the vote and all 68 delegates. Senator Bill Bradley took only 5.3% of the vote and earned 0 delegates, while Lyndon LaRouche Jr. only got 0.5% of the vote.
Candidate | Votes | % | Delegates [5] |
---|---|---|---|
Al Gore | 198,264 | 92.13 | 68 |
Bill Bradley (withdrawn) | 11,323 | 5.26 | |
Uncommitted | 4,407 | 2.05 | 13 |
Lyndon LaRouche Jr. | 1,031 | 0.48 | |
Write-in votes | 178 | 0.08 | |
Total | 215,203 | 100% | 81 |
| |||||||||||||||||||||||||||||||||||||||||
| |||||||||||||||||||||||||||||||||||||||||
---|---|---|---|---|---|---|---|---|---|---|---|---|---|---|---|---|---|---|---|---|---|---|---|---|---|---|---|---|---|---|---|---|---|---|---|---|---|---|---|---|---|
| |||||||||||||||||||||||||||||||||||||||||
Results by county Bush: 60–65% 65–70% 70–75% 75–80% 80–85% 85–90% |
The 2000 Tennessee Republican presidential primary was held on March 14, 2000, as one of 6 contests scheduled the following week after Super Tuesday. The Tennessee primary was an open primary, with the state awarding 37 delegates towards the 2000 Republican National Convention.
George W. Bush won the primary with 77.0% of the vote and all 37 of the state's delegates. John McCain came second with 14.5% of the vote. Alan Keyes came third with 6.8% of the vote.
Candidate | Votes | Percentage | Delegates |
---|---|---|---|
George W. Bush | 193,166 | 77.02% | 37 |
John McCain | 36,436 | 14.53% | 0 |
Alan Keyes | 16,916 | 6.75% | 0 |
Gary Bauer | 1,305 | 0.52% | 0 |
Steve Forbes | 1,018 | 0.41% | 0 |
Orrin Hatch | 252 | 0.10% | 0 |
Write-ins | 75 | 0.03% | 0 |
Uncommitted | 1,623 | 0.65% | 0 |
Total | 250,791 | 100.00% | 37 |
United States presidential election in Tennessee, 2000 [7] | |||||
---|---|---|---|---|---|
Party | Candidate | Votes | Percentage | Electoral votes | |
Republican | George Walker Bush | 1,061,949 | 51.15% | 11 | |
Democratic | Albert Arnold Gore Jr. | 981,720 | 47.28% | 0 | |
Independent | Ralph Nader | 19,781 | 0.95% | 0 | |
Independent | Harry Edson Browne | 4,284 | 0.21% | 0 | |
Independent | Patrick Joseph Buchanan | 4,250 | 0.20% | 0 | |
Totals | 2,071,984 | 11 |
County | George W. Bush Republican | Al Gore Democratic | Various candidates Other parties | Margin | Total | ||||
---|---|---|---|---|---|---|---|---|---|
# | % | # | % | # | % | # | % | ||
Anderson | 14,688 | 51.04% | 13,556 | 47.10% | 535 | 1.86% | 1,132 | 3.94% | 28,779 |
Bedford | 5,911 | 48.42% | 6,136 | 50.27% | 160 | 1.31% | -225 | -1.85% | 12,207 |
Benton | 2,484 | 39.36% | 3,700 | 58.63% | 127 | 2.01% | -1,216 | -19.27% | 6,311 |
Bledsoe | 2,380 | 56.72% | 1,756 | 41.85% | 60 | 1.43% | 624 | 14.87% | 4,196 |
Blount | 25,273 | 62.15% | 14,688 | 36.12% | 701 | 1.72% | 10,585 | 26.03% | 40,662 |
Bradley | 20,167 | 68.50% | 8,768 | 29.78% | 508 | 1.73% | 11,399 | 38.72% | 29,443 |
Campbell | 5,784 | 46.57% | 6,492 | 52.27% | 145 | 1.17% | -708 | -5.70% | 12,421 |
Cannon | 1,924 | 40.96% | 2,697 | 57.42% | 76 | 1.62% | -773 | -16.46% | 4,697 |
Carroll | 5,465 | 50.48% | 5,239 | 48.39% | 123 | 1.14% | 226 | 2.09% | 10,827 |
Carter | 12,111 | 63.40% | 6,724 | 35.20% | 267 | 1.40% | 5,387 | 28.20% | 19,102 |
Cheatham | 6,356 | 50.38% | 6,062 | 48.05% | 198 | 1.57% | 294 | 2.33% | 12,616 |
Chester | 3,487 | 60.88% | 2,192 | 38.27% | 49 | 0.86% | 1,295 | 22.61% | 5,728 |
Claiborne | 5,023 | 55.81% | 3,841 | 42.68% | 136 | 1.51% | 1,182 | 13.13% | 9,000 |
Clay | 1,468 | 42.65% | 1,931 | 56.10% | 43 | 1.25% | -463 | -13.45% | 3,442 |
Cocke | 6,185 | 60.41% | 3,872 | 37.82% | 182 | 1.78% | 2,313 | 22.59% | 10,239 |
Coffee | 8,788 | 49.40% | 8,741 | 49.14% | 259 | 1.46% | 47 | 0.26% | 17,788 |
Crockett | 2,676 | 49.19% | 2,705 | 49.72% | 59 | 1.08% | -29 | -0.53% | 5,440 |
Cumberland | 10,994 | 57.81% | 7,644 | 40.20% | 379 | 1.99% | 3,350 | 17.61% | 19,017 |
Davidson | 84,117 | 40.33% | 120,508 | 57.77% | 3,963 | 1.90% | -36,391 | -17.44% | 208,588 |
Decatur | 2,046 | 46.82% | 2,278 | 52.13% | 46 | 1.05% | -232 | -5.31% | 4,370 |
DeKalb | 2,411 | 38.48% | 3,765 | 60.10% | 89 | 1.42% | -1,354 | -21.62% | 6,265 |
Dickson | 7,016 | 45.10% | 8,332 | 53.56% | 208 | 1.34% | -1,316 | -8.46% | 15,556 |
Dyer | 6,282 | 53.05% | 5,425 | 45.82% | 134 | 1.13% | 857 | 7.23% | 11,841 |
Fayette | 6,402 | 55.53% | 5,037 | 43.69% | 90 | 0.78% | 1,365 | 11.84% | 11,529 |
Fentress | 3,417 | 56.68% | 2,529 | 41.95% | 83 | 1.38% | 888 | 14.73% | 6,029 |
Franklin | 6,560 | 44.65% | 7,828 | 53.28% | 303 | 2.06% | -1,268 | -8.63% | 14,691 |
Gibson | 8,286 | 48.35% | 8,663 | 50.55% | 188 | 1.10% | -377 | -2.20% | 17,137 |
Giles | 4,377 | 43.48% | 5,527 | 54.91% | 162 | 1.61% | -1,150 | -11.43% | 10,066 |
Grainger | 3,746 | 60.48% | 2,361 | 38.12% | 87 | 1.40% | 1,385 | 22.36% | 6,194 |
Greene | 12,540 | 60.24% | 7,909 | 37.99% | 367 | 1.76% | 4,631 | 22.25% | 20,816 |
Grundy | 1,553 | 33.79% | 2,970 | 64.62% | 73 | 1.59% | -1,417 | -30.83% | 4,596 |
Hamblen | 11,824 | 60.02% | 7,564 | 38.40% | 311 | 1.58% | 4,260 | 21.62% | 19,699 |
Hamilton | 66,605 | 55.33% | 51,708 | 42.95% | 2,066 | 1.72% | 14,897 | 12.38% | 120,379 |
Hancock | 1,343 | 64.72% | 690 | 33.25% | 42 | 2.02% | 653 | 31.47% | 2,075 |
Hardeman | 3,729 | 42.36% | 4,953 | 56.26% | 121 | 1.37% | -1,224 | -13.90% | 8,803 |
Hardin | 4,951 | 56.38% | 3,735 | 42.53% | 96 | 1.09% | 1,216 | 13.85% | 8,782 |
Hawkins | 10,071 | 58.90% | 6,753 | 39.50% | 274 | 1.60% | 3,318 | 19.40% | 17,098 |
Haywood | 2,554 | 39.43% | 3,887 | 60.00% | 37 | 0.57% | -1,333 | -20.57% | 6,478 |
Henderson | 5,153 | 61.35% | 3,166 | 37.69% | 80 | 0.95% | 1,987 | 23.66% | 8,399 |
Henry | 5,944 | 48.29% | 6,093 | 49.50% | 272 | 2.21% | -149 | -1.21% | 12,309 |
Hickman | 2,914 | 40.12% | 4,239 | 58.36% | 111 | 1.53% | -1,325 | -18.24% | 7,264 |
Houston | 993 | 31.76% | 2,081 | 66.55% | 53 | 1.69% | -1,088 | -34.79% | 3,127 |
Humphreys | 2,387 | 35.73% | 4,205 | 62.94% | 89 | 1.33% | -1,818 | -27.21% | 6,681 |
Jackson | 1,384 | 29.11% | 3,304 | 69.50% | 66 | 1.39% | -1,920 | -40.39% | 4,754 |
Jefferson | 8,657 | 61.45% | 5,226 | 37.10% | 204 | 1.45% | 3,431 | 24.35% | 14,087 |
Johnson | 3,740 | 66.11% | 1,813 | 32.05% | 104 | 1.84% | 1,927 | 34.06% | 5,657 |
Knox | 86,851 | 57.68% | 60,969 | 40.49% | 2,766 | 1.84% | 25,882 | 17.19% | 150,586 |
Lake | 781 | 35.12% | 1,419 | 63.80% | 24 | 1.08% | -638 | -28.68% | 2,224 |
Lauderdale | 3,329 | 43.70% | 4,224 | 55.45% | 65 | 0.85% | -895 | -11.75% | 7,618 |
Lawrence | 7,613 | 52.61% | 6,643 | 45.91% | 214 | 1.48% | 970 | 6.70% | 14,470 |
Lewis | 2,037 | 46.09% | 2,281 | 51.61% | 102 | 2.31% | -244 | -5.52% | 4,420 |
Lincoln | 5,435 | 50.99% | 5,060 | 47.47% | 164 | 1.54% | 375 | 3.52% | 10,659 |
Loudon | 10,266 | 62.57% | 5,905 | 35.99% | 235 | 1.43% | 4,361 | 26.58% | 16,406 |
Macon | 3,366 | 51.86% | 3,059 | 47.13% | 66 | 1.02% | 307 | 4.73% | 6,491 |
Madison | 17,862 | 52.64% | 15,781 | 46.51% | 287 | 0.85% | 2,081 | 6.13% | 33,930 |
Marion | 4,651 | 45.38% | 5,441 | 53.08% | 158 | 1.54% | -790 | -7.70% | 10,250 |
Marshall | 4,105 | 43.86% | 5,107 | 54.57% | 147 | 1.57% | -1,002 | -10.71% | 9,359 |
Maury | 11,930 | 50.98% | 11,127 | 47.55% | 343 | 1.47% | 803 | 3.43% | 23,400 |
McMinn | 10,155 | 61.17% | 6,142 | 37.00% | 303 | 1.83% | 4,013 | 24.17% | 16,600 |
McNairy | 4,897 | 54.48% | 4,003 | 44.53% | 89 | 0.99% | 894 | 9.95% | 8,989 |
Meigs | 1,797 | 53.01% | 1,555 | 45.87% | 38 | 1.12% | 242 | 7.14% | 3,390 |
Monroe | 7,514 | 57.79% | 5,327 | 40.97% | 162 | 1.25% | 2,187 | 16.82% | 13,003 |
Montgomery | 19,644 | 50.31% | 18,818 | 48.20% | 582 | 1.49% | 826 | 2.11% | 39,044 |
Moore | 1,145 | 49.76% | 1,107 | 48.11% | 49 | 2.13% | 38 | 1.65% | 2,301 |
Morgan | 3,144 | 51.02% | 2,921 | 47.40% | 97 | 1.57% | 223 | 3.62% | 6,162 |
Obion | 6,168 | 49.58% | 6,056 | 48.68% | 216 | 1.74% | 112 | 0.90% | 12,440 |
Overton | 2,875 | 38.35% | 4,507 | 60.13% | 114 | 1.52% | -1,632 | -21.78% | 7,496 |
Perry | 1,165 | 40.65% | 1,650 | 57.57% | 51 | 1.78% | -485 | -16.92% | 2,866 |
Pickett | 1,281 | 57.21% | 939 | 41.94% | 19 | 0.85% | 342 | 15.27% | 2,239 |
Polk | 2,907 | 51.97% | 2,574 | 46.01% | 113 | 2.02% | 333 | 5.96% | 5,594 |
Putnam | 11,248 | 50.13% | 10,785 | 48.07% | 405 | 1.80% | 463 | 2.06% | 22,438 |
Rhea | 5,900 | 60.38% | 3,722 | 38.09% | 150 | 1.53% | 2,178 | 22.29% | 9,772 |
Roane | 11,345 | 53.20% | 9,575 | 44.90% | 406 | 1.90% | 1,770 | 8.30% | 21,326 |
Robertson | 9,675 | 47.98% | 10,249 | 50.83% | 240 | 1.19% | -574 | -2.85% | 20,164 |
Rutherford | 33,445 | 53.79% | 27,360 | 44.00% | 1,377 | 2.21% | 6,085 | 9.79% | 62,182 |
Scott | 3,579 | 54.10% | 2,967 | 44.85% | 69 | 1.04% | 612 | 9.25% | 6,615 |
Sequatchie | 2,169 | 55.80% | 1,648 | 42.40% | 70 | 1.80% | 521 | 13.40% | 3,887 |
Sevier | 16,734 | 65.97% | 8,208 | 32.36% | 423 | 1.67% | 8,526 | 33.61% | 25,365 |
Shelby | 141,756 | 42.09% | 190,404 | 56.54% | 4,595 | 1.36% | -48,648 | -14.45% | 336,755 |
Smith | 2,384 | 32.44% | 4,884 | 66.47% | 80 | 1.09% | -2,500 | -34.03% | 7,348 |
Stewart | 1,826 | 38.18% | 2,870 | 60.02% | 86 | 1.80% | -1,044 | -21.84% | 4,782 |
Sullivan | 33,482 | 60.08% | 21,354 | 38.32% | 891 | 1.60% | 12,128 | 21.76% | 55,727 |
Sumner | 27,601 | 54.68% | 22,118 | 43.82% | 758 | 1.50% | 5,483 | 10.86% | 50,477 |
Tipton | 10,070 | 60.84% | 6,300 | 38.06% | 182 | 1.10% | 3,770 | 22.78% | 16,552 |
Trousdale | 950 | 32.26% | 1,966 | 66.76% | 29 | 0.98% | -1,016 | -34.50% | 2,945 |
Unicoi | 3,780 | 58.80% | 2,566 | 39.91% | 83 | 1.29% | 1,215 | 18.89% | 6,429 |
Union | 3,199 | 54.96% | 2,564 | 44.05% | 58 | 1.00% | 635 | 10.91% | 5,821 |
Van Buren | 845 | 39.65% | 1,255 | 58.89% | 31 | 1.45% | -410 | -19.24% | 2,131 |
Warren | 5,552 | 42.28% | 7,378 | 56.19% | 201 | 1.53% | -1,826 | -13.91% | 13,131 |
Washington | 22,579 | 59.51% | 14,769 | 38.93% | 594 | 1.57% | 7,810 | 20.58% | 37,942 |
Wayne | 3,370 | 63.51% | 1,859 | 35.04% | 77 | 1.45% | 1,511 | 28.47% | 5,306 |
Weakley | 6,106 | 51.55% | 5,570 | 47.03% | 168 | 1.42% | 536 | 4.52% | 11,844 |
White | 3,525 | 45.34% | 4,135 | 53.18% | 115 | 1.48% | -610 | -7.84% | 7,775 |
Williamson | 38,901 | 66.58% | 18,745 | 32.08% | 783 | 1.34% | 20,156 | 34.50% | 58,429 |
Wilson | 18,844 | 52.47% | 16,561 | 46.11% | 511 | 1.42% | 2,283 | 6.36% | 35,916 |
Totals | 1,061,949 | 51.15% | 981,720 | 47.28% | 32,512 | 1.57% | 80,229 | 3.87% | 2,076,181 |
Bush won 6 of the 9 congressional districts, including one held by a Democrat. [8]
District | Bush | Gore | Representative |
---|---|---|---|
1st | 61% | 38% | Bill Jenkins |
2nd | 59% | 39% | Jimmy Duncan |
3rd | 57% | 41% | Zach Wamp |
4th | 50% | 49% | Van Hilleary |
5th | 42% | 57% | Bob Clement |
6th | 49% | 49% | Bart Gordon |
7th | 59% | 40% | Ed Bryant |
8th | 48% | 51% | John S. Tanner |
9th | 36% | 63% | Harold Ford Jr. |
The electors of each state and the District of Columbia met on December 18, 2000 [9] to cast their votes for president and vice president. The Electoral College itself never meets as one body. Instead the electors from each state and the District of Columbia met in their respective capitols.
The following were the members of the Electoral College from the state. All were pledged to and voted for George Bush and Dick Cheney: [10]
The 2004 United States presidential election in California took place on November 2, 2004, and was part of the 2004 United States presidential election. Voters chose 55 representatives, or electors to the Electoral College, who voted for president and vice president.
The 2000 United States presidential election in New York took place on November 7, 2000, as part of the 2000 United States presidential election. Voters chose 33 representatives, or electors to the Electoral College, who voted for president and vice president.
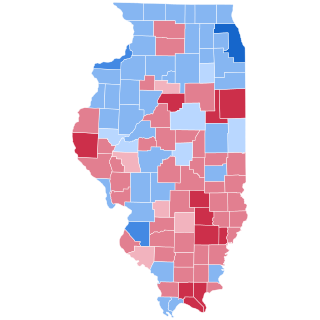
The 2004 United States presidential election in Illinois took place on November 2, 2004, and was part of the 2004 United States presidential election. Voters chose 21 representatives, or electors to the Electoral College, who voted for president and vice president.
The 2004 United States presidential election in Pennsylvania took place on November 2, 2004, and was part of the 2004 United States presidential election. Voters chose 21 representatives, or electors to the Electoral College, who voted for president and vice president.
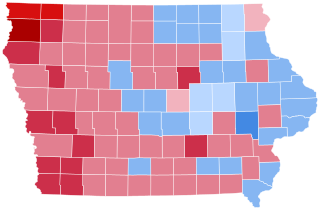
The 2004 United States presidential election in Iowa took place on November 2, 2004, as part of the 2004 United States presidential election in which all 50 states plus the District of Columbia participated. Voters chose seven electors to represent them in the Electoral College via a popular vote pitting incumbent Republican President George W. Bush and his running mate, Vice President Dick Cheney, against Democratic challenger and Senator from Massachusetts John F. Kerry and his running mate, Senator from North Carolina John Edwards. Six third parties were also on the ballot.
The 2004 United States presidential election in New Jersey took place on November 2, 2004, and was part of the 2004 United States presidential election. Voters chose 15 representatives, or electors to the Electoral College, who voted for president and vice president.
The 2004 United States presidential election in Arkansas took place on November 2, 2004, and was part of the 2004 United States presidential election. State voters chose six representatives, or electors to the Electoral College, who voted for president and vice president.
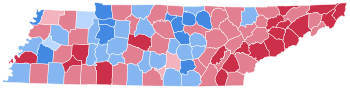
The 2004 United States presidential election in Tennessee was held on November 2, 2004, and was part of the 2004 United States presidential election. Voters chose 11 representatives, or electors, to the Electoral College, who voted for president and vice president.
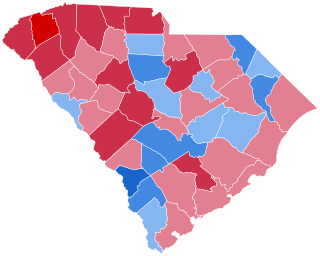
The 2004 United States presidential election in South Carolina took place on November 2, 2004, as part of the 2004 United States presidential election which took place throughout all 50 states and D.C. Voters chose eight representatives, or electors to the Electoral College, who voted for president and vice president.
The 2000 United States presidential election in California took place on November 7, 2000, as part of the wider 2000 United States presidential election. Voters chose 54 representatives, or electors to the Electoral College, who voted for president and vice president.
The 2008 United States presidential election in Illinois took place on November 4, 2008, and was part of the 2008 United States presidential election. Voters chose 21 representatives, or electors to the Electoral College, who voted for president and vice president.
The 2008 United States presidential election in Florida took place on November 4, 2008, and was part of the 2008 United States presidential election. Voters chose 27 representatives, or electors to the Electoral College, who voted for president and vice president.
The 2008 United States presidential election in Tennessee was held on November 4, 2008, and was part of the 2008 United States presidential election. Voters chose 11 representatives, or electors, to the Electoral College, who voted for president and vice president.
The 2000 United States presidential election in Iowa took place on November 7, 2000, and was part of the 2000 United States presidential election. Voters chose seven representatives, or electors to the Electoral College, who voted for President and Vice President.
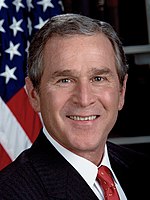
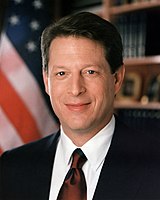
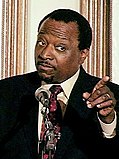
The 2000 United States presidential election in New Hampshire took place on Election Day on November 7, 2000 as part of the 2000 United States presidential election. The two major candidates were Texas Governor George W. Bush of the Republican Party and Vice President Al Gore of the Democratic Party. When all votes were tallied, Bush was declared the winner with a plurality of the vote over Gore, receiving 48% of the vote to Gore's 47%, while Green Party candidate Ralph Nader received almost 4% of the vote in the state. Bush went on to win the election nationwide. Had incumbent Gore come out victorious in New Hampshire with its four electoral votes, he would have won the presidency, regardless of the outcome of Bush v. Gore.
The 2000 United States presidential election in West Virginia took place on November 7, 2000 as part of the 2000 United States presidential election. Voters chose 5 representatives, or electors to the Electoral College, who voted for president and vice president.
The 2000 United States presidential election in Illinois took place on November 7, 2000, and was part of the 2000 United States presidential election. Voters chose 22 representatives, or electors to the Electoral College, who voted for president and vice president.
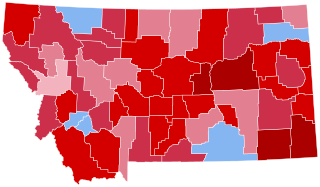
The 2000 United States presidential election in Montana took place on November 7, 2000, and was part of the 2000 United States presidential election. Voters chose three electors to the Electoral College, which voted for president and vice president.
The 2000 United States presidential election in Pennsylvania took place on November 7, 2000, and was part of the 2000 United States presidential election. Voters chose 23 representatives, or electors to the Electoral College, who voted for president and vice president.
The 2000 United States presidential election in South Carolina took place on November 7, 2000, and was part of the 2000 United States presidential election. Voters chose 8 representatives, or electors to the Electoral College, who voted for president and vice president.