| |||||||||||||||||||||||||||||||||||||||||||||
99 Seats in the Tennessee House of Representatives 50 seats needed for a majority | |||||||||||||||||||||||||||||||||||||||||||||
---|---|---|---|---|---|---|---|---|---|---|---|---|---|---|---|---|---|---|---|---|---|---|---|---|---|---|---|---|---|---|---|---|---|---|---|---|---|---|---|---|---|---|---|---|---|
| |||||||||||||||||||||||||||||||||||||||||||||
Results: Democratic gain Republican gain Democratic hold Republican hold Vote Share: 50–60% 60–70% 70–80% 80–90% >90% 50–60% 60–70% 70–80% >90% | |||||||||||||||||||||||||||||||||||||||||||||
|
Elections in Tennessee |
---|
Government |
The 2022 Tennessee House of Representatives election was held on November 8, 2022, to elect 99 seats for the Tennessee House of Representatives. The elections coincided with the Governor, U.S. House, and State Senate elections.
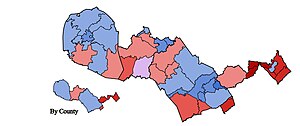
Republicans gained two seats, thereby further expanding their supermajority in the state house. John Windle lost his re-election bid after registering as an Independent.
Source | Ranking | As of |
---|---|---|
Sabato's Crystal Ball [14] | Safe R | May 19, 2022 |
Party | Candidates | Votes | Seats | ||||||
---|---|---|---|---|---|---|---|---|---|
No. | % | No. | +/– | ||||||
Republican | 81 | 1,077,324 | 70.48 | 75 | 2 | ||||
Democratic | 54 | 410,589 | 26.86 | 24 | 1 | ||||
Independent | 12 | 39,777 | 2.60 | 0 | 1 | ||||
Write-in | 804 | 0.05 | 0 | ||||||
Total | 1,528,494 | 100.00 | 99 | ||||||
Source: |
Four races were decided by a margin of 10% or less:
District | Winner | Margin |
---|---|---|
District 67 | Democratic | 1.34% |
District 59 | Democratic | 4.76% |
District 41 | Republican (flip) | 5.1% |
District 18 | Republican | 8.22% |
District | Incumbent | Results | Candidates [15] | ||
---|---|---|---|---|---|
Representative | Party | Electoral history | |||
District 1 | John Crawford | Republican | 2016 | Incumbent re-elected. |
|
District 2 | Bud Hulsey | Republican | 2014 | Incumbent re-elected. |
|
District 3 | Scotty Campbell | Republican | 2020 | Incumbent re-elected. |
|
District 4 | John Holsclaw Jr. | Republican | 2014 | Incumbent re-elected. |
|
District 5 | David Hawk | Republican | 2002 | Incumbent re-elected. |
|
District 6 | Tim Hicks | Republican | 2020 | Incumbent re-elected. |
|
District 7 | Rebecca Alexander | Republican | 2020 | Incumbent re-elected. |
|
District 8 | Jerome Moon | Republican | 2017 | Incumbent re-elected. |
|
District 9 | Gary Hicks | Republican | 2016 | Incumbent re-elected. |
|
District 10 | Rick Eldridge | Republican | 2018 | Incumbent re-elected. |
|
District 11 | Jeremy Faison | Republican | 2010 | Incumbent re-elected. |
|
District 12 | Dale Carr | Republican | 2012 | Incumbent re-elected. |
|
District 13 | None (New seat) | New seat. New member elected. Republican gain. |
| ||
District 14 | Jason Zachary | Republican | 2015 | Incumbent re-elected. |
|
District 15 | Sam McKenzie | Democratic | 2020 | Incumbent re-elected. |
|
District 16 | Michele Carringer | Republican | 2020 | Incumbent re-elected. |
|
District 17 | Andrew Farmer | Republican | 2012 | Incumbent re-elected. |
|
District 18 | Eddie Mannis | Republican | 2020 | Incumbent retired. New member elected. Republican hold. |
|
District 19 | Dave Wright Redistricted from the 18th district | Republican | 2018 | Incumbent re-elected. |
|
District 20 | Bob Ramsey | Republican | 2008 | Incumbent lost renomination. New member elected. Republican hold. |
|
District 21 | Lowell Russell | Republican | 2018 | Incumbent re-elected. |
|
District 22 | Dan Howell | Republican | 2014 | Incumbent re-elected. |
|
District 23 | Mark Cochran | Republican | 2018 | Incumbent re-elected. |
|
District 24 | Mark Hall | Republican | 2018 | Incumbent retired to run for State Senate. New member elected. Republican hold. |
|
District 25 | Cameron Sexton | Republican | 2010 | Incumbent re-elected. |
|
District 26 | Greg Martin | Republican | 2022 (appointed) [17] | Incumbent elected. |
|
District 27 | Patsy Hazlewood | Republican | 2014 | Incumbent re-elected. |
|
District 28 | Yusuf Hakeem | Democratic | 2018 | Incumbent re-elected. |
|
District 29 | Greg Vital | Republican | 2021 | Incumbent re-elected. |
|
District 30 | Esther Helton | Republican | 2018 | Incumbent re-elected. |
|
District 31 | Ron Travis | Republican | 2012 | Incumbent re-elected. |
|
District 32 | Kent Calfee | Republican | 2012 | Incumbent retired. New member elected. Republican hold. |
|
District 33 | John Ragan | Republican | 2010 | Incumbent re-elected. |
|
District 34 | Tim Rudd | Republican | 2016 | Incumbent re-elected. |
|
District 35 | Jerry Sexton | Republican | 2014 | Incumbent retired. New member elected. Republican hold. |
|
District 36 | Dennis Powers | Republican | 2010 | Incumbent re-elected. |
|
District 37 | Charlie Baum | Republican | 2018 | Incumbent re-elected. |
|
District 38 | Kelly Keisling | Republican | 2010 | Incumbent re-elected. |
|
District 39 | Iris Rudder | Republican | 2018 | Incumbent re-elected. |
|
District 40 | Terri Lynn Weaver | Republican | 2008 | Incumbent lost renomination. New member elected. Republican hold. |
|
District 41 | John Windle | Independent | 1990 | Incumbent lost re-election. New member elected. Republican gain. |
|
District 42 | Ryan Williams | Republican | 2010 | Incumbent re-elected. |
|
District 43 | Paul Sherrell | Republican | 2016 | Incumbent re-elected. |
|
District 44 | William Lamberth | Republican | 2012 | Incumbent re-elected. |
|
District 45 | Johnny Garrett | Republican | 2018 | Incumbent re-elected. |
|
District 46 | Clark Boyd | Republican | 2018 | Incumbent re-elected. |
|
District 47 | Rush Bricken | Republican | 2018 | Incumbent re-elected. |
|
District 48 | Bryan Terry | Republican | 2018 | Incumbent re-elected. |
|
District 49 | Mike Sparks | Republican | 2018 | Incumbent re-elected. |
|
District 50 | Bo Mitchell | Democratic | 2012 | Incumbent re-elected. |
|
District 51 | Bill Beck | Democratic | 2014 | Incumbent re-elected. |
|
District 52 | Mike Stewart | Democratic | 2008 | Incumbent retired. New member elected. Democratic hold. |
|
District 53 | Jason Powell | Democratic | 2012 | Incumbent re-elected. |
|
District 54 | Vincent Dixie | Democratic | 2018 | Incumbent re-elected. |
|
District 55 | John Ray Clemmons | Democratic | 2014 | Incumbent re-elected. |
|
District 56 | Bob Freeman | Democratic | 2018 | Incumbent re-elected. |
|
District 57 | Susan Lynn | Republican | 2013 | Incumbent re-elected. |
|
District 58 | Harold M. Love Jr. | Democratic | 2012 | Incumbent re-elected. |
|
District 59 | Jason Potts | Democratic | 2018 | Incumbent retired. New member elected. Democratic hold. |
|
District 60 | Darren Jernigan | Democratic | 2012 | Incumbent re-elected. |
|
District 61 | Brandon Ogles | Republican | 2018 | Incumbent retired. New member elected. Republican hold. |
|
District 62 | Pat Marsh | Republican | 2009 | Incumbent re-elected. |
|
District 63 | Glen Casada | Republican | 2001 | Incumbent retired to run for Williamson County Clerk. New member elected. Republican hold. |
|
District 64 | Scott Cepicky | Republican | 2018 | Incumbent re-elected. |
|
District 65 | Sam Whitson | Republican | 2016 | Incumbent re-elected. |
|
District 66 | Sabi "Doc" Kumar | Republican | 2014 | Incumbent re-elected. |
|
District 67 | Jason Hodges | Democratic | 2018 | Incumbent retired. New member elected. Democratic hold. |
|
District 68 | Curtis Johnson | Republican | 2014 | Incumbent re-elected. |
|
District 69 | Michael Curcio | Republican | 2018 | Incumbent retired. New member elected. Republican hold. |
|
District 70 | Clay Doggett | Republican | 2018 | Incumbent re-elected. |
|
District 71 | David Byrd | Republican | 2014 | Incumbent retired. New member elected. Republican hold. |
|
District 72 | Kirk Haston | Republican | 2018 | Incumbent re-elected. |
|
District 73 | Chris Todd | Republican | 2018 | Incumbent re-elected. |
|
District 74 | Jay Reedy | Republican | 2014 | Incumbent re-elected. |
|
District 75 | Bruce Griffey | Republican | 2018 | Incumbent retired. New member elected. Republican hold. |
|
District 76 | Tandy Darby | Republican | 2020 | Incumbent re-elected. |
|
District 77 | Rusty Grills | Republican | 2020 | Incumbent re-elected. |
|
District 78 | Mary Littleton | Republican | 2012 | Incumbent re-elected. |
|
District 79 | Curtis Halford | Republican | 2018 | Incumbent retired. New member elected. Republican hold. |
|
District 80 | Johnny Shaw | Democratic | 2000 | Incumbent re-elected. |
|
District 81 | Debra Moody | Republican | 2012 | Incumbent re-elected. |
|
District 82 | Chris Hurt | Republican | 2018 | Incumbent re-elected. |
|
District 83 | Mark White | Republican | 2010 | Incumbent re-elected. |
|
District 84 | Joe Towns | Democratic | 1994 | Incumbent re-elected. |
|
District 85 | Jesse Chism | Democratic | 2018 | Incumbent re-elected. |
|
District 86 | Barbara Cooper | Democratic | 1996 | Incumbent re-elected. |
|
District 87 | Karen Camper | Democratic | 2008 | Incumbent re-elected. |
|
District 88 | Larry Miller | Democratic | 2008 | Incumbent re-elected. |
|
District 89 | Justin Lafferty | Republican | 2018 | Incumbent re-elected. |
|
District 90 | Gloria Johnson Redistricted from the 13th district | Democratic | 2018 | Incumbent re-elected. |
|
District 91 | Torrey Harris Redistricted from the 90th district | Democratic | 2020 | Incumbent re-elected. |
|
District 92 | Todd Warner | Republican | 2020 | Incumbent re-elected. |
|
District 93 | G. A. Hardaway | Democratic | 2006 | Incumbent re-elected. |
|
District 94 | Ron Gant | Republican | 2016 | Incumbent re-elected. |
|
District 95 | Kevin Vaughan | Republican | 2017 | Incumbent re-elected. |
|
District 96 | Dwayne Thompson | Democratic | 2016 | Incumbent re-elected. |
|
District 97 | John Gillespie | Republican | 2017 | Incumbent re-elected. |
|
District 98 | Antonio Parkinson | Democratic | 2011 | Incumbent re-elected. |
|
District 99 | Tom Leatherwood | Republican | 2018 | Incumbent re-elected. |
|
Party | Candidate | Votes | % | |
---|---|---|---|---|
Republican | John Crawford (incumbent) | 1,825 | 100.00% | |
Total votes | 1,825 | 100.00% |
Party | Candidate | Votes | % | |
---|---|---|---|---|
Republican | John Crawford (incumbent) | 13,370 | 99.29% | |
Write-in | 96 | 0.71% | ||
Total votes | 13,466 | 100.00% | ||
Republican hold | ||||
Party | Candidate | Votes | % | |
---|---|---|---|---|
Republican | Bud Hulsey (incumbent) | 2,986 | 100.00% | |
Total votes | 2,986 | 100.00% |
Party | Candidate | Votes | % | |
---|---|---|---|---|
Republican | Bud Hulsey (incumbent) | 15,359 | 99.59% | |
Write-in | 63 | 0.41% | ||
Total votes | 15,422 | 100.00% | ||
Republican hold | ||||
Party | Candidate | Votes | % | |
---|---|---|---|---|
Republican | Scotty Campbell (incumbent) | 5,758 | 100.00% | |
Total votes | 5,758 | 100.00% |
Party | Candidate | Votes | % | |
---|---|---|---|---|
Republican | Scotty Campbell (incumbent) | 15,667 | 99.81% | |
Independent | Arvil Love (write-in) | 30 | 0.19% | |
Total votes | 15,697 | 100.00% | ||
Republican hold | ||||
Party | Candidate | Votes | % | |
---|---|---|---|---|
Republican | John B. Holsclaw Jr (incumbent) | 5,362 | 100.00% | |
Total votes | 5,362 | 100.00% |
Party | Candidate | Votes | % | |
---|---|---|---|---|
Republican | John B. Holsclaw Jr (incumbent) | 14,882 | 100.00% | |
Total votes | 14,882 | 100.00% | ||
Republican hold | ||||
Party | Candidate | Votes | % | |
---|---|---|---|---|
Republican | David B. Hawk (incumbent) | 3,197 | 100.00% | |
Total votes | 3,197 | 100.00% |
Party | Candidate | Votes | % | |
---|---|---|---|---|
Republican | David B. Hawk (incumbent) | 14,852 | 100.00% | |
Total votes | 14,852 | 100.00% | ||
Republican hold | ||||
Party | Candidate | Votes | % | |
---|---|---|---|---|
Republican | Tim Hicks (incumbent) | 3,980 | 100.00% | |
Total votes | 3,980 | 100.00% |
Party | Candidate | Votes | % | |
---|---|---|---|---|
Republican | Tim Hicks (incumbent) | 13,980 | 76.55% | |
Independent | Joel Goodman | 4,283 | 23.45% | |
Total votes | 18,263 | 100.00% | ||
Republican hold | ||||
Party | Candidate | Votes | % | |
---|---|---|---|---|
Republican | Rebecca K. Alexander (incumbent) | 3,895 | 100.00% | |
Total votes | 3,895 | 100.00% |
Party | Candidate | Votes | % | |
---|---|---|---|---|
Republican | Rebecca K. Alexander (incumbent) | 12,411 | 100.00% | |
Total votes | 12,411 | 100.00% | ||
Republican hold | ||||
Party | Candidate | Votes | % | |
---|---|---|---|---|
Republican | Jerome Moon (incumbent) | 4,331 | 100.00% | |
Total votes | 4,331 | 100.00% |
Party | Candidate | Votes | % | |
---|---|---|---|---|
Democratic | Dylan D. Kelley | 1,191 | 100.00% | |
Total votes | 1,191 | 100.00% |
Party | Candidate | Votes | % | |
---|---|---|---|---|
Republican | Jerome Moon (incumbent) | 15,702 | 78.85% | |
Democratic | Dylan D. Kelley | 3,846 | 19.31% | |
Independent | Sue DuBois (write-in) | 365 | 1.83% | |
Total votes | 19,913 | 100.00% | ||
Republican hold | ||||
Party | Candidate | Votes | % | |
---|---|---|---|---|
Republican | Gary W Hicks Jr (incumbent) | 5,905 | 100.00% | |
Total votes | 5,905 | 100.00% |
Party | Candidate | Votes | % | |
---|---|---|---|---|
Republican | Gary W Hicks Jr (incumbent) | 13,100 | 100.00% | |
Total votes | 13,100 | 100.00% | ||
Republican hold | ||||
Party | Candidate | Votes | % | |
---|---|---|---|---|
Republican | Rick Eldridge (incumbent) | 3,203 | 74.70% | |
Republican | Donel Shelton | 1,085 | 25.30% | |
Total votes | 4,288 | 100.00% |
Party | Candidate | Votes | % | |
---|---|---|---|---|
Republican | Rick Eldridge (incumbent) | 12,258 | 99.05% | |
Independent | Alex Harbaugh (write-in) | 118 | 0.95% | |
Total votes | 12,376 | 100.00% | ||
Republican hold | ||||
Party | Candidate | Votes | % | |
---|---|---|---|---|
Republican | Jeremy Faison (incumbent) | 6,513 | 100.00% | |
Total votes | 6,513 | 100.00% |
Party | Candidate | Votes | % | |
---|---|---|---|---|
Republican | Jeremy Faison (incumbent) | 13,522 | 99.08% | |
Independent | Joseph Winchester Stout (write-in) | 126 | 0.92% | |
Total votes | 13,648 | 100.00% | ||
Republican hold | ||||
Party | Candidate | Votes | % | |
---|---|---|---|---|
Republican | Dale Carr (incumbent) | 2,028 | 100.00% | |
Total votes | 2,028 | 100.00% |
Party | Candidate | Votes | % | |
---|---|---|---|---|
Republican | Dale Carr (incumbent) | 12,646 | 81.86% | |
Independent | Larry Linton | 2,796 | 18.10% | |
Independent | Mariah Marie Mercedes Bailey (write-in) | 6 | 0.04% | |
Total votes | 15,448 | 100.00% | ||
Republican hold | ||||
Party | Candidate | Votes | % | |
---|---|---|---|---|
Republican | Robert Stevens | 2,062 | 60.19% | |
Republican | Gabriel Fancher | 1,364 | 39.81% | |
Total votes | 3,426 | 100.00% |
Party | Candidate | Votes | % | |
---|---|---|---|---|
Democratic | Jeff Crum | 1,499 | 100.00% | |
Total votes | 1,499 | 100.00% |
Party | Candidate | Votes | % | ||
---|---|---|---|---|---|
Republican | Robert Stevens | 8,672 | 62.02% | ||
Democratic | Jeff Crum | 5,311 | 37.98% | ||
Total votes | 13,983 | 100.00% | |||
Republican win (new seat) |
Party | Candidate | Votes | % | |
---|---|---|---|---|
Republican | Jason Zachary (incumbent) | 6,361 | 100.00% | |
Total votes | 6,361 | 100.00% |
Party | Candidate | Votes | % | |
---|---|---|---|---|
Democratic | Amanda Collins | 3,204 | 100.00% | |
Total votes | 3,204 | 100.00% |
Party | Candidate | Votes | % | |
---|---|---|---|---|
Republican | Jason Zachary (incumbent) | 16,661 | 64.36% | |
Democratic | Amanda Collins | 9,227 | 35.64% | |
Total votes | 25,888 | 100.00% | ||
Republican hold | ||||
Party | Candidate | Votes | % | |
---|---|---|---|---|
Republican | Pete Drew | 1,047 | 100.00% | |
Total votes | 1,047 | 100.00% |
Party | Candidate | Votes | % | |
---|---|---|---|---|
Democratic | Sam McKenzie (incumbent) | 3,104 | 100.00% | |
Total votes | 3,104 | 100.00% |
Party | Candidate | Votes | % | |
---|---|---|---|---|
Democratic | Sam McKenzie (incumbent) | 7,246 | 70.98% | |
Republican | Pete Drew | 2,963 | 29.02% | |
Total votes | 10,209 | 100.00% | ||
Democratic hold | ||||
Party | Candidate | Votes | % | |
---|---|---|---|---|
Republican | Michele Carringer (incumbent) | 4,575 | 100.00% | |
Total votes | 4,575 | 100.00% |
Party | Candidate | Votes | % | |
---|---|---|---|---|
Republican | Michele Carringer (incumbent) | 13,852 | 100.00% | |
Total votes | 13,852 | 100.00% | ||
Republican hold | ||||
Party | Candidate | Votes | % | |
---|---|---|---|---|
Republican | Andrew Ellis Farmer (incumbent) | 2,604 | 100.00% | |
Total votes | 2,604 | 100.00% |
Party | Candidate | Votes | % | |
---|---|---|---|---|
Republican | Andrew Ellis Farmer (incumbent) | 13,085 | 100.00% | |
Total votes | 13,085 | 100.00% | ||
Republican hold | ||||
Party | Candidate | Votes | % | |
---|---|---|---|---|
Republican | Elaine Davis | 3,529 | 55.89% | |
Republican | Janet Testerman | 2,785 | 44.11% | |
Total votes | 6,314 | 100.00% |
Party | Candidate | Votes | % | |
---|---|---|---|---|
Democratic | Gregory B. Kaplan | 3,780 | 100.00% | |
Total votes | 3,780 | 100.00% |
Party | Candidate | Votes | % | |
---|---|---|---|---|
Republican | Elaine Davis | 11,604 | 54.10% | |
Democratic | Gregory B. Kaplan | 9,846 | 45.90% | |
Total votes | 21,450 | 100.00% | ||
Republican hold | ||||
Party | Candidate | Votes | % | |
---|---|---|---|---|
Republican | Dave Wright (incumbent) | 4,261 | 100.00% | |
Total votes | 4,261 | 100.00% |
Party | Candidate | Votes | % | |
---|---|---|---|---|
Democratic | Zeke Streetman | 1,447 | 100.00% | |
Total votes | 1,447 | 100.00% |
Party | Candidate | Votes | % | |
---|---|---|---|---|
Republican | Dave Wright (incumbent) | 13,181 | 74.76% | |
Democratic | Zeke Streetman | 3,823 | 21.68% | |
Independent | Mary Ann Rochat | 626 | 3.55% | |
Total votes | 17,630 | 100.00% | ||
Republican hold | ||||
Party | Candidate | Votes | % | |
---|---|---|---|---|
Republican | Bryan Richey | 3,803 | 64.84% | |
Republican | Bob Ramsey (incumbent) | 2,062 | 35.16% | |
Total votes | 5,865 | 100.00% |
Party | Candidate | Votes | % | |
---|---|---|---|---|
Republican | Bryan Richey | 14,568 | 100.00% | |
Total votes | 14,568 | 100.00% | ||
Republican hold | ||||
Party | Candidate | Votes | % | |
---|---|---|---|---|
Republican | Lowell Russell (incumbent) | 6,790 | 100.00% | |
Total votes | 6,790 | 100.00% |
Party | Candidate | Votes | % | |
---|---|---|---|---|
Republican | Lowell Russell (incumbent) | 18,442 | 100.00% | |
Total votes | 18,442 | 100.00% | ||
Republican hold | ||||
Party | Candidate | Votes | % | |
---|---|---|---|---|
Republican | Dan Howell (incumbent) | 5,997 | 100.00% | |
Total votes | 5,997 | 100.00% |
Party | Candidate | Votes | % | |
---|---|---|---|---|
Republican | Dan Howell (incumbent) | 15,543 | 100.00% | |
Total votes | 15,543 | 100.00% | ||
Republican hold | ||||
Party | Candidate | Votes | % | |
---|---|---|---|---|
Republican | Mark Cochran (incumbent) | 5,815 | 100.00% | |
Total votes | 5,815 | 100.00% |
Party | Candidate | Votes | % | |
---|---|---|---|---|
Republican | Mark Cochran (incumbent) | 14,393 | 100.00% | |
Total votes | 14,393 | 100.00% | ||
Republican hold | ||||
Party | Candidate | Votes | % | |
---|---|---|---|---|
Republican | Kevin D. Raper | 2,170 | 38.70% | |
Republican | Troy Weathers | 1,924 | 34.31% | |
Republican | Israel David Farless | 783 | 13.96% | |
Republican | Rex Wagner | 730 | 13.02% | |
Total votes | 5,607 | 100.00% |
Party | Candidate | Votes | % | |
---|---|---|---|---|
Republican | Kevin D. Raper | 12,448 | 100.00% | |
Total votes | 12,448 | 100.00% | ||
Republican hold | ||||
Party | Candidate | Votes | % | |
---|---|---|---|---|
Republican | Cameron Sexton (incumbent) | 7,893 | 100.00% | |
Total votes | 7,893 | 100.00% |
Party | Candidate | Votes | % | |
---|---|---|---|---|
Democratic | Anne Quillen | 1,211 | 100.00% | |
Total votes | 1,211 | 100.00% |
Party | Candidate | Votes | % | |
---|---|---|---|---|
Republican | Cameron Sexton (incumbent) | 19,657 | 82.79% | |
Democratic | Anne Quillen | 4,088 | 17.21% | |
Total votes | 23,745 | 100.00% | ||
Republican hold | ||||
Party | Candidate | Votes | % | |
---|---|---|---|---|
Republican | Greg Martin (incumbent) | 6,881 | 100.00% | |
Total votes | 6,881 | 100.00% |
Party | Candidate | Votes | % | |
---|---|---|---|---|
Democratic | Allison Gorman | 3,090 | 86.36% | |
Democratic | Tim Roberts | 488 | 13.64% | |
Total votes | 3,578 | 100.00% |
Party | Candidate | Votes | % | |
---|---|---|---|---|
Republican | Greg Martin (incumbent) | 15,039 | 63.87% | |
Democratic | Allison Gorman | 8,506 | 36.13% | |
Total votes | 23,545 | 100.00% | ||
Republican hold | ||||
Party | Candidate | Votes | % | |
---|---|---|---|---|
Republican | Patsy Hazlewood (incumbent) | 6,722 | 100.00% | |
Total votes | 6,722 | 100.00% |
Party | Candidate | Votes | % | |
---|---|---|---|---|
Republican | Patsy Hazlewood (incumbent) | 15,431 | 70.75% | |
Independent | Michael Potter | 6,380 | 29.25% | |
Total votes | 21,811 | 100.00% | ||
Republican hold | ||||
Party | Candidate | Votes | % | |
---|---|---|---|---|
Democratic | Yusuf Hakeem (incumbent) | 4,982 | 100.00% | |
Total votes | 4,982 | 100.00% |
Party | Candidate | Votes | % | |
---|---|---|---|---|
Democratic | Yusuf Hakeem (incumbent) | 10,521 | 100.00% | |
Total votes | 10,521 | 100.00% | ||
Democratic hold | ||||
Party | Candidate | Votes | % | |
---|---|---|---|---|
Republican | Greg Vital (incumbent) | 6,040 | 100.00% | |
Total votes | 6,040 | 100.00% |
Party | Candidate | Votes | % | |
---|---|---|---|---|
Republican | Greg Vital (incumbent) | 15,659 | 100.00% | |
Total votes | 15,659 | 100.00% | ||
Republican hold | ||||
Party | Candidate | Votes | % | |
---|---|---|---|---|
Republican | Esther Helton (incumbent) | 4,647 | 100.00% | |
Total votes | 4,647 | 100.00% |
Party | Candidate | Votes | % | |
---|---|---|---|---|
Republican | Esther Helton (incumbent) | 13,616 | 100.00% | |
Total votes | 13,616 | 100.00% | ||
Republican hold | ||||
Party | Candidate | Votes | % | |
---|---|---|---|---|
Republican | Ron Travis (incumbent) | 7,799 | 100.00% | |
Total votes | 7,799 | 100.00% |
Party | Candidate | Votes | % | |
---|---|---|---|---|
Democratic | David L. Brown | 950 | 100.00% | |
Total votes | 950 | 100.00% |
Party | Candidate | Votes | % | |
---|---|---|---|---|
Republican | Ron Travis (incumbent) | 14,646 | 86.33% | |
Democratic | David L. Brown | 2,320 | 13.67% | |
Total votes | 16,966 | 100.00% | ||
Republican hold | ||||
Party | Candidate | Votes | % | |
---|---|---|---|---|
Republican | Monty Fritts | 3,071 | 33.76% | |
Republican | Teresa Pesterfield Kirkham | 2,256 | 24.80% | |
Republican | Keaton Bowman | 1,643 | 18.06% | |
Republican | Donnie Hall | 1,325 | 14.56% | |
Republican | Randy Childs | 709 | 8.82% | |
Total votes | 9,098 | 100.00% |
Party | Candidate | Votes | % | |
---|---|---|---|---|
Democratic | Jan Hahn | 1,602 | 100.00% | |
Total votes | 1,602 | 100.00% |
Party | Candidate | Votes | % | |
---|---|---|---|---|
Republican | Monty Fritts | 15,735 | 76.73% | |
Democratic | Jan Hahn | 4,772 | 23.27% | |
Total votes | 20,507 | 100.00% | ||
Republican hold | ||||
Party | Candidate | Votes | % | |
---|---|---|---|---|
Republican | John Ragan (incumbent) | 4,401 | 100.00% | |
Total votes | 4,401 | 100.00% |
Party | Candidate | Votes | % | |
---|---|---|---|---|
Democratic | Jim Dodson | 1,915 | 81.77% | |
Democratic | James Brewer | 427 | 18.23% | |
Total votes | 2,342 | 100.00% |
Party | Candidate | Votes | % | |
---|---|---|---|---|
Republican | John Ragan (incumbent) | 11,093 | 61.72% | |
Democratic | Jim Dodson | 6,878 | 38.28% | |
Total votes | 20,507 | 100.00% | ||
Republican hold | ||||
Party | Candidate | Votes | % | |
---|---|---|---|---|
Republican | Tim Rudd (incumbent) | 3,240 | 100.00% | |
Total votes | 3,240 | 100.00% |
Party | Candidate | Votes | % | |
---|---|---|---|---|
Democratic | Laura Bohling | 1,862 | 100.00% | |
Total votes | 1,862 | 100.00% |
Party | Candidate | Votes | % | |
---|---|---|---|---|
Republican | Tim Rudd (incumbent) | 9,142 | 61.08% | |
Democratic | Laura Bohling | 5,827 | 38.92% | |
Total votes | 14,969 | 100.00% | ||
Republican hold | ||||
Party | Candidate | Votes | % | |
---|---|---|---|---|
Republican | William Slater | 3,351 | 52.67% | |
Republican | Deanne DeWitt | 1,684 | 26.46% | |
Republican | Joe Kirkpatrick | 1,328 | 20.87% | |
Total votes | 6,363 | 100.00% |
Party | Candidate | Votes | % | |
---|---|---|---|---|
Republican | William Slater | 13,158 | 100.00% | |
Total votes | 13,158 | 100.00% | ||
Republican hold | ||||
Party | Candidate | Votes | % | |
---|---|---|---|---|
Republican | Dennis Powers (incumbent) | 8,929 | 100.00% | |
Total votes | 8,929 | 100.00% |
Party | Candidate | Votes | % | |
---|---|---|---|---|
Republican | Dennis Powers (incumbent) | 11,892 | 100.00% | |
Total votes | 11,892 | 100.00% | ||
Republican hold | ||||
Party | Candidate | Votes | % | |
---|---|---|---|---|
Republican | Charlie Baum (incumbent) | 3,658 | 100.00% | |
Total votes | 3,658 | 100.00% |
Party | Candidate | Votes | % | |
---|---|---|---|---|
Democratic | Bill Levine | 1,587 | 100.00% | |
Total votes | 1,587 | 100.00% |
Party | Candidate | Votes | % | |
---|---|---|---|---|
Republican | Charlie Baum (incumbent) | 9,456 | 65.44% | |
Democratic | Bill Levine | 4,993 | 34.56% | |
Total votes | 14,449 | 100.00% | ||
Republican hold | ||||
Party | Candidate | Votes | % | |
---|---|---|---|---|
Republican | Kelly Keisling (incumbent) | 9,734 | 100.00% | |
Total votes | 9,734 | 100.00% |
Party | Candidate | Votes | % | |
---|---|---|---|---|
Republican | Kelly Keisling (incumbent) | 13,006 | 100.00% | |
Total votes | 13,006 | 100.00% | ||
Republican hold | ||||
Party | Candidate | Votes | % | |
---|---|---|---|---|
Republican | Iris Rudder (incumbent) | 6,924 | 100.00% | |
Total votes | 6,924 | 100.00% |
Party | Candidate | Votes | % | |
---|---|---|---|---|
Democratic | Bruce Manuel | 2,148 | 100.00% | |
Total votes | 2,148 | 100.00% |
Party | Candidate | Votes | % | |
---|---|---|---|---|
Republican | Iris Rudder (incumbent) | 14,207 | 76.73% | |
Democratic | Bruce Manuel | 4,309 | 23.27% | |
Total votes | 18,516 | 100.00% | ||
Republican hold | ||||
Party | Candidate | Votes | % | |
---|---|---|---|---|
Republican | Michael Hale | 6,698 | 59.58% | |
Republican | Terri Lynn Weaver (incumbent) | 4,544 | 40.42% | |
Total votes | 11,242 | 100.00% |
Party | Candidate | Votes | % | |
---|---|---|---|---|
Democratic | Tom Cook | 1,464 | 100.00% | |
Total votes | 1,464 | 100.00% |
Party | Candidate | Votes | % | |
---|---|---|---|---|
Republican | Michael Hale | 14,869 | 83.39% | |
Democratic | Tom Cook | 2,961 | 16.61% | |
Total votes | 17,830 | 100.00% | ||
Republican hold | ||||
Party | Candidate | Votes | % | |
---|---|---|---|---|
Republican | Ed Butler | 4,119 | 53.44% | |
Republican | Michael Swisher | 2,417 | 31.36% | |
Republican | Bradley Hayes | 1,172 | 15.20% | |
Total votes | 7,708 | 100.00% |
Party | Candidate | Votes | % | |
---|---|---|---|---|
Republican | Ed Butler | 9,079 | 52.59% | |
Independent | John Windle (incumbent) | 8,184 | 47.41% | |
Total votes | 17,263 | 100.00% | ||
Republican gain from Independent | ||||
Party | Candidate | Votes | % | |
---|---|---|---|---|
Republican | Ryan Williams (incumbent) | 4,926 | 100.00% | |
Total votes | 4,926 | 100.00% |
Party | Candidate | Votes | % | |
---|---|---|---|---|
Republican | Ryan Williams (incumbent) | 12,929 | 100.00% | |
Total votes | 12,929 | 100.00% | ||
Republican hold | ||||
Party | Candidate | Votes | % | |
---|---|---|---|---|
Republican | Paul Sherrell (incumbent) | 4,637 | 50.40% | |
Republican | Bobby Robinson | 4,564 | 49.60% | |
Total votes | 9,201 | 100.00% |
Party | Candidate | Votes | % | |
---|---|---|---|---|
Democratic | Cheryl Womack Uselton | 1,540 | 100.00% | |
Total votes | 1,540 | 100.00% |
Party | Candidate | Votes | % | |
---|---|---|---|---|
Republican | Paul Sherrell (incumbent) | 11,854 | 77.69% | |
Democratic | Cheryl Womack Uselton | 3,404 | 22.31% | |
Total votes | 15,258 | 100.00% | ||
Republican hold | ||||
Party | Candidate | Votes | % | |
---|---|---|---|---|
Republican | William Lamberth (incumbent) | 4,363 | 100.00% | |
Total votes | 4,363 | 100.00% |
Party | Candidate | Votes | % | |
---|---|---|---|---|
Democratic | Kesa Fowler | 1,008 | 100.00% | |
Total votes | 1,008 | 100.00% |
Party | Candidate | Votes | % | |
---|---|---|---|---|
Republican | William Lamberth (incumbent) | 13,884 | 78.13% | |
Democratic | Kesa Fowler | 3,887 | 21.87% | |
Total votes | 17,771 | 100.00% | ||
Republican hold | ||||
Party | Candidate | Votes | % | |
---|---|---|---|---|
Republican | Johnny C. Garrett (incumbent) | 3,868 | 100.00% | |
Total votes | 3,868 | 100.00% |
Party | Candidate | Votes | % | |
---|---|---|---|---|
Republican | Johnny C. Garrett (incumbent) | 14,432 | 100.00% | |
Total votes | 14,432 | 100.00% | ||
Republican hold | ||||
Party | Candidate | Votes | % | |
---|---|---|---|---|
Republican | Clark Boyd (incumbent) | 5,935 | 100.00% | |
Total votes | 5,935 | 100.00% |
Party | Candidate | Votes | % | |
---|---|---|---|---|
Republican | Clark Boyd (incumbent) | 16,023 | 100.00% | |
Total votes | 16,023 | 100.00% | ||
Republican hold | ||||
Party | Candidate | Votes | % | |
---|---|---|---|---|
Republican | Rush Bricken (incumbent) | 7,117 | 100.00% | |
Total votes | 7,117 | 100.00% |
Party | Candidate | Votes | % | |
---|---|---|---|---|
Republican | Rush Bricken (incumbent) | 12,565 | 80.53% | |
Independent | Veronica Owens | 3,038 | 19.47% | |
Total votes | 15,603 | 100.00% | ||
Republican hold | ||||
Party | Candidate | Votes | % | |
---|---|---|---|---|
Republican | Bryan Terry (incumbent) | 4,606 | 100.00% | |
Total votes | 4,606 | 100.00% |
Party | Candidate | Votes | % | |
---|---|---|---|---|
Democratic | Matt Ferry | 1,910 | 100.00% | |
Total votes | 1,910 | 100.00% |
Party | Candidate | Votes | % | |
---|---|---|---|---|
Republican | Bryan Terry (incumbent) | 11,564 | 67.10% | |
Democratic | Matt Ferry | 5,669 | 32.90% | |
Total votes | 17,233 | 100.00% | ||
Republican hold | ||||
Party | Candidate | Votes | % | |
---|---|---|---|---|
Republican | Mike Sparks (incumbent) | 2,080 | 100.00% | |
Total votes | 2,080 | 100.00% |
Party | Candidate | Votes | % | |
---|---|---|---|---|
Democratic | Morgan Woodberry | 1,253 | 100.00% | |
Total votes | 1,253 | 100.00% |
Party | Candidate | Votes | % | |
---|---|---|---|---|
Republican | Mike Sparks (incumbent) | 7,744 | 59.50% | |
Democratic | Morgan Woodberry | 5,272 | 40.50% | |
Total votes | 13,016 | 100.00% | ||
Republican hold | ||||
Party | Candidate | Votes | % | |
---|---|---|---|---|
Democratic | Bo Mitchell (incumbent) | 3,650 | 100.00% | |
Total votes | 3,650 | 100.00% |
Party | Candidate | Votes | % | |
---|---|---|---|---|
Democratic | Bo Mitchell (incumbent) | 12,086 | 100.00% | |
Total votes | 12,086 | 100.00% | ||
Democratic hold | ||||
Party | Candidate | Votes | % | |
---|---|---|---|---|
Democratic | Bill Beck (incumbent) | 5,770 | 100.00% | |
Total votes | 5,770 | 100.00% |
Party | Candidate | Votes | % | |
---|---|---|---|---|
Democratic | Bill Beck (incumbent) | 17,661 | 100.00% | |
Total votes | 17,661 | 100.00% | ||
Democratic hold | ||||
Party | Candidate | Votes | % | |
---|---|---|---|---|
Democratic | Justin Jones | 1,956 | 53.24% | |
Democratic | Delishia Porterfield | 1,718 | 46.76% | |
Total votes | 3,674 | 100.00% |
Party | Candidate | Votes | % | |
---|---|---|---|---|
Democratic | Justin Jones | 14,432 | 100.00% | |
Total votes | 14,432 | 100.00% | ||
Democratic hold | ||||
Party | Candidate | Votes | % | |
---|---|---|---|---|
Democratic | Jason L. Powell (incumbent) | 3,368 | 100.00% | |
Total votes | 3,368 | 100.00% |
Party | Candidate | Votes | % | |
---|---|---|---|---|
Republican | Dia Hart | 1,062 | 99.25% | |
Republican | Yog Nepal (write-in) | 8 | 0.75% | |
Total votes | 1,070 | 100.00% |
Party | Candidate | Votes | % | |
---|---|---|---|---|
Democratic | Jason L. Powell (incumbent) | 9,008 | 66.10% | |
Republican | Dia Hart | 4,619 | 33.90% | |
Total votes | 13,627 | 100.00% | ||
Democratic hold | ||||
Party | Candidate | Votes | % | |
---|---|---|---|---|
Democratic | Vincent B. Dixie (incumbent) | 5,920 | 100.00% | |
Total votes | 5,920 | 100.00% |
Party | Candidate | Votes | % | |
---|---|---|---|---|
Democratic | Vincent B. Dixie (incumbent) | 13,955 | 100.00% | |
Total votes | 13,955 | 100.00% | ||
Democratic hold | ||||
Party | Candidate | Votes | % | |
---|---|---|---|---|
Democratic | John Ray Clemmons (incumbent) | 2,601 | 100.00% | |
Total votes | 2,601 | 100.00% |
Party | Candidate | Votes | % | |
---|---|---|---|---|
Democratic | John Ray Clemmons (incumbent) | 7,551 | 100.00% | |
Total votes | 7,551 | 100.00% | ||
Democratic hold | ||||
Party | Candidate | Votes | % | |
---|---|---|---|---|
Democratic | Bob Freeman (incumbent) | 5,866 | 100.00% | |
Total votes | 5,866 | 100.00% |
Party | Candidate | Votes | % | |
---|---|---|---|---|
Democratic | Bob Freeman (incumbent) | 17,352 | 100.00% | |
Total votes | 17,352 | 100.00% | ||
Democratic hold | ||||
Party | Candidate | Votes | % | |
---|---|---|---|---|
Republican | Susan M. Lynn (incumbent) | 5,603 | 100.00% | |
Total votes | 5,603 | 100.00% |
Party | Candidate | Votes | % | |
---|---|---|---|---|
Republican | Susan M. Lynn (incumbent) | 15,907 | 100.00% | |
Total votes | 15,907 | 100.00% | ||
Republican hold | ||||
Party | Candidate | Votes | % | |
---|---|---|---|---|
Democratic | Harold M. Love Jr. (incumbent) | 3,735 | 100.00% | |
Total votes | 3,735 | 100.00% |
Party | Candidate | Votes | % | |
---|---|---|---|---|
Democratic | Harold M. Love Jr. (incumbent) | 10,426 | 100.00% | |
Total votes | 10,426 | 100.00% | ||
Democratic hold | ||||
Party | Candidate | Votes | % | |
---|---|---|---|---|
Democratic | Caleb Hemmer | 5,274 | 100.00% | |
Total votes | 5,274 | 100.00% |
Party | Candidate | Votes | % | |
---|---|---|---|---|
Republican | Michelle Foreman | 3,439 | 62.00% | |
Republican | Wyatt Rampy | 2,108 | 38.00% | |
Total votes | 5,547 | 100.0 |
Party | Candidate | Votes | % | |
---|---|---|---|---|
Democratic | Caleb Hemmer | 15,509 | 52.40% | |
Republican | Michelle Foreman | 14,088 | 47.60% | |
Total votes | 29,597 | 100.00% | ||
Democratic hold | ||||
Party | Candidate | Votes | % | |
---|---|---|---|---|
Democratic | Darren Jernigan (incumbent) | 3,876 | 100.00% | |
Total votes | 3,876 | 100.00% |
Party | Candidate | Votes | % | |
---|---|---|---|---|
Republican | Christopher Huff | 2,026 | 100.00% | |
Total votes | 2,026 | 100.0 |
Party | Candidate | Votes | % | |
---|---|---|---|---|
Democratic | Darren Jernigan (incumbent) | 11,201 | 60.20% | |
Republican | Christopher Huff | 7,405 | 39.80% | |
Total votes | 18,606 | 100.00% | ||
Democratic hold | ||||
Party | Candidate | Votes | % | |
---|---|---|---|---|
Republican | Gino Bulso | 5,162 | 61.45% | |
Republican | Bob Ravener | 3,238 | 38.55% | |
Total votes | 8,400 | 100.00% |
Party | Candidate | Votes | % | |
---|---|---|---|---|
Democratic | Steven Cervantes | 2,421 | 100.00% | |
Total votes | 2,421 | 100.00% |
Party | Candidate | Votes | % | |
---|---|---|---|---|
Republican | Gino Bulso | 16,733 | 65.94% | |
Democratic | Steven Cervantes | 8,644 | 34.06% | |
Total votes | 25,377 | 100.00% | ||
Republican hold | ||||
Party | Candidate | Votes | % | |
---|---|---|---|---|
Republican | Pat Marsh (incumbent) | 6,210 | 100.00% | |
Total votes | 6,210 | 100.00% |
Party | Candidate | Votes | % | |
---|---|---|---|---|
Republican | Pat Marsh (incumbent) | 13,496 | 100.00% | |
Total votes | 13,496 | 100.00% | ||
Republican hold | ||||
Party | Candidate | Votes | % | |
---|---|---|---|---|
Republican | Jake McCalmon | 3,122 | 44.39% | |
Republican | Laurie Cardoza-Moore | 2,944 | 41.86% | |
Republican | James Sloan | 967 | 13.75% | |
Total votes | 7,033 | 100.00% |
Party | Candidate | Votes | % | |
---|---|---|---|---|
Democratic | Kisha Davis | 2,215 | 100.00% | |
Total votes | 2,215 | 100.00% |
Party | Candidate | Votes | % | |
---|---|---|---|---|
Republican | Jake McCalmon | 16,696 | 69.37% | |
Democratic | Kisha Davis | 7,373 | 30.63% | |
Total votes | 24,069 | 100.00% | ||
Republican hold | ||||
Party | Candidate | Votes | % | |
---|---|---|---|---|
Republican | Scott Cepicky (incumbent) | 4,750 | 54.58% | |
Republican | Jason Gilliam | 3,953 | 45.42% | |
Total votes | 8,703 | 100.00% |
Party | Candidate | Votes | % | |
---|---|---|---|---|
Democratic | Jameson Manor | 1,877 | 100.00% | |
Total votes | 1,877 | 100.00% |
Party | Candidate | Votes | % | |
---|---|---|---|---|
Republican | Scott Cepicky (incumbent) | 15,079 | 70.70% | |
Democratic | Jameson Manor | 6,248 | 29.30% | |
Total votes | 21,327 | 100.00% | ||
Republican hold | ||||
Party | Candidate | Votes | % | |
---|---|---|---|---|
Republican | Sam Whitson (incumbent) | 6,794 | 100.00% | |
Total votes | 6,794 | 100.00% |
Party | Candidate | Votes | % | |
---|---|---|---|---|
Republican | Sam Whitson (incumbent) | 18,484 | 100.00% | |
Total votes | 18,484 | 100.00% | ||
Republican hold | ||||
Party | Candidate | Votes | % | |
---|---|---|---|---|
Republican | Sabi "Doc" Kumar (incumbent) | 5,864 | 100.00% | |
Total votes | 5,864 | 100.00% |
Party | Candidate | Votes | % | |
---|---|---|---|---|
Republican | Sabi "Doc" Kumar (incumbent) | 18,484 | 100.00% | |
Total votes | 18,484 | 100.00% | ||
Republican hold | ||||
Party | Candidate | Votes | % | |
---|---|---|---|---|
Democratic | Ronnie Glynn | 1,758 | 100.00% | |
Total votes | 1,758 | 100.00% |
Party | Candidate | Votes | % | |
---|---|---|---|---|
Republican | Tommy Vallejos, Sr. | 1,433 | 63.32% | |
Republican | John Dawson | 830 | 36.68% | |
Total votes | 5,864 | 100.00% |
Party | Candidate | Votes | % | |
---|---|---|---|---|
Democratic | Ronnie Glynn | 5,767 | 50.67% | |
Republican | Tommy Vallejos, Sr. | 5,614 | 49.33% | |
Total votes | 11,381 | 100.00% | ||
Democratic hold | ||||
Party | Candidate | Votes | % | |
---|---|---|---|---|
Republican | Curtis Johnson (incumbent) | 5,368 | 100.00% | |
Total votes | 5,368 | 100.00% |
Party | Candidate | Votes | % | |
---|---|---|---|---|
Republican | Curtis Johnson (incumbent) | 13,501 | 71.17% | |
Independent | Monica Meeks | 5,469 | 28.83% | |
Total votes | 18,970 | 100.00% | ||
Republican hold | ||||
Party | Candidate | Votes | % | |
---|---|---|---|---|
Republican | Jody Barrett | 3,291 | 39.70% | |
Republican | Brian Johnson | 2,823 | 34.06% | |
Republican | Jeff Eby | 1,663 | 20.06% | |
Republican | Angela Marie Redden | 512 | 6.18% | |
Total votes | 8,289 | 100.00% |
Party | Candidate | Votes | % | |
---|---|---|---|---|
Democratic | Candie Loreeta Hedge | 942 | 53.93% | |
Democratic | Val Sloan | 773 | 45.07% | |
Total votes | 1,715 | 100.00% |
Party | Candidate | Votes | % | |
---|---|---|---|---|
Republican | Jody Barrett | 12,554 | 78.36% | |
Democratic | Candie Loreeta Hedge | 3,204 | 20.00% | |
Independent | Leonard D. (Lenny) Ladner | 262 | 1.64% | |
Total votes | 16,020 | 100.00% | ||
Republican hold | ||||
Party | Candidate | Votes | % | |
---|---|---|---|---|
Republican | Clay Doggett (incumbent) | 8,621 | 100.00% | |
Total votes | 8,621 | 100.00% |
Party | Candidate | Votes | % | |
---|---|---|---|---|
Republican | Clay Doggett (incumbent) | 14,147 | 100.00% | |
Total votes | 14,147 | 100.00% | ||
Republican hold | ||||
Party | Candidate | Votes | % | |
---|---|---|---|---|
Republican | Kip Capley | 3,589 | 33.61% | |
Republican | Jason Rich | 3,441 | 32.22% | |
Republican | Mitchell Skelton | 1,959 | 18.34% | |
Republican | Bill White | 1,689 | 15.83% | |
Total votes | 10,678 | 100.00% |
Party | Candidate | Votes | % | |
---|---|---|---|---|
Democratic | David P. Carson II | 1,201 | 100.00% | |
Total votes | 1,201 | 100.00% |
Party | Candidate | Votes | % | |
---|---|---|---|---|
Republican | Kip Capley | 14,585 | 81.71% | |
Democratic | David P. Carson II | 3,264 | 18.29% | |
Total votes | 17,849 | 100.00% | ||
Republican hold | ||||
Party | Candidate | Votes | % | |
---|---|---|---|---|
Republican | Kirk Haston (incumbent) | 7,831 | 100.00% | |
Total votes | 7,831 | 100.00% |
Party | Candidate | Votes | % | |
---|---|---|---|---|
Republican | Kirk Haston (incumbent) | 14,780 | 100.00% | |
Total votes | 14,780 | 100.00% | ||
Republican hold | ||||
Party | Candidate | Votes | % | |
---|---|---|---|---|
Republican | Chris Todd (incumbent) | 6,467 | 100.00% | |
Total votes | 6,467 | 100.00% |
Party | Candidate | Votes | % | |
---|---|---|---|---|
Democratic | Erica Nicole Coleman | 1,995 | 100.00% | |
Total votes | 1,995 | 100.00% |
Party | Candidate | Votes | % | |
---|---|---|---|---|
Republican | Chris Todd (incumbent) | 13,480 | 71.04% | |
Democratic | Erica Nicole Coleman | 5,496 | 28.96% | |
Total votes | 18,976 | 100.00% | ||
Republican hold | ||||
Party | Candidate | Votes | % | |
---|---|---|---|---|
Republican | Jay Reedy (incumbent) | 8,139 | 100.00% | |
Total votes | 8,139 | 100.00% |
Party | Candidate | Votes | % | |
---|---|---|---|---|
Republican | Jay Reedy (incumbent) | 14,328 | 100.00% | |
Total votes | 14,328 | 100.00% | ||
Republican hold | ||||
Party | Candidate | Votes | % | |
---|---|---|---|---|
Republican | Jeff Burkhart | 981 | 40.57% | |
Republican | Deanna McLaughlin | 910 | 37.63% | |
Republican | Kent Griffy | 527 | 21.80% | |
Total votes | 2,418 | 100.00% |
Party | Candidate | Votes | % | |
---|---|---|---|---|
Republican | Jeff Burkhart | 6,851 | 100.00% | |
Total votes | 6,851 | 100.00% | ||
Republican hold | ||||
Party | Candidate | Votes | % | |
---|---|---|---|---|
Republican | Tandy Darby (incumbent) | 6,465 | 100.00% | |
Total votes | 6,465 | 100.00% |
Party | Candidate | Votes | % | |
---|---|---|---|---|
Republican | Tandy Darby (incumbent) | 13,271 | 82.87% | |
Independent | James Hart | 1,829 | 11.42% | |
Independent | Kevin West | 914 | 5.71% | |
Total votes | 16,014 | 100.00% | ||
Republican hold | ||||
Party | Candidate | Votes | % | |
---|---|---|---|---|
Republican | Russell "Rusty" Grills (incumbent) | 7,487 | 100.00% | |
Total votes | 7,487 | 100.00% |
Party | Candidate | Votes | % | |
---|---|---|---|---|
Republican | Russell "Rusty" Grills (incumbent) | 12,785 | 100.00% | |
Total votes | 12,785 | 100.00% | ||
Republican hold | ||||
Party | Candidate | Votes | % | |
---|---|---|---|---|
Republican | Mary Littleton (incumbent) | 5,238 | 100.00% | |
Total votes | 5,238 | 100.00% |
Party | Candidate | Votes | % | |
---|---|---|---|---|
Democratic | Krystle James | 1,642 | 100.00% | |
Total votes | 1,642 | 100.00% |
Party | Candidate | Votes | % | |
---|---|---|---|---|
Republican | Mary Littleton (incumbent) | 13,084 | 73.63% | |
Democratic | Krystle James | 4,686 | 26.37% | |
Total votes | 17,770 | 100.00% | ||
Republican hold | ||||
Party | Candidate | Votes | % | |
---|---|---|---|---|
Republican | Brock Martin | 4,083 | 56.26% | |
Republican | Gordon Wildridge | 3,175 | 43.74% | |
Total votes | 7,258 | 100.00% |
Party | Candidate | Votes | % | |
---|---|---|---|---|
Democratic | Thomas Jefferson | 902 | 100.00% | |
Total votes | 902 | 100.00% |
Party | Candidate | Votes | % | |
---|---|---|---|---|
Republican | Brock Martin | 12,622 | 81.19% | |
Democratic | Thomas Jefferson | 2,924 | 18.81% | |
Total votes | 15,546 | 100.00% | ||
Republican hold | ||||
Party | Candidate | Votes | % | |
---|---|---|---|---|
Democratic | Johnny Shaw (incumbent) | 4,428 | 100.00% | |
Total votes | 4,428 | 100.00% |
Party | Candidate | Votes | % | |
---|---|---|---|---|
Democratic | Johnny Shaw (incumbent) | 8,724 | 100.00% | |
Total votes | 8,724 | 100.00% | ||
Democratic hold | ||||
Party | Candidate | Votes | % | |
---|---|---|---|---|
Republican | Debra Moody (incumbent) | 5,128 | 100.00% | |
Total votes | 5,128 | 100.00% |
Party | Candidate | Votes | % | |
---|---|---|---|---|
Republican | Debra Moody (incumbent) | 11,930 | 79.63% | |
Independent | Nicholas Sawall | 3,052 | 20.37% | |
Total votes | 14,982 | 100.00% | ||
Republican hold | ||||
Party | Candidate | Votes | % | |
---|---|---|---|---|
Republican | Chris Hurt (incumbent) | 5,512 | 100.00% | |
Total votes | 5,512 | 100.00% |
Party | Candidate | Votes | % | |
---|---|---|---|---|
Republican | Chris Hurt (incumbent) | 12,181 | 100.00% | |
Total votes | 12,181 | 100.00% | ||
Republican hold | ||||
Party | Candidate | Votes | % | |
---|---|---|---|---|
Republican | Mark White (incumbent) | 8,638 | 100.00% | |
Total votes | 8,638 | 100.00% |
Party | Candidate | Votes | % | |
---|---|---|---|---|
Republican | Mark White (incumbent) | 17,231 | 100.00% | |
Total votes | 17,231 | 100.00% | ||
Republican hold | ||||
Party | Candidate | Votes | % | |
---|---|---|---|---|
Democratic | Joe Towns Jr. (incumbent) | 4,002 | 77.92% | |
Democratic | Brandon Price | 1,134 | 22.08% | |
Total votes | 5,136 | 100.00% |
Party | Candidate | Votes | % | |
---|---|---|---|---|
Democratic | Joe Towns Jr. (incumbent) | 7,338 | 100.00% | |
Total votes | 7,338 | 100.00% | ||
Democratic hold | ||||
Party | Candidate | Votes | % | |
---|---|---|---|---|
Democratic | Jesse Chism (incumbent) | 8,274 | 81.20% | |
Democratic | Phyllis Parks | 1,916 | 18.80% | |
Total votes | 10,190 | 100.00% |
Party | Candidate | Votes | % | |
---|---|---|---|---|
Democratic | Jesse Chism (incumbent) | 13,988 | 100.00% | |
Total votes | 13,988 | 100.00% | ||
Democratic hold | ||||
Party | Candidate | Votes | % | |
---|---|---|---|---|
Democratic | Barbara Cooper (incumbent) | 5,233 | 78.96% | |
Democratic | Will Richardson | 1,395 | 21.04% | |
Total votes | 6,628 | 100.00% |
Party | Candidate | Votes | % | |
---|---|---|---|---|
Democratic | Barbara Cooper † | 8,006 | 73.11% | |
Independent | Michael Porter | 2,944 | 26.89% | |
Total votes | 10,950 | 100.00% | ||
Democratic hold | ||||
Party | Candidate | Votes | % | |
---|---|---|---|---|
Democratic | Karen Camper (incumbent) | 5,562 | 100.00% | |
Total votes | 5,562 | 100.00% |
Party | Candidate | Votes | % | |
---|---|---|---|---|
Democratic | Karen Camper (incumbent) | 7,881 | 100.00% | |
Total votes | 7,881 | 100.00% | ||
Democratic hold | ||||
Party | Candidate | Votes | % | |
---|---|---|---|---|
Democratic | Larry Miller (incumbent) | 5,608 | 100.00% | |
Total votes | 5,608 | 100.00% |
Party | Candidate | Votes | % | |
---|---|---|---|---|
Democratic | Larry Miller (incumbent) | 9,178 | 100.00% | |
Total votes | 9,178 | 100.00% | ||
Democratic hold | ||||
Party | Candidate | Votes | % | |
---|---|---|---|---|
Republican | Justin Lafferty (incumbent) | 4,356 | 100.00% | |
Total votes | 4,356 | 100.00% |
Party | Candidate | Votes | % | |
---|---|---|---|---|
Democratic | M.D. Dotson | 2,267 | 100.00% | |
Total votes | 2,267 | 100.00% |
Party | Candidate | Votes | % | |
---|---|---|---|---|
Republican | Justin Lafferty (incumbent) | 12,865 | 66.21% | |
Democratic | M.D. Dotson | 6,566 | 33.79% | |
Total votes | 19,431 | 100.00% | ||
Republican hold | ||||
Party | Candidate | Votes | % | |
---|---|---|---|---|
Democratic | Gloria Johnson (incumbent) | 3,690 | 100.00% | |
Total votes | 3,690 | 100.00% |
Party | Candidate | Votes | % | |
---|---|---|---|---|
Republican | David "Pozy" Poczobut | 2,001 | 100.00% | |
Total votes | 2,001 | 100.00% |
Party | Candidate | Votes | % | |
---|---|---|---|---|
Democratic | Gloria Johnson (incumbent) | 8,473 | 57.90% | |
Republican | David "Pozy" Poczobut | 6,162 | 42.10% | |
Total votes | 14,635 | 100.00% | ||
Democratic hold | ||||
Party | Candidate | Votes | % | |
---|---|---|---|---|
Democratic | Torrey Harris (incumbent) | 4,639 | 58.52% | |
Democratic | Barbara Farmer-Tolbert | 3,288 | 41.48% | |
Total votes | 7,927 | 100.00% |
Party | Candidate | Votes | % | |
---|---|---|---|---|
Democratic | Torrey Harris (incumbent) | 10,630 | 100.00% | |
Total votes | 10,630 | 100.00% | ||
Democratic hold | ||||
Party | Candidate | Votes | % | |
---|---|---|---|---|
Republican | Todd Warner (incumbent) | 4,049 | 54.40% | |
Republican | Matt Fitterer | 2,059 | 27.66% | |
Republican | Jeff Ford | 1,335 | 17.94% | |
Total votes | 7,443 | 100.00% |
Party | Candidate | Votes | % | |
---|---|---|---|---|
Democratic | Angela Hughes | 1,648 | 100.00% | |
Total votes | 1,648 | 100.00% |
Party | Candidate | Votes | % | |
---|---|---|---|---|
Republican | Todd Warner (incumbent) | 13,527 | 73.92% | |
Democratic | Angela Hughes | 4,772 | 26.08% | |
Total votes | 18,299 | 100.00% | ||
Republican hold | ||||
Party | Candidate | Votes | % | |
---|---|---|---|---|
Democratic | G. A. Hardaway (incumbent) | 5,150 | 100.00% | |
Total votes | 5,150 | 100.00% |
Party | Candidate | Votes | % | |
---|---|---|---|---|
Democratic | G. A. Hardaway (incumbent) | 7,359 | 100.00% | |
Total votes | 7,359 | 100.00% | ||
Democratic hold | ||||
Party | Candidate | Votes | % | |
---|---|---|---|---|
Republican | Ron M. Gant (incumbent) | 6,753 | 100.00% | |
Total votes | 6,753 | 100.00% |
Party | Candidate | Votes | % | |
---|---|---|---|---|
Republican | Ron M. Gant (incumbent) | 17,528 | 100.00% | |
Total votes | 17,528 | 100.00% | ||
Republican hold | ||||
Party | Candidate | Votes | % | |
---|---|---|---|---|
Republican | Kevin Vaughan (incumbent) | 8,481 | 100.00% | |
Total votes | 8,481 | 100.00% |
Party | Candidate | Votes | % | |
---|---|---|---|---|
Democratic | Patricia Causey | 2,834 | 100.00% | |
Total votes | 2,834 | 100.00% |
Party | Candidate | Votes | % | |
---|---|---|---|---|
Republican | Kevin Vaughan (incumbent) | 17,939 | 74.65% | |
Democratic | Patricia Causey | 6,093 | 25.35% | |
Total votes | 24,032 | 100.00% | ||
Republican hold | ||||
Party | Candidate | Votes | % | |
---|---|---|---|---|
Democratic | Dwayne Thompson (incumbent) | 6,674 | 100.00% | |
Total votes | 6,674 | 100.00% |
Party | Candidate | Votes | % | |
---|---|---|---|---|
Democratic | Dwayne Thompson (incumbent) | 10,273 | 100.00% | |
Total votes | 10,273 | 100.00% | ||
Democratic hold | ||||
Party | Candidate | Votes | % | |
---|---|---|---|---|
Republican | John Gillespie (incumbent) | 7,897 | 100.00% | |
Total votes | 7,897 | 100.00% |
Party | Candidate | Votes | % | |
---|---|---|---|---|
Democratic | Toniko Harris | 2,855 | 50.18% | |
Democratic | Houston Wolf | 2,835 | 49.82% | |
Total votes | 5,690 | 100.00% |
Party | Candidate | Votes | % | |
---|---|---|---|---|
Republican | John Gillespie (incumbent) | 12,083 | 56.72% | |
Democratic | Toniko Harris | 9,219 | 43.28% | |
Total votes | 21,302 | 100.00% | ||
Republican hold | ||||
Party | Candidate | Votes | % | |
---|---|---|---|---|
Democratic | Antonio Parkinson (incumbent) | 5,431 | 100.00% | |
Total votes | 5,431 | 100.00% |
Party | Candidate | Votes | % | |
---|---|---|---|---|
Democratic | Antonio Parkinson (incumbent) | 8,432 | 100.00% | |
Total votes | 8,432 | 100.00% | ||
Democratic hold | ||||
Party | Candidate | Votes | % | |
---|---|---|---|---|
Republican | Tom Leatherwood (incumbent) | 6,526 | 71.78% | |
Republican | Lee Mills | 2,565 | 28.22% | |
Total votes | 9,091 | 100.00% |
Party | Candidate | Votes | % | |
---|---|---|---|---|
Republican | Tom Leatherwood (incumbent) | 17,374 | 100.00% | |
Total votes | 17,374 | 100.00% | ||
Republican hold | ||||
The Tennessee House of Representatives is the lower house of the Tennessee General Assembly, the state legislature of the U.S. state of Tennessee.
The Tennessee Republican Party is the affiliate of the United States Republican Party in Tennessee. Since the mid-1960s, the state has become increasingly Republican. The current chairman of the Republican Party of Tennessee is Scott Golden. It is currently the dominant party in the state, controlling the majority of Tennessee's U.S. House seats, both U.S. Senate seats, both houses of the state legislature, and the governorship.
Richard Glen Casada Jr. is an American politician, and a former Republican member of the Tennessee House of Representatives, where he represented District 63 from 2003 to 2023. He was the Speaker of the Tennessee House of Representatives from January 8, 2019 through August 2, 2019, whereupon he resigned his post amid scandal. This was the shortest stint of a Tennessee Speaker of the House in modern history. Casada was previously the Majority Leader of the Tennessee House of Representatives. His opposition to Syrian refugees attracted national attention in the media in 2015.
The 2014 Tennessee gubernatorial election took place on November 4, 2014, to elect the governor of Tennessee. Incumbent Republican Governor Bill Haslam was re-elected to a second term with 70.3% of the vote, defeating his Democratic challenger Charles Brown. Improving on his performance from 2010, Haslam also carried every county in the state.
Jeremy Ryan Durham is an American former politician and attorney. From January 2013 to September 2016 he served as the Republican member of the Tennessee House of Representatives for the 65th District, encompassing parts of Williamson County, Tennessee. On July 13, 2016 a special committee of the Tennessee House of Representatives released a report that found Durham had had inappropriate "sexual interactions" with 22 women. On September 13, 2016, Durham was expelled from the Tennessee House of Representatives on a 70–2 vote.
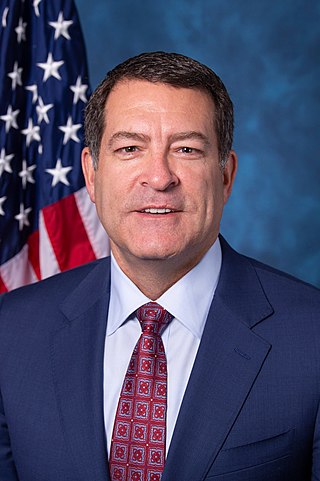
Mark Edward Green is an American politician, physician, and retired U.S. Army major who has served as the U.S. representative for Tennessee's 7th congressional district since 2019. A member of the Republican Party, Green has chaired the Committee on Homeland Security since 2023. Before his election to Congress, he served in the Tennessee Senate from 2013 to 2018, representing the 22nd district.
The 2014 elections for the Oregon Legislative Assembly determined the composition of both houses of the state legislature for the 78th Oregon Legislative Assembly. The Republican and Democratic primary elections were held on May 20, 2014 with the general election following on November 4, 2014.
The 2018 United States Senate election in Tennessee took place on November 6, 2018, concurrently with other elections to the United States Senate, elections to the United States House of Representatives and various state and local elections. Incumbent Republican Senator Bob Corker opted to retire instead of running for a third term. Republican U.S. Representative Marsha Blackburn won the open seat, defeating former Democratic Governor Phil Bredesen.
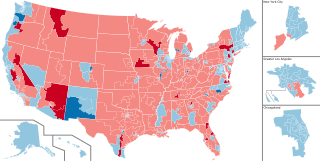
The 2022 United States House of Representatives elections were held on November 8, 2022, as part of the 2022 United States elections during incumbent president Joe Biden's term. Representatives were elected from all 435 U.S. congressional districts across each of the 50 states to serve in the 118th United States Congress, as well as 5 non-voting members of the U.S. House of Representatives from the District of Columbia and four of the five inhabited insular areas. Numerous other federal, state, and local elections, including the 2022 U.S. Senate elections and the 2022 U.S. gubernatorial elections, were also held simultaneously. This was the first election after the 2020 redistricting cycle.
The 2020 United States House of Representatives elections in Tennessee was held on November 3, 2020, to elect the nine U.S. representatives from the state of Tennessee, one from each of the state's nine congressional districts. The elections coincided with the 2020 U.S. presidential election, as well as other elections to the House of Representatives, elections to the United States Senate, and various state and local elections.
Brandon Thomas Ogles is an American former politician who served in the Tennessee House of Representatives. As a Republican, he represented District 61, located in northern Williamson County, and includes the city of Brentwood and part of Franklin.
The 2022 United States House of Representatives elections in Tennessee were held on November 8, 2022, to elect the nine U.S. representatives from the state of Tennessee, one from each of the state's nine congressional districts. The elections coincided with other elections to the House of Representatives, elections to the United States Senate, and various state and local elections.
Eddie Mannis is an American former politician, who was a member of the Tennessee House of Representatives from 2020-2022. He represented the 18th House District as a member of the Tennessee Republican Party.
The 2022 elections for the Pennsylvania House of Representatives were held on November 8, 2022, with all districts currently being decided. The term of office for those elected in 2022 began when the House of Representatives convened in January 2023. Pennsylvania State Representatives are elected for two-year terms, with all 203 seats up for election every two years.
The 2022 Tennessee State Senate election was held on November 8, 2022, to elect 17 of the 33 seats for the Tennessee's State Senate. The elections coincided with the Governor, U.S. House, and State House elections. The primary elections were held on August 4, 2022.
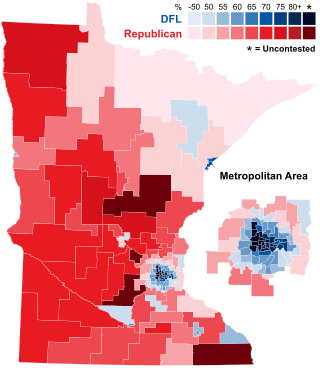
The 2022 Minnesota House of Representatives election was held in the U.S. state of Minnesota on November 8, 2022, to elect members to the House of Representatives of the 93rd Minnesota Legislature. A primary election was held in several districts on August 9, 2022. The election coincided with the election of the other chamber of the Legislature, the Senate.
William Andrew Ogles IV is an American politician and businessman who has served as the U.S. representative for Tennessee's 5th congressional district since 2023. A member of the Republican Party, he served as the mayor of Maury County, Tennessee, from 2018 to 2022.
The 2024 United States House of Representatives elections will be held on November 5, 2024, as part of the 2024 United States elections, to elect representatives from all 435 congressional districts across each of the 50 U.S. states, as well as six non-voting delegates from the District of Columbia and the inhabited U.S. territories. Special elections may also be held on various dates throughout 2024. Numerous other federal, state, and local elections, including the U.S. presidential election and elections to the Senate, will also be held on this date. The winners of this election will serve in the 119th United States Congress, with seats apportioned among the states based on the 2020 United States census.
The 2024 United States House of Representatives elections in Tennessee will be held on November 5, 2024, to elect the nine U.S. representatives from the State of Tennessee, one from each of the state's congressional districts. The elections will coincide with the 2024 U.S. presidential election, as well as other elections to the House of Representatives, elections to the United States Senate, and various state and local elections. The primary elections are scheduled for August 1, 2024.
The 2024 Tennessee House of Representatives election will be held on November 5, 2024, to elect 99 seats for the Tennessee House of Representatives. The elections will coincide with the Presidential, U.S. Senate, U.S. House, and State Senate elections. The primary election will be held on August 1, 2024.