2022 Kansas House of Representatives election

Last updated

2022 Kansas House of Representatives election
Flag of Kansas.svg
  2020 November 8, 2022 (2022-11-08) 2024  

All 125 seats in the Kansas House of Representatives
63 seats needed for a majority
 Majority partyMinority party
  3x4.svg Tom Sawyer debating on the house floor (cropped to show head and shoulders).jpg
Leader Daniel Hawkins Tom Sawyer
Party Republican Democratic
Leader's seat100th district95th district
Seats before8639
Seats won8540
Seat changeDecrease2.svg 1Increase2.svg 1
Popular vote566,412334,211
Percentage62.57%36.92%
SwingIncrease2.svg 0.65%Decrease2.svg 0.69%

2022 Kansas House of Representatives election results by gains and holds.svg
2022 Kansas House of Representatives election results.svg
     Democratic gain     Republican gain
     Democratic hold     Republican hold
     50–60%     60–70%     70–80%     80–90%     >90%
     50–60%     60–70%     70–80%     80–90%     >90%

Speaker before election

Ron Ryckman Jr.
Republican

Elected Speaker

Daniel Hawkins
Republican

The 2022 Kansas House of Representatives elections took place as a part of the 2022 United States elections. All 125 seats in the Kansas House of Representatives were up for re-election. Representatives serve two year terms and are not term limited. [1]

Contents

Democrats gained 1 seat, decreasing the narrow Republican supermajority to 85 out of 125 seats. [2]

Results summary

-
PartyVotes %Seats+/– %
Republican Party 566,41262.57%85-168%
Democratic Party 334,21136.92%40+132%
Libertarian Party 4,5840.50%00%
Total905,207100%125

Predictions

SourceRankingAs of
Sabato's Crystal Ball [4] Safe RMay 19, 2022

Close races

Districts where the margin of victory was under 10%:

  1. District 28, 0.58%
  2. District 15, 1.36%
  3. District 49, 1.54% (flip)
  4. District 30, 1.58%
  5. District 88, 1.92% (flip)
  6. District 14, 2% (flip)
  7. District 39, 2.08%
  8. District 48, 2.66%
  9. District 117, 2.88%
  10. District 41, 3.2%
  11. District 67, 4.82%
  12. District 102, 4.88%
  13. District 33, 5.6% (flip)
  14. District 78, 7%
  15. District 121, 8.22%
  16. District 16, 8.46%
  17. District 8, 8.96%
  18. District 17, 9.06%

Results

District 1District 2District 3District 4District 5District 6District 7District 8District 9District 10District 11District 12District 13District 14District 15District 16District 17District 18District 19District 20District 21District 22District 23District 24District 25District 26District 27District 28District 29District 30District 31District 32District 33District 34District 35District 36District 37District 38District 39District 40District 41District 42District 43District 44District 45District 46District 47District 48District 49District 50District 51District 52District 53District 54District 55District 56District 57District 58District 59District 60District 61District 62District 63District 64District 65District 66District 67District 68District 69District 70District 71District 72District 73District 74District 75District 76District 77District 78District 79District 80District 81District 82District 83District 84District 85District 86District 87District 88District 89District 90District 91District 92District 93District 94District 95District 96District 97District 98District 99District 100District 101District 102District 103District 104District 105District 106District 107District 108District 109District 110District 111District 112District 113District 114District 115District 116District 117District 118District 119District 120District 121District 122District 123District 124District 125

District 1

District 1 [5]
PartyCandidateVotes%
Republican Michael Houser 5,847 75.20
Democratic Paul Rogers1,92824.80
Total votes7,775 100.00

District 2

District 2 [5]
PartyCandidateVotes%
Republican Ken Collins 6,566 100.00
Total votes6,566 100.00

District 3

District 3 [5]
PartyCandidateVotes%
Republican Chuck Smith 4,714 100.00
Total votes4,714 100.00

District 4

District 4 [5]
PartyCandidateVotes%
Republican Trevor Jacobs 7,069 100.00
Total votes7,069 100.00

District 5

District 5 [5]
PartyCandidateVotes%
Republican Carrie Barth 7,085 100.00
Total votes7,085 100.00

District 6

District 6 [5]
PartyCandidateVotes%
Republican Samantha Poetter 6,265 67.96
Democratic Nina Fricke2,95432.04
Total votes9,219 100.00

District 7

District 7 [5]
PartyCandidateVotes%
Republican Dan Goddard 5,789 100.00
Total votes5,789 100.00

District 8

District 8 [5]
PartyCandidateVotes%
Republican Chris Croft 5,451 54.48
Democratic Pam Shernuk4,55545.52
Total votes10,006 100.00

District 9

District 9 [5]
PartyCandidateVotes%
Republican Fred Gardner 6,101 74.15
Democratic Alana Cloutier2,12725.85
Total votes8,228 100.00

District 10

District 10 [5]
PartyCandidateVotes%
Democratic Christina Haswood 6,695 100.00
Total votes6,695 100.00

District 11

District 11 [5]
PartyCandidateVotes%
Republican Ron Bryce 5,104 74.88
Democratic Gregory Wilkinson1,71225.12
Total votes6,816 100.00

District 12

District 12 [5]
PartyCandidateVotes%
Republican Doug Blex 7,674 100.00
Total votes7,674 100.00

District 13

District 13 [5]
PartyCandidateVotes%
Republican Joe Newland 7,742 100.00
Total votes7,742 100.00

District 14

District 14 [5]
PartyCandidateVotes%
Democratic Dennis Miller 5,647 51.00
Republican Charlotte Esau 5,42649.00
Total votes11,073 100.00

District 15

District 15 [5]
PartyCandidateVotes%
Democratic Allison Hougland 2,915 50.68
Republican Matt Bingesser2,83749.32
Total votes5,752 100.00

District 16

District 16 [5]
PartyCandidateVotes%
Democratic Linda Featherston 5,970 54.23
Republican Ed Roitz5,03945.77
Total votes11,009 100.00

District 17

District 17 [5]
PartyCandidateVotes%
Democratic Jo Ella Hoye 6,139 53.58
Republican Emily Carpenter5,10244.53
Libertarian Michael Kerner2171.89
Total votes11,458 100.00

District 18

District 18 [5]
PartyCandidateVotes%
Democratic Cindy Neighbor 5,746 57.34
Republican Cathy Gordon4,27542.66
Total votes10,021 100.00

District 19

District 19 [5]
PartyCandidateVotes%
Democratic Stephanie Clayton 8,027 61.99
Republican Nicholas Reddell4,92238.01
Total votes12,949 100.00

District 20

District 20 [5]
PartyCandidateVotes%
Democratic Mari-Lynn Poskin 7,048 55.70
Republican Carrie Rahfaldt5,60644.30
Total votes12,654 100.00

District 21

District 21 [5]
PartyCandidateVotes%
Democratic Jerry Stogsdill 9,143 100.00
Total votes9,143 100.00

District 22

District 22 [5]
PartyCandidateVotes%
Democratic Lindsay Vaughn 5,574 65.03
Republican Robert "Chris" Colburn2,99734.97
Total votes8,571 100.00

District 23

District 23 [5]
PartyCandidateVotes%
Democratic Susan Ruiz 6,115 100.00
Total votes6,115 100.00

District 24

District 24 [5]
PartyCandidateVotes%
Democratic Jarrod Ousley 6,733 100.00
Total votes6,733 100.00

District 25

District 25 [5]
PartyCandidateVotes%
Democratic Rui Xu 9,766 100.00
Total votes9,766 100.00

District 26

District 26 [5]
PartyCandidateVotes%
Republican Adam Thomas 5,766 59.30
Democratic Cheron Tiffany3,95840.70
Total votes9,724 100.00

District 27

District 27 [5]
PartyCandidateVotes%
Republican Sean Tarwater 6,648 57.34
Democratic Christi Pribula4,94542.66
Total votes11,593 100.00

District 28

District 28 [5]
PartyCandidateVotes%
Republican Carl Turner 5,151 50.29
Democratic Ace Allen5,09149.71
Total votes10,242 100.00

District 29

District 29 [5]
PartyCandidateVotes%
Democratic Heather Meyer 5,558 57.16
Republican David Soffer4,16642.84
Total votes9,724 100.00

District 30

District 30 [5]
PartyCandidateVotes%
Republican Laura Williams 4,499 50.79
Democratic Courtney Eiterich4,35949.21
Total votes8,858 100.00

District 31

District 31 [5]
PartyCandidateVotes%
Democratic Louis Ruiz 3,290 73.77
Republican Dennis Grindel1,17026.23
Total votes4,460 100.00

District 32

District 32 [5]
PartyCandidateVotes%
Democratic Pam Curtis 1,857 100.00
Total votes1,857 100.00

District 33

District 33 [5]
PartyCandidateVotes%
Republican Mike Thompson 3,350 51.44
Democratic Bill Hutton2,98345.80
Libertarian Stephanie Barton1802.76
Total votes6,513 100.00

District 34

District 34 [5]
PartyCandidateVotes%
Democratic Valdenia Winn 2,572 79.43
Republican Pepe Cabrera66620.57
Total votes3,238 100.00

District 35

District 35 [5]
PartyCandidateVotes%
Democratic Marvin Robinson II 3,290 80.13
Republican Sam Stillwell81619.87
Total votes4,106 100.00

District 36

District 36 [5]
PartyCandidateVotes%
Democratic Lynn Melton 4,999 62.29
Republican Kevin Braun3,02737.71
Total votes8,026 100.00

District 37

District 37 [5]
PartyCandidateVotes%
Democratic Melissa Oropeza 2,944 61.84
Republican Diana Whittington1,83438.16
Total votes4,846 100.00

District 38

District 38 [5]
PartyCandidateVotes%
Republican Timothy H. Johnson 7,832 100.00
Total votes7,832 100.00

District 39

District 39 [5]
PartyCandidateVotes%
Republican Owen Donohoe 5,052 51.04
Democratic Vanessa Vaughn West4,84748.96
Total votes9,899 100.00

District 40

District 40 [5]
PartyCandidateVotes%
Republican David Buehler 3,999 55.38
Democratic Martha Allen3,22244.62
Total votes7,221 100.00

District 41

District 41 [5]
PartyCandidateVotes%
Republican Pat Proctor 2,324 51.60
Democratic Harry Schwarz2,18048.40
Total votes4,504 100.00

District 42

District 42 [5]
PartyCandidateVotes%
Republican Lance Neelly 6,705 100.00
Total votes6,705 100.00

District 43

District 43 [5]
PartyCandidateVotes%
Republican Bill Sutton 4,202 58.07
Democratic Keith Davenport3,03441.93
Total votes7,236 100.00

District 44

District 44 [5]
PartyCandidateVotes%
Democratic Barbara Ballard 8,890 100.00
Total votes8,890 100.00

District 45

District 45 [5]
PartyCandidateVotes%
Democratic Mike Amyx 9,613 100.00
Total votes9,613 100.00

District 46

District 46 [5]
PartyCandidateVotes%
Democratic Dennis Highberger 5,715 100.00
Total votes5,715 100.00

District 47

District 47 [5]
PartyCandidateVotes%
Republican Ronald Ellis 7,819 100.00
Total votes7,819 100.00

District 48

District 48 [5]
PartyCandidateVotes%
Democratic Dan Osman 5,161 51.33
Republican Terry Frederick4,89448.67
Total votes10,005 100.00

District 49

District 49 [5]
PartyCandidateVotes%
Democratic Brad Boyd 4,789 50.77
Republican Kristin Clark4,64349.23
Total votes9,432 100.00

District 50

District 50 [5]
PartyCandidateVotes%
Republican Fred Patton 8,918 100.00
Total votes8,918 100.00

District 51

District 51 [5]
PartyCandidateVotes%
Republican Kenny Titus 7,702 100.00
Total votes7,702 100.00

District 52

District 52 [5]
PartyCandidateVotes%
Republican Jesse Borjon 6,426 56.30
Democratic Derik Flerlage4,98743.70
Total votes11,413 100.00

District 53

District 53 [5]
PartyCandidateVotes%
Democratic Kirk Haskins 4,948 55.37
Republican Bruce Williamson3,98844.63
Total votes8,936 100.00

District 54

District 54 [5]
PartyCandidateVotes%
Republican Ken Corbet 6,446 66.61
Democratic Lyndon Johnson3,23133.39
Total votes9,677 100.00

District 55

District 55 [5]
PartyCandidateVotes%
Democratic Tobias Schlingensiepen 4,853 65.61
Republican Todd Staerkel2,54434.39
Total votes7,397 100.00

District 56

District 56 [5]
PartyCandidateVotes%
Democratic Virgil Weigel 6,349 100.00
Total votes6,349 100.00

District 57

District 57 [5]
PartyCandidateVotes%
Democratic John Alcala 4,221 100.00
Total votes4,221 100.00

District 58

District 58 [5]
PartyCandidateVotes%
Democratic Vic Miller 4,455 100.00
Total votes4,455 100.00

District 59

District 59 [5]
PartyCandidateVotes%
Republican Rebecca Schmoe 5,344 64.53
Democratic Darrell McCune2,93735.37
Total votes8,281 100.00

District 60

District 60 [5]
PartyCandidateVotes%
Republican Mark Schreiber 3,649 55.27
Democratic Mic McGuire2,95344.73
Total votes6,602 100.00

District 61

District 61 [5]
PartyCandidateVotes%
Republican Francis Awerkamp 6,677 100.00
Total votes6,677 100.00

District 62

District 62 [5]
PartyCandidateVotes%
Republican Randy Garber 7,872 100.00
Total votes7,782 100.00

District 63

District 63 [5]
PartyCandidateVotes%
Republican John Eplee 7,116 100.00
Total votes7,116 100.00

District 64

District 64 [5]
PartyCandidateVotes%
Republican Lewis "Bill" Bloom 5,721 77.34
Democratic Patricia Smetana1,67622.66
Total votes7,397 100.00

District 65

District 65 [5]
PartyCandidateVotes%
Republican Jeff Underhill 3,121 100.00
Total votes3,121 100.00

District 66

District 66 [5]
PartyCandidateVotes%
Democratic Sydney Carlin 3,317 100.00
Total votes3,317 100.00

District 67

District 67 [5]
PartyCandidateVotes%
Republican Mike Dodson 4,559 52.41
Democratic Kim Zito4,13947.59
Total votes8,698 100.00

District 68

District 68 [5]
PartyCandidateVotes%
Republican Nate Butler 3,207 67.77
Democratic Michael Seymour II1,52532.23
Total votes4,732 100.00

District 69

District 69 [5]
PartyCandidateVotes%
Republican Clarke Sanders 4,747 65.00
Democratic Sarah Crews2,55635.00
Total votes7,303 100.00

District 70

District 70 [5]
PartyCandidateVotes%
Republican Scott Hill 7,460 100.00
Total votes7,460 100.00

District 71

District 71 [5]
PartyCandidateVotes%
Republican Steven Howe 7,096 100.00
Total votes7,096 100.00

District 72

District 72 [5]
PartyCandidateVotes%
Republican Avery Anderson 6,325 100.00
Total votes6,325 100.00

District 73

District 73 [5]
PartyCandidateVotes%
Republican Les Mason 7,258 100.00
Total votes7,258 100.00

District 74

District 74 [5]
PartyCandidateVotes%
Republican Stephen Owens 6,414 76.80
Libertarian Henry Hein1,93823.20
Total votes8,352 100.00

District 75

District 75 [5]
PartyCandidateVotes%
Republican Will Carpenter 6,813 100.00
Total votes6,813 100.00

District 76

District 76 [5]
PartyCandidateVotes%
Republican Eric Smith 6,623 72.82
Democratic Chuck Torres2,47227.18
Total votes9,095 100.00

District 77

District 77 [5]
PartyCandidateVotes%
Republican Kristey Williams 6,753 100.00
Total votes6,753 100.00

District 78

District 78 [5]
PartyCandidateVotes%
Republican Robyn Essex 5,030 53.50
Democratic W. Michael Shimeall4,37146.50
Total votes9,401 100.00

District 79

District 79 [5]
PartyCandidateVotes%
Republican Webster Roth 5,244 63.43
Democratic Kris Trimmer3,02436.57
Total votes8,268 100.00

District 80

District 80 [5]
PartyCandidateVotes%
Republican Bill Rhiley 5,409 100.00
Total votes5,409 100.00

District 81

District 81 [5]
PartyCandidateVotes%
Republican Blake Carpenter 4,231 100.00
Total votes4,231 100.00

District 82

District 82 [5]
PartyCandidateVotes%
Republican Leah Howell 5,453 65.48
Democratic Misti Hobbs2,87534.52
Total votes8,328 100.00

District 83

District 83 [5]
PartyCandidateVotes%
Democratic Henry Helgerson 3,695 100.00
Total votes3,695 100.00

District 84

District 84 [5]
PartyCandidateVotes%
Democratic Ford Carr 4,067 100.00
Total votes4,067 100.00

District 85

District 85 [5]
PartyCandidateVotes%
Republican Patrick Penn 5,064 57.02
Democratic Jalon Britton3,81742.98
Total votes8,881 100.00

District 86

District 86 [5]
PartyCandidateVotes%
Democratic Silas Miller 2,527 57.79
Republican Rick Lindsey1,84642.21
Total votes4,373 100.00

District 87

District 87 [5]
PartyCandidateVotes%
Republican Susan Estes 4,890 55.72
Democratic Chris Strong3,88644.28
Total votes8,776 100.00

District 88

District 88 [5]
PartyCandidateVotes%
Republican Sandy Pickert 3,022 50.96
Democratic Chuck Schmidt2,90849.04
Total votes5,930 100.00

District 89

District 88 [5]
PartyCandidateVotes%
Democratic KC Ohaebosim 4,547 100.00
Total votes4,547 100.00

District 90

District 90 [5]
PartyCandidateVotes%
Republican Carl Maughan 6,683 100.00
Total votes6,683 100.00

District 91

District 91 [5]
PartyCandidateVotes%
Republican Emil Bergquist 5,826 64.04
Democratic Brooke Chong2,96232.56
Libertarian Steve Baird3093.40
Total votes8,976 100.00

District 92

District 92 [5]
PartyCandidateVotes%
Democratic John Carmichael 4,752 100.00
Total votes4,752 100.00

District 93

District 93 [5]
PartyCandidateVotes%
Republican Brian Bergkamp 6,646 100.00
Total votes6,646 100.00

District 94

District 94 [5]
PartyCandidateVotes%
Republican Leo Delperdang 5,840 64.16
Democratic Robert Howes3,26235.84
Total votes9,102 100.00

District 95

District 95 [5]
PartyCandidateVotes%
Democratic Tom Sawyer 2,433 56.00
Republican Christopher Parisho1,91244.00
Total votes4,345 100.00

District 96

District 96 [5]
PartyCandidateVotes%
Republican Tom Kessler 2,648 100.00
Total votes- 100.00

District 97

District 97 [5]
PartyCandidateVotes%
Republican Nick Hoheisel 4,289 100.00
Total votes4,289 100.00

District 98

District 98 [5]
PartyCandidateVotes%
Republican Cyndi Howerton 3,627 100.00
Total votes3,627 100.00

District 99

District 99 [5]
PartyCandidateVotes%
Republican Susan Humphries 7,273 100.00
Total votes7,273 100.00

District 100

District 100 [5]
PartyCandidateVotes%
Republican Daniel Hawkins 5,641 59.70
Democratic Mike McCorkle3,80840.30
Total votes9,449 100.00

District 101

District 101 [5]
PartyCandidateVotes%
Republican Joe Seiwert 7,501 100.00
Total votes7,501 100.00

District 102

District 102 [5]
PartyCandidateVotes%
Democratic Jason Probst 2,719 52.44
Republican John Whitesel2,46647.56
Total votes5,185 100.00

District 103

District 103 [5]
PartyCandidateVotes%
Democratic Angela Martinez 1,717 73.60
Libertarian Loren John Hermreck61626.40
Total votes2,333 100.00

District 104

District 104 [5]
PartyCandidateVotes%
Republican Paul Waggoner 6,003 60.57
Democratic Garth Strand3,90839.43
Total votes9,911 100.00

District 105

District 105 [5]
PartyCandidateVotes%
Republican Brenda Landwehr 3,788 58.30
Democratic Jaelynn Abegg2,70941.70
Total votes6,497 100.00

District 106

District 106 [5]
PartyCandidateVotes%
Republican Lisa Moser 8,302 100.00
Total votes8,302 100.00

District 107

District 107 [5]
PartyCandidateVotes%
Republican Susan Concannon 7,570 100.00
Total votes7,570 100.00

District 108

District 105 [5]
PartyCandidateVotes%
Democratic Brandon Woodard 6,753 100.00
Total votes6,753 100.00

District 109

District 105 [5]
PartyCandidateVotes%
Republican Troy Waymaster 7,698 85.32
Libertarian Peter Solie1,32414.68
Total votes9,022 100.00

District 110

District 110 [5]
PartyCandidateVotes%
Republican Ken Rahjes 8,366 100.00
Total votes8,366 100.00

District 111

District 111 [5]
PartyCandidateVotes%
Republican Barbara Wasinger 5,038 60.49
Democratic Edward Hammond3,29139.51
Total votes8,329 100.00

District 112

District 112 [5]
PartyCandidateVotes%
Republican Tory Blew 6,074 100.00
Total votes6,074 100.00

District 113

District 113 [5]
PartyCandidateVotes%
Republican Brett Fairchild 6,610 75.99
Democratic Jo Ann Roth2,08924.01
Total votes8,699 100.00

District 114

District 114 [5]
PartyCandidateVotes%
Republican Michael Murphy 7,768 100.00
Total votes7,768 100.00

District 115

District 115 [5]
PartyCandidateVotes%
Republican Gary White 6,738 100.00
Total votes6,738 100.00

District 116

District 116 [5]
PartyCandidateVotes%
Republican Kyle Hoffman 6,996 79.38
Democratic Kristen Barger1,81720.62
Total votes8,813 100.00

District 117

District 117 [5]
PartyCandidateVotes%
Republican Adam Turk 5,813 51.94
Democratic Courtney Tripp5,37848.06
Total votes11,191 100.00

District 118

District 118 [5]
PartyCandidateVotes%
Republican Jim Minnix 8,414 100.00
Total votes8,414 100.00

District 119

District 119 [5]
PartyCandidateVotes%
Republican Jason Goetz 2,213 100.00
Total votes2,213 100.00

District 120

District 120 [5]
PartyCandidateVotes%
Republican Adam Smith 8,120 100.00
Total votes8,120 100.00

District 121

District 121 [5]
PartyCandidateVotes%
Republican John Resman 4,972 54.61
Democratic Mel Pinick4,13345.39
Total votes9,105 100.00

District 122

District 122 [5]
PartyCandidateVotes%
Republican Bill Clifford 4,465 100.00
Total votes4,465 100.00

District 123

District 123 [5]
PartyCandidateVotes%
Republican Bob Lewis 3,746 100.00
Total votes3,746 100.00

District 124

District 124 [5]
PartyCandidateVotes%
Republican David Younger 5,350 100.00
Total votes5,350 100.00

District 125

District 125 [5]
PartyCandidateVotes%
Republican Shannon Francis 2,859 100.00
Total votes2,859 100.00

Related Research Articles

<span class="mw-page-title-main">Kansas Republican Party</span> Kansas affiliate of the Republican Party

The Kansas Republican Party is the state affiliate political party in Kansas of the United States Republican Party. The Kansas Republican Party was organized in May 1859.

<span class="mw-page-title-main">1902–03 United States Senate elections</span>

The 1902–03 United States Senate elections were held on various dates in various states. As these U.S. Senate elections were prior to the ratification of the Seventeenth Amendment in 1913, senators were chosen by state legislatures. Senators were elected over a wide range of time throughout 1902 and 1903, and a seat may have been filled months late or remained vacant due to legislative deadlock. In these elections, terms were up for the senators in Class 3.

<span class="mw-page-title-main">2022 United States gubernatorial elections</span> Election of 39 state governors

United States gubernatorial elections were held on November 8, 2022, in 36 states and three territories. As most governors serve four-year terms, the last regular gubernatorial elections for all but two of the seats took place in the 2018 U.S. gubernatorial elections. The gubernatorial elections took place concurrently with several other federal, state, and local elections, as part of the 2022 midterm elections.

<span class="mw-page-title-main">1982 Illinois elections</span>

Elections were held in Illinois on Tuesday, November 2, 1982.

<span class="mw-page-title-main">2020 Maine House of Representatives election</span>

The 2020 Maine House of Representatives elections took place on November 3, 2020, alongside the biennial United States elections. Maine voters elected members of the Maine House of Representatives via plurality voting in all 151 of the state house's districts, as well as a non-voting member from the Passamaquoddy Tribe.

<span class="mw-page-title-main">2020 United States state legislative elections</span> 2020 U.S. stage legislative elections

The 2020 United States state legislative elections were held on November 3, 2020, for 86 state legislative chambers in 44 states. Across the fifty states, approximately 65 percent of all upper house seats and 85 percent of all lower house seats were up for election. Nine legislative chambers in the five permanently-inhabited U.S. territories and the federal district of Washington, D.C. also held elections. The elections took place concurrently with several other federal, state, and local elections, including the presidential election, U.S. Senate elections, U.S. House elections, and gubernatorial elections.

<span class="mw-page-title-main">2018 United States state legislative elections</span>

The 2018 United States state legislative elections were held on November 6, 2018, for 87 state legislative chambers in 46 states. Across the fifty states, approximately 56 percent of all upper house seats and 92 percent of all lower house seats were up for election. Additionally, six territorial chambers in four territories and the District of Columbia were up as well.

<span class="mw-page-title-main">2020 Kansas House of Representatives election</span> Election in Kansas, United States

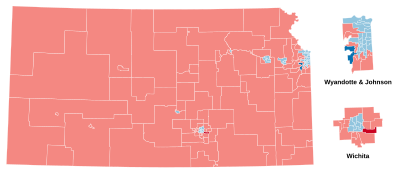
The 2020 Kansas House of Representatives elections took place as a part of the 2020 United States elections. All 125 seats in the Kansas House of Representatives were up for re-election. Representatives serve two year terms and are not term limited.

<span class="mw-page-title-main">2022 Washington House of Representatives election</span> 2022 legislative election in Washington state

The 2022 Washington House of Representatives elections took place as part of the biennial United States elections on November 8, 2022. Washington state voters elected state representatives in all 98 seats of the House, electing 2 state representatives in each of the 49 Washington state legislative districts. State representatives serve two-year terms in the Washington House of Representatives.

<span class="mw-page-title-main">2018 Kansas elections</span>

A general election was held in the state of Kansas on November 6, 2018. Primary elections were held on August 7, 2018.

<span class="mw-page-title-main">2022 United States state legislative elections</span>

The 2022 United States state legislative elections were held on November 8, 2022, for 88 state legislative chambers in 46 states. Across the fifty states, approximately 56 percent of all upper house seats and 92 percent of all lower house seats were up for election. Additionally, six territorial chambers were up in four territories and the District of Columbia. These midterm elections coincided with other state and local elections, including gubernatorial elections in multiple states.

<span class="mw-page-title-main">2022 Wyoming House of Representatives election</span> Legislative election in Wyoming

All 62 members of the Wyoming House of Representatives were elected on November 8, 2022, as part of the 2022 Wyoming elections. Primary elections were held on August 16. Republicans expanded their supermajority, gaining six seats.

<span class="mw-page-title-main">2022 Colorado House of Representatives election</span>

The 2022 Colorado House of Representatives elections took place on November 8, 2022 along with the elections in the State Senate, with the primary elections being held on June 28, 2022. Voters in all 65 districts of the state House elected their representative for a two-year term. It coincided with other Colorado elections of the same year and the biennial United States elections.

<span class="mw-page-title-main">2022 Michigan House of Representatives election</span> American state election

An election was held on November 8, 2022, to elect all 110 members to Michigan's House of Representatives. The election coincided with elections for other offices, including governor, State Senate and U.S. House of Representatives. Democrats won a majority of 56 out of 110 seats, winning control of the chamber for the first time since 2008.

<span class="mw-page-title-main">2022 Massachusetts Senate election</span> State legislative election

An election was held on November 8, 2022, to elect all 40 members to Massachusetts' Senate. The election coincided with elections for other offices, including governor, and U.S. House of Representatives.

<span class="mw-page-title-main">2023 United States state legislative elections</span>

The 2023 United States state legislative elections were held on November 7, 2023, for eight state legislative chambers in four states. These off-year elections coincided with other state and local elections, including gubernatorial elections in three states. Special elections were held throughout the year in several states.

<span class="mw-page-title-main">2022 Kansas elections</span>

2022 Kansas elections was held in the state of Kansas on November 8, 2022. Primary elections were held on August 2, 2022.

<span class="mw-page-title-main">2022 Tennessee elections</span>

Tennessee state elections in 2022 were held on Tuesday, November 8, 2022. Primary elections for the United States House of Representatives, governorship, Tennessee Senate, and Tennessee House of Representatives, as well as various judicial retention elections, including elections for all five Tennessee Supreme Court justices, were held on August 4, 2022. There were also four constitutional amendments to the Constitution of Tennessee on the November 8 ballot.

<span class="mw-page-title-main">2017 United States state legislative elections</span> State legislature elections in the United States

The 2017 United States state legislative elections were held on November 7, 2017. Three legislative chambers in two states held regularly scheduled elections. These off-year elections coincided with other state and local elections, including gubernatorial elections in two states.

Patricia M. Sloop is an American politician who served in the Kansas House of Representatives as a Democrat from the 88th district for one term, from 2013 to 2014.

References

  1. "Welcome | Kansas State Legislature". www.kslegislature.org. Retrieved May 23, 2022.
  2. "Kansas is becoming more divided. Democrats win suburban areas and the GOP holds rural communities". KCUR - Kansas City news and NPR. January 3, 2023. Retrieved April 29, 2023.
  3. "Kansas Secretary of State 2022 General Election Official Vote Totals" (PDF). Kansas Secretary of State . Retrieved December 1, 2022.
  4. Jacobson, Louis (May 19, 2022). "The Battle for State Legislatures" . Retrieved May 19, 2022.
  5. 1 2 3 4 5 6 7 8 9 10 11 12 13 14 15 16 17 18 19 20 21 22 23 24 25 26 27 28 29 30 31 32 33 34 35 36 37 38 39 40 41 42 43 44 45 46 47 48 49 50 51 52 53 54 55 56 57 58 59 60 61 62 63 64 65 66 67 68 69 70 71 72 73 74 75 76 77 78 79 80 81 82 83 84 85 86 87 88 89 90 91 92 93 94 95 96 97 98 99 100 101 102 103 104 105 106 107 108 109 110 111 112 113 114 115 116 117 118 119 120 121 122 123 124 125 "Kansas Secretary of State 2022 General Election Official Vote Totals" (PDF). Kansas Secretary of State . Retrieved December 1, 2022.

See also