2010 Cincinnati Reds season

Last updated

2010  Cincinnati Reds
National League Central Champions
League National League
Division Central
Ballpark Great American Ball Park
City Cincinnati, Ohio
Record91–71 (.562)
Divisional place1st
Owners Bob Castellini
General managers Walt Jocketty
Managers Dusty Baker
Television Fox Sports Ohio
(Thom Brennaman, Paul Keels, Chris Welsh, Jeff Brantley)
Radio WLW (700 AM)
Cincinnati Reds Radio Network
(Marty Brennaman, Jeff Brantley, Jim Kelch)
Stats ESPN.com
BB-reference
  2009 Seasons 2011  

The 2010 Cincinnati Reds season was the 141st season for the franchise in Major League Baseball, and their eighth at Great American Ball Park in Cincinnati. The Reds began their season at home against the St. Louis Cardinals on April 5, losing 11 to 6. Cincinnati was coming off a 78-84 (.481) season and fourth place in the National League Central. The Reds were managed by Dusty Baker, who was in his third season with the team. His coaches were Mark Berry (third base), Billy Hatcher (first base), Brook Jacoby (hitting), Juan Lopez (bullpen), Bryan Price (pitching), and Chris Speier (bench). For the second year in a row, Cincinnati hosted the Major League Baseball Civil Rights Game. They played St. Louis Cardinals and won 4 to 3. The majority owner of the Cincinnati Reds was Robert Castellini; the general manager was Walt Jocketty. Their home field was Great American Ball Park.

Contents

The Cincinnati Reds clinched the National League Central division and a trip to the MLB postseason on September 28 by a walk-off home run from outfielder Jay Bruce. This was the first time the Reds were in the postseason since the 1995 season. The 2010 season ended when the Reds were swept by the Philadelphia Phillies in the NLDS.

Offseason

The 2010 Cincinnati Reds offseason was marked by two key pickups. After acquiring a key player in Scott Rolen midway through the 2009 season, another veteran was added in Orlando Cabrera. In late December 2009, the Reds GM Walt Jocketty made a move to acquire Aroldis Chapman out of Cuba. With the many late season wins in the 2009 season, many picked the Reds to finish higher than they did the previous season.

Regular season

April

May

June

July

August

September

The Reds won the National League Central over second-place St. Louis Cardinals by five games.

Standings

NL Central W L Pct. GB Home Road
Cincinnati Reds 91710.56249–3242–39
St. Louis Cardinals 86760.531552–2934–47
Milwaukee Brewers 77850.4751440–4137–44
Houston Astros 76860.4691542–3934–47
Chicago Cubs 75870.4631635–4640–41
Pittsburgh Pirates 571050.3523440–4117–64

Record vs. opponents


Source: [1]
TeamARIATLCHCCINCOLFLAHOULADMILNYMPHIPITSDSFSTLWSHAL
Arizona 3–41–62–59–93–34–35–133–45–12–42–48–105–134–53–46–9
Atlanta 4–34–23–22–411–75–15–35–211–78–106–34–24–32–68–109–6
Chicago 6–12–44–122–34–27–113–49–63–44–25–103–52–59–64–28–10
Cincinnati 5–22–312–42–55–210–55–411–34–22–510–62–43–46–124–38–7
Colorado 9–94–23–25–23–42–47–115–43–31–63–412–69–93–45–39–6
Florida 3–37–112–42–54–33–34–24–412–65–136–23–62–53–213–57–8
Houston 3–41–511–75–104–23–32–48–73–44–311–42–52–710–54–43–12
Los Angeles 13–53–54–34–511–72–44–24–23–42–44–38–108–103–43–34–11
Milwaukee 4–32–56–93–114–54–47–82–45–21–513–53–42–58–74–29–6
New York 1–57–114–32–43–36–124–34–32–59–96–13–33–43–39–913–5
Philadelphia 4–210–82–45–26–113–53–44–25–19–92–45–23–34–412–610–8
Pittsburgh 4–23–610–56–104–32–64–113–45–131–64–20–62–46–91–52–13
San Diego 10–82–45–34–26–126–35–210–84–33–32–56–012–63–43–39–6
San Francisco 13–53–45–24–39–95–27–210–85–24–33–34–26–123–34–27–8
St. Louis 5–46–26–912–64–32–35–104–37–83–34–49–64–33–33–39–6
Washington 4–310–82–43–43–55–134–43–32–49–96–125–13–32–43–35–13

Detailed record

TeamHomeAwayTotalWin %Gms Left
NL East
Atlanta Braves 2–10–22–3.4000
Florida Marlins 3–02–25–2.7140
New York Mets 2–12–14–2.6670
Philadelphia Phillies 2–10–42–5.2860
Washington Nationals 2–22–14–3.5710
11–56–1017–15.5310
NL Central
Chicago Cubs 6–36–112–4.7500
Houston Astros 4–26–310–5.6670
Milwaukee Brewers 7–14–211–3.7690
Pittsburgh Pirates 5–25–410–6.6150
St. Louis Cardinals 3–63-66–12.3330
23–1224–1646–28.6220
NL West
Arizona Diamondbacks 2-23–05–2.7140
Colorado Rockies 2–10–42–5.2860
Los Angeles Dodgers 3–32–15–4.5560
San Diego Padres 1–21–22–4.3330
San Francisco Giants 2–21-23–4.4290
10–107–917–19.4720
American League
Cleveland Indians 2–12–14–2.6670
Kansas City Royals 1–2N/A1–2.3330
Oakland Athletics N/A3–03–01.0000
Seattle Mariners N/A0–30–3.0000
3–45–48–8.5000
MonthGamesWonLostWin %
April231211.522
May291811.621
June271413.519
July261412.538
August27198.704
September271215.444
October221.667
1629171.562
GamesWonLostWin %
Home814932.605
Away814239.519

Game log

Legend
Reds WinReds LossGame Postponed
2010 Game Log
April (12–11)
#DateOpponent (TV)ScoreWinLossSaveAttendanceRecord
1April 5 Cardinals (FSO, ESPN)L 6–11 Carpenter (1–0) Harang (0–1)42,4930–1
2April 7 Cardinals (FSO)L 3–6 Wainwright (1–0) Herrera (0–1) Franklin (1)28,1320–2
3April 8 Cardinals W 2–1 Cordero (1–0) Motte (0–1)13,4451–2
4April 9 Cubs (FSO)W 5–4 Owings (1–0) Caridad (0–1) Cordero (1)24,4192–2
5April 10 Cubs (FSO)L 3–4 Zambrano (1–1) Rhodes (0–1) Mármol (2)27,2352–3
6April 11 Cubs (FSO)W 3–1 Masset (1–0) Garbow (0–2) Cordero (2)26,9453–3
7April 12@ Marlins (FSO)W 6–5 (10) Masset (2–0) Badenhop (0–1) Cordero (3)10,1194–3
8April 13@ Marlins (FSO)W 10–8 (11) Owings (2–0) Meyer (0–1) Cordero (4)10,6815–3
9April 14@ Marlins (FSO)L 3–5 Volstad (1–1) Bailey (0–1) Badenhop (1)14,3905–4
10April 15@ Marlins (FSO)L 2–10 Johnson (1–1) Harang (0–2)12,9125–5
11April 16@ Pirates (FSO)L 3–4 Dotel (1–0) Masset (2–1)14,7585–6
12April 17@ Pirates (FSO)L 4–5 Taschner (1–0) Cordero (1–1)25,1965–7
13April 18@ Pirates (FSO)L 3–5 Maholm (1–1) Arroyo (0–1) Dotel (3)13,8605–8
14April 20 Dodgers (FSO)W 11–9 Lincoln (1–0) Troncoso (1–1) Cordero (5)12,9656–8
15April 21 Dodgers (FSO)L 6–14 Kuroda (2–0) Harang (0–3)12,2036–9
16April 22 Dodgers (FSO)W 8–5 Leake (1–0) Kuo (0–1) Cordero (6)13,2617–9
17April 23 Padres (FSO)L 4–10 Correia (3–1) Arroyo (0–2)15,1837–10
18April 24 Padres (FSO)L 0–5 LeBlanc (1–0) Cueto (0–1)19,9997–11
19April 25 Padres (FSO)W 5–4 Rhodes (1–1) Adams (0–1) Cordero (7)17,6948–11
20April 27@ Astros (FSO)W 6–2 Harang (1–3) Norris (1–2)22,4679–11
21April 28@ Astros (FSO)W 6–4 Leake (2–0) Paulino (0–3)21,03510–11
22April 29@ Astros (FSO)W 4–2 Arroyo (1–2) Oswalt (2–3) Cordero (8)21,49311–11
23April 30@ Cardinals (FSO)W 3–2 Cueto (1–1) Penny (3–1) Cordero (9)39,85012–11
May (18–11)
#DateOpponent (TV)ScoreWinLossSaveAttendanceRecord
24May 1@ Cardinals (FSO)L 3–6 Franklin (1–0) Fisher (0–1)41,53612–12
25May 2@ Cardinals (FSO)L 0–6 Carpenter (4–0) Harang (1–4)43,29212–13
26May 3 Mets (FSO)W 3–2 (11) Masset (3–1) Acosta (1–1)14,35013–13
27May 4 Mets (FSO)L 4–5 Feliciano (1–0) Cordero (1–2) Rodríguez (4)13,81313–14
28May 5 Mets W 5–4 (10) Owings (3–0) Feliciano (1–1)16,79814–14
29May 7 Cubs (FSO)L 7–14 Silva (3–0) Bailey (0–2)20,03014–15
30May 8 Cubs (FSO)W 14–2 Harang (2–4) Gorzelanny (1–4)29,40415–15
31May 9 Cubs (FSO)W 5–3 Leake (3–0) Dempster (2–3) Cordero (10)20,40216–15
32May 10@ Pirates (FSO)W 2–1 Arroyo (2–2) Ohlendorf (0–1) Cordero (11)9,04517–15
33May 11@ Pirates (FSO)W 9–0 Cueto (2–1) Morton (1–6)9,02718–15
34May 12@ Pirates W 5–0 Bailey (1–2) Duke (2–4)20,06419–15
35May 14 Cardinals (FSO)L 3–4 García (2–4) Harang (2–5) Franklin (8)27,56819–16
36May 15 Cardinals (FSO)W 4–3 Leake (4–0) Wainwright (5–2) Cordero (12)41,32620–16
37May 16 Cardinals (FSO)W 7–2 Arroyo (3–2) Penny (3–4)26,71221–16
38May 17 Brewers (FSO)W 6–3 Cueto (3–1) Coffey (1–1) Cordero (13)12,40922–16
39May 18 Brewers W 5–4 Fisher (1–1) Hoffman (1–3)17,69723–16
40May 19@ Braves (FSO)L 4–5 Wagner (4–0) Masset (3–2)25,34723–17
41May 20@ Braves L 9–10 Kimbrel (1–0) Cordero (1–3)21,62123–18
42May 21@ Indians (FSO)W 7–4 Arroyo (4–2) Laffey (0–1) Cordero (14)23,02824–18
43May 22@ Indians (FSO)W 6–4 Cueto (4–1) Carmona (4–2)25,53125–18
44May 23@ Indians (FSO)L 3–4 Huff (2–6) Herrera (0–2) Wood (1)21,04425–19
45May 24 Pirates (FSO)W 7–5 Harang (3–5) Burres (2–2) Cordero (15)13,38526–19
46May 25 Pirates (FSO)L 1–2 Hanrahan (1–0) Masset (3–3) Dotel (10)14,47126–20
47May 26 Pirates (FSO)W 4–0 Arroyo (5–2) Ohlendorf (0–3)18,17327–20
48May 27 Pirates (FSO)W 8–2 Cueto (5–1) Morton (1–9)16,83428–20
49May 28 Astros (FSO)W 15–6 LeCure (1–0) Rodríguez (2–7)30,81329–20
50May 29 Astros (FSO)W 12–2 Harang (4–5) Moehler (0–2)36,91830–20
51May 30 Astros (FSO)L 0–2 (10) Lyon (4–1) Owings (3–1) Lindstrom (11)36,03830–21
52May 31@ Cardinals (FSO)L 4–12 García (5–2) Arroyo (5–3)40,78230–22
June (14–13)
#DateOpponent (TV)ScoreWinLossSaveAttendanceRecord
53June 1@ Cardinals (FSO)W 9–8 Del Rosario (1–0) Reyes (2–1) Cordero (16)37,41431–22
54June 2@ Cardinals (FSO)L 1–4 Carpenter (7–1) LeCure (1–1) McClellan (1)39,29531–23
55June 4@ Nationals (FSO)L 2–4 Clippard (8–3) Del Rosario (1–1) Capps (18)33,77431–24
56June 5@ Nationals (FSO)W 5–1 Leake (5–0) Atilano (5–1)22,89632–24
57June 6@ Nationals (FSO)W 5–4 (10) Cordero (2–3) Slaten (2–1) Masset (1)27,20233–24
58June 7 Giants (FSO)L 5–6 Romo (2–3) Herrera (0–3) Wilson (17)18,45733–25
59June 8 Giants (FSO)L 0–3 Cain (5–4) LeCure (1–2)13,01133–26
60June 9 Giants (FSO)W 6–3 Harang (5–5) Sánchez (4–5)14,70034–26
61June 10 Giants W 7–6 Rhodes (2–1) Mota (0–2) Cordero (17)19,24135–26
62June 11 Royals (FSO)L 5–6 (11) Marte (1–0) Owings (3–2) Soria (15)25,84735–27
63June 12 Royals (FSO)W 11–5 Cueto (6–1) Bannister (6–4)34,24036–27
64June 13 Royals (FSO)L 3–7 Greinke (2–8) LeCure (1–3)23,74736–28
65June 15 Dodgers (FSO)L 0–12 Kuroda (6–4) Harang (5–6)22,63936–29
66June 16 Dodgers (FSO)L 2–6 Kershaw (7–3) Leake (5–1) Kuo (1)22,08336–30
67June 17 Dodgers W 7–1 Arroyo (6–3) Ely (3–4)25,58537–30
68June 18@ Mariners (FSO)L 0–1 Lee (5–3) Cueto (6–2)43,36237–31
69June 19@ Mariners (FSO)L 1–5 Hernández (5–5) LeCure (1–4)26,46837–32
70June 20@ Mariners (FSO)L 0–1 Rowland-Smith (1–6) Harang (5–6) Aardsma (15)32,71237–33
71June 21@ Athletics (FSO)W 6–4 (10) Cordero (3–3) Wuertz (2–1) Smith (1)11,08838–33
72June 22@ Athletics (FSO)W 4–2 Arroyo (7–3) Braden (4–7) Cordero (18)12,13639–33
73June 23@ Athletics W 3–0 Cueto (7–2) Mazzaro (2–2) Cordero (19)20,82440–33
74June 25 Indians (FSO)W 10–3 Harang (6–7) Laffey (0–2)32,84441–33
75June 26 Indians W 6–4 Herrera (1–3) Masterson (2–7) Cordero (20)37,75742–33
76June 27 Indians (FSO)L 3-5 Talbot (8–6) Arroyo (7–4) Wood (6)25,87742–34
77June 28 Phillies (FSO)W 7–3 Cueto (8–2) Kendrick (4–3)22,09043–34
78June 29 Phillies (FSO)L 6–9 (10) Lidge (1–0) Rhodes (2–2) Romero (3)26,67943–35
79June 30 Phillies W 4–3 Rhodes (3–2) Halladay (9–7) Cordero (21)27,24544–35
July (14–12)
#DateOpponent (TV)ScoreWinLossSaveAttendanceRecord
80July 1@ Cubs (FSO)W 3–2 (10) Smith (1–0) Howry (1–2) Cordero (22)36,88045–35
81July 2@ Cubs (FSO)W 12–0 Arroyo (8–4) Dempster (6–7)40,36146–35
82July 3@ Cubs (FSO)L 1–3 Wells (4–6) Smith (1–1) Mármol (15)40,66746–36
83July 4@ Cubs (FSO)W 14–3 Leake (6–1) Lilly (3–7)41,07947–36
84July 5@ Mets (FSO)W 8–6 Smith (2–1) Pelfrey (10–3) Cordero (23)36,76448–36
85July 6@ Mets (FSO)L 0–3 Santana (6–5) Maloney (0-1)27,47348–37
86July 7@ Mets (FSO, ESPN)W 3–1 Arroyo (9–4) Niese (6–3) Cordero (24)30,02949–37
87July 8@ Phillies (FSO, MLBN)L 3–4 (12) Figueroa (2–1) Smith (2–2)45,08649–38
88July 9@ Phillies (FSO)L 7–9 (10) Madson (2–0) Rhodes (3–3)45,02949–39
89July 10@ Phillies (FSO, MLBN)L 0–1 (11) Contreras (4–3) Bray (0–1)45,34749–40
90July 11@ Phillies (FSO)L 0–1 Hamels (7–7) Maloney (0–2) Lidge (6)44,91349–41
July 13: 2010 MLB All-Star Game – Anaheim, California at Angel Stadium ( National League: 3, American League: 1)
91July 16 Rockies (FSO)W 3–2 Arroyo (10–4) Hammel (7–4) Cordero (25)37,18850–41
92July 17 Rockies (FSO)W 8–1 Vólquez (1–0) de la Rosa (3–2)41,30051–41
93July 18 Rockies (FSO)L 0–1 Cook (5–4) Wood (0–1) Street (6)25,15951–42
94July 19 Nationals (FSO)W 7–2 Cueto (9–2) Martin (1–5)21,24352–42
95July 20 Nationals (FSO)W 8–7 Leake (7–1) Atilano (6–7) Cordero (26)22,87653–42
96July 21 Nationals (FSO, ESPN)L 5–8 Strasburg (5–2) Arroyo (10–5) Capps (24)37,86853–43
97July 22 Nationals L 1–7 Hernández (7–6) Vólquez (1–1)23,11553–44
98July 23@ Astros (FSO)W 6–4 Ondrusek (1–0) Byradk (1–1) Cordero (27)30,57554–44
99July 24@ Astros (FSO)W 7–0 Cueto (10–2) Oswalt (6–12)31,55255–44
100July 25@ Astros (FSO)L 0-4 Rodríguez (8–11) Leake (7–2)25,70555–45
101July 26@ Brewers (FSO)L 1–2 Villanueva (1–0) Arroyo (10–6) Axford (15)31,94555–46
102July 27@ Brewers (FSO)W 12–4 Ondrusek (2–0) Gallardo (9–5)32,28656–46
103July 28@ Brewers (FSO)W 10–2 Wood (1–1) Narveson (8–7)38,36557–46
104July 30 Braves (FSO)L 4–6 (10) Chavez (3–2) Cordero (3–4) Wagner (24)40,37357–47
105July 31 Braves (Fox)W 5–2 Arroyo (11–6) Jurrjens (3–4) Cordero (28)41,61158–47
August (19–8)
#DateOpponent (TV)ScoreWinLossSaveAttendanceRecord
106August 1 Braves (FSO)W 2–1 Vólquez (2–1) Hanson (8–8) Cordero (29)40,87159–47
107August 2@ Pirates (FSO)W 4–0 Wood (2–1) Ohlendorf (1–9)15,17260–47
108August 3@ Pirates (FSO)L 6–7 Maholm (7–9) Leake (7–3) Hanrahan (1)13,62360–48
109August 4@ Pirates W 9–4 Cueto (11–2) Karstens (2-7)20,42061–48
110August 6@ Cubs (FSO)W 3–0 Arroyo (12–6) Gorzelanny (6–6) Cordero (30)40,69662–48
111August 7@ Cubs (FSO)W 4–3 Ondrusek (3–0) Wells (5–10) Masset (2)41,22763–48
112August 8@ Cubs (FSO)W 11–4 Wood (3–1) Diamond (0–2)39,01664–48
113August 9 Cardinals (FSO, ESPN)L 3–7 Carpenter (13–3) Leake (7–4)36,35364–49
114August 10 Cardinals (FSO)L 4–8 García (11–5) Cueto (11–3)36,96464–50
115August 11 Cardinals (FSO)L 1–6 Wainwright (17–6) Arroyo (12–7)33,36464–51
116August 13 Marlins (FSO)W 7–2 Vólquez (3–1) Johnson (10–5)29,57165–51
117August 14 Marlins (FSO)W 5–4 Leake (8–4) West (0–2) Cordero (31)37,44566–51
118August 15 Marlins (FSO)W 2–0 Bailey (2–2) Sánchez (9–8) Cordero (32)29,84967–51
119August 17@ Diamondbacks (FSO)W 6–2 Arroyo (13–7) Hudson (3–1)21,50268–51
120August 18@ Diamondbacks (FSO)W 11–7 Rhodes (4–3) Heilman (3–4)15,50969–51
121August 19@ Diamondbacks (FSO)W 9–5 Wood (4–1) Saunders (1–3)17,38570–51
122August 20@ Dodgers (FSO)W 3–1 Bailey (3–2) Monasterios (3–4) Cordero (33)46,41871–51
123August 21@ Dodgers (FSO)L 5–8 Billingsley (10–7) Cueto (11–4) Broxton (22)49,43571–52
124August 22@ Dodgers (FSO)W 5–2 Arroyo (14–7) Kershaw (11–8) Cordero (34)44,78872–52
125August 23@ Giants (FSO, ESPN)L 2-11 Cain (10-10) Vólquez (14–7)32,69872-53
126August 24@ Giants (FSO)L 5-16 Casilla (5-2) Wood 4-236,10472-54
127August 25@ Giants (FSO)W 12–11 (12) Cordero (4–4) Zito (8-9)36,31073-54
128August 27 Cubs (FSO)W 6-1 Cueto (12–4) Gorzelanny (7-8)36,21974-54
129August 28 Cubs (FSO)L 2-3 Wells (6-12) Arroyo (14-8) Mármol (24)41,29274-55
130August 29 Cubs (FSO)W 7-5 Ondrusek (4-0) Marshall (6-5) Cordero (35)30,80975-55
131August 30 Brewers (FSO)W 5–4 (10) Cordero (5-4) Hoffman (2-7)14,58976–55
132August 31 Brewers (FSO)W 8–4 LeCure (2-4) Gallardo (11-7)19,21877–55
September (12–15)
#DateOpponent (TV)ScoreWinLossSaveAttendanceRecord
133September 1 Brewers (FSO)W 6–1 Champman (1–0) Coffey (2–3)16,41278–55
134September 3@ Cardinals (FSO)L 2–3 García (13–6) Arroyo (14–9) Franklin (23)43,54078–56
135September 4@ Cardinals (Fox)W 6–1 Wood (5–2) Wainwright (17–10)44,95779–56
136September 5@ Cardinals (FSO)L 2–4 Carpenter (15–5) Bailey (3–2) Franklin (24)43,96379–57
137September 6@ Rockies (FSO)L 5–10 Jiménez (18–6) Bray (0–2)40,23779–58
138September 7@ Rockies (FSO)L 3–4 Chacín (8-9) Cueto (12–5) Street (16)29,16479–59
139September 8@ Rockies (FSO)L 2–9 Cook (6-8) Arroyo (14-10)28,27179–60
140September 9@ Rockies L 5–6 Belisle (7-5) Masset (3-4) Street (17)25,21379–61
141September 10 Pirates (FSO)W 4–3 (12) Smith (3-2) Ledezma (0-2)24,90880–61
142September 11 Pirates (FSO)W 5–4 (10) Cordero (6-4) Thomas (0-1)36,10181–61
143September 12 Pirates (FSO)L 1-3 Park (3-3) Cordero (6-5) Hanrahan (5)26,61781–62
144September 13 Diamondbacks (FSO)W 7–2 Arroyo (15-10) Enright (6-4)12,06182–62
145September 14 Diamondbacks (FSO)L 1-3 Hudson (7-2) Wood (5-3) Gutierrez (9)16,97382–63
146September 15 Diamondbacks (FSO)W 7-5 Maloney (1-2) Saunders (2-6) Cordero (36)19,12383–63
147September 16 Diamondbacks (FSO)L 1-3 Lopez (6-14) Vólquez (3-3) Gutierrez (10)22,09083–64
148September 17@ Astros (FSO)L 3-5 Fulchino (2-0) Chapman (1-1) Lyon (17)30,21883–65
149September 18@ Astros (FSO)W 11-1 Arroyo (16-10) Figueroa (5-3) 29,85584–65
150September 19@ Astros (FSO)L 3-4 Myers (13-7) Wood (5-4) Lyon (18)32,52084–66
151September 20@ Brewers (FSO)W 5-2 Masset (4-4) Loe (3-5) Cordero (37)30,02485–66
152September 21@ Brewers (FSO)W 4-3 Vólquez (4-3) Bush (7-13) Cordero (38)22,76186–66
153September 22@ Brewers (FSO)L 1–13 Wolf (13–11) Cueto (12–6)27,00486–67
154September 24@ Padres (FSO)L 3–4 Gregerson (4–7) Rhodes (4–4) Bell (44)35,31086–68
155September 25@ Padres (Fox)L 3–4 Bell (6–0) Chapman (1-2)35,12486–69
156September 26@ Padres (FSO)W 12–2 Bailey (4-3) Richard (13-9)26,13187–69
157September 28 Astros (FSO)W 3–2 Chapman (2-2) Byrdak (2-2)30,15188–69
158September 29 Astros (FSO)L 0-2 Figueroa (6-4) Cueto (12-7) Lyon (20)14,76088–70
159September 30 Astros (FSO)W 9-1 Arroyo (17-10) Myers (14-8)17,55889–70
October (2-1)
#DateOpponent (TV)ScoreWinLossSaveAttendanceRecord
160October 1 Brewers (FSO)L 3-4 (11) McClendon (2-0) Lecure (2-5) Axford (24)28,88489-71
161October 2 Brewers (FSO)W 7-4 Ondrusek (5-0) Coffey (2-4) Cordero (39)28,17390-71
162October 3 Brewers (FSO)W 3-2 Maloney (2-2) Wolf (13-12) Cordero (40)37,58291-71

Postseason

Game log

Legend
Reds WinReds LossGame Postponed
2010 Postseason Game Log
National League Division Series: vs. Philadelphia Phillies (PHI wins 3–0)
#DateOpponent (TV)ScoreWinLossSaveAttendanceSeries
1October 6@ Phillies (TBS)L 0–4 Halladay (1–0) Vólquez (0–1)46,411PHI 1–0
2October 8@ Phillies (TBS)L 4–7 Contreras (1–0) Chapman (0–1) Lidge (1)46,511PHI 2–0
3October 10 Phillies (TBS)L 0–2 Hamels (1–0) Cueto (0–1)44,599PHI 3–0

Series Notes

National League Division Series: vs. Philadelphia Phillies

Game 1

Wednesday, October 6, 2010 – 5:07 pm (ET) at Citizens Bank Park in Philadelphia, Pennsylvania

Team123456789 R H E
Cincinnati000000000001
Philadelphia130000000450
WP: Halladay (1-0)   LP: Vólquez (0-1)   Sv: None
Home runs:
CIN: None
PHI: None

In his first career postseason start, Phillies ace Roy Halladay hurled a no-hitter, giving up only one walk (to Jay Bruce in the fifth inning). Halladay's was only the second postseason no-hitter in Major League Baseball history, and the first since Don Larsen's perfect game in the 1956 World Series. [2]

During the 2010 regular season, Halladay had thrown a perfect game on the road against the Florida Marlins on May 29. He thus became the only pitcher to throw a no-hitter or perfect game in the regular season and a no-hitter in the postseason in the same year. Halladay is also the fifth major league pitcher to throw two no-hitters in the same season, and the first since Nolan Ryan in 1973.

Game 2

Friday, October 8, 2010 – 6:07 pm (ET) at Citizens Bank Park in Philadelphia, Pennsylvania

Team123456789 R H E
Cincinnati110110000464
Philadelphia00002131X782
Starting pitchers:
CIN: Bronson Arroyo (0–0)
PHI: Roy Oswalt (0–0) -->
WP: José Contreras (1–0)   LP: Aroldis Chapman (0–1)   Sv: Brad Lidge (1)
Home runs:
CIN: Brandon Phillips (1), Jay Bruce (1)
PHI: None

On the fourth pitch he saw, Brandon Phillips hit a solo home run to lead off the first inning. This is both the first hit and first run since 1995 for the Reds in the postseason. [3] Laynce Nix scored another run in the top of the second inning on two throwing errors and a wild pitch.

Jay Bruce also hit a lead-off solo homer in the third inning to increase the lead to 3–0. In the top of the fifth inning, Phillips hit a lead-off double, advanced to third base on a sacrifice bunt, then scored on Joey Votto's sacrifice fly.

The Phillies mounted their attack in the bottom of the fifth inning. Pinch-hitter Domonic Brown reached first base on a fielder's choice, then the Phillies loaded the bases on two consecutive defensive errors. Chase Utley delivered a two-out RBI single to get the Phillies on board. But Arroyo struck out Ryan Howard to limit the damage at two.

The Phillies scored again in the sixth inning. Jayson Werth walked, stole second, then scored after two batters were hit by pitches and a bases-loaded walk by Reds relievers Arthur Rhodes and Logan Ondrusek.

The Reds sent flame-thrower Aroldis Chapman to the mound in the bottom of the seventh inning. He hit Chase Utley, the third time by Reds' relievers in the night, then struck out Ryan Howard. Werth hit a ground ball to Reds third baseman Scott Rolen, but Utley was called safe at second base. The next batter Jimmy Rollins hit a fly ball to right field, but the Reds right fielder Jay Bruce lost it in the lights; Reds second baseman Phillips also missed the relay catch. These two crucial errors—the third and fourth on the night—let both Utley and Werth score. Rollins scored later on Raúl Ibañez's single and Carlos Ruiz's RBI force-out. Reds reliever Nick Masset replaced Chapman and got Shane Victorino to ground out to end the inning. The Phillies took the 6–4 lead on Reds' errors into the eighth inning.

In the bottom of the eighth inning, Utley hit a one-out single then stole second. Masset intentionally walked Howard, to set up a potential double play for the next batter. However, Werth hit an RBI single to left field to score Utley.

Phillies closer Brad Lidge closed the ninth for the save.

The six combined errors tied an LDS record previously set by the Athletics and Red Sox in the 2003 ALDS. [4]

Game 3

Sunday, October 10, 2010 – 8:07 pm (ET) at Great American Ball Park in Cincinnati, Ohio

Team123456789 R H E
Philadelphia100010000281
Cincinnati000000000052
WP: Cole Hamels (1-0)   LP: Johnny Cueto (0-1)
Home runs:
PHI: Chase Utley (1)
CIN: none

Cincinnati was again dominated by Phillies' starting pitching. Cole Hamels pitched a complete-game shutout, striking out nine while allowing five hits. Plácido Polanco scored for the Phillies on Orlando Cabrera's throwing error in the top of the first inning. Chase Utley added another run to the lead by hitting a solo home run in the fifth inning.

Roster

2010 Cincinnati Reds
Roster
PitchersCatchers

Infielders

OutfieldersManager

Coaches

Player stats

Batting

Starters by position

Note: Pos = Position; G = Games played; AB = At bats; H = Hits; Avg. = Batting average; HR = Home runs; RBI = Runs batted in

PosPlayerGABHAvg.HRRBI
2B Brandon Phillips 155626172.2751859
SS Orlando Cabrera 123494130.263442
1B Joey Votto 150547177.32437113
CF Drew Stubbs 150514131.2552277
RF Jay Bruce 148509143.2812570
LF Jonny Gomes 148511136.2661886
3B Scott Rolen 133471134.2852083
C Ramón Hernández 9731393.297748

Stats through October 3, 2010

Other batters

Note: Pos = Position; G = Games played; AB = At bats; H = Hits; Avg. = Batting average; HR = Home runs; RBI = Runs batted in

PosPlayerGABHAvg.HRRBI
LF Laynce Nix 9716548.291418
UT Miguel Cairo 9120058.290428
C Ryan Hanigan 7020361.300540
OF Chris Heisey 9720151.254821
IF Paul Janish 8220052.260525
3B Juan Francisco 365515.27317
OF Chris Dickerson 20449.20500
OF Jim Edmonds 13296.20733
SS Chris Valaika 193810.26312
C Corky Miller 327418.24329
1B Yonder Alonso 22296.20703
RF Willie Bloomquist 11175.29400
IF Drew Sutton 232.66714
P Bronson Arroyo 326810.14718
P Homer Bailey 18337.21202
P Francisco Cordero 7010.00000
P Johnny Cueto 28546.11102
P Carlos Fisher 1740.00000
P Aaron Harang 21375.13502
P Mike Leake 274816.33303
P Sam LeCure 14111.09100
P Matt Maloney 731.33301
P Logan Ondrusek 5940.00000
P Jordan Smith 3530.00000
P Edinson Vólquez 12172.11800
P Travis Wood 17377.18913

Stats through October 3, 2010

Pitching

Starting and other pitchers

G = Games pitched ; IP = Innings pitched ; W = Wins ; L = Losses ; ERA = Earned run average ; SO = Strikeouts ; WHIP = Walks and hits per inning pitched

PlayerGIPWLERASOWHIP
Bronson Arroyo 33215.217103.881211.15
Homer Bailey 19109.0434.461001.37
Johnny Cueto 31185.21273.641381.28
Aaron Harang 22111.2675.32821.59
Mike Leake 24138.1844.23911.50
Sam LeCure 1548.0254.50371.56
Matt Maloney 720.2223.05121.21
Edinson Vólquez 1262.2434.31671.50
Travis Wood 17102.2543.51861.08

Stats Through October 3, 2010

Relief pitchers

G = Games pitched ; W = Wins ; L = Losses ; SV = Saves ; IP = Innings pitched ; ERA = Earned run average ; SO = Strikeouts ; WHIP = Walks and hits per inning pitched.

PlayerGWLSVIPERASOWHIP
Bill Bray 3502028.14.13301.09
Jared Burton 40003.10.0010.00
Aroldis Chapman 1522013.12.03191.05
Francisco Cordero 75654072.23.84591.43
Carlos Fisher 1811022.15.64211.57
Danny Herrera 3613023.03.91141.61
Mike Lincoln 1911019.27.32121.78
Nick Masset 8244276.23.40851.27
Logan Ondrusek 6050058.23.68391.18
Micah Owings 2232033.15.40351.59
Arthur Rhodes 6944055.02.29501.02
Enerio Del Rosario 91108.22.0831.96
Jordan Smith 3732142.03.86261.33
Russ Springer 20001.25.40351.59

Stats Through October 3, 2010

Team Leaders/Team Rank

As of October 3, 2010

StatPlayerValueNL Rank
Runs Votto 1064th
Hits Votto 1776th
Doubles Votto 3617th
Triples Stubbs 6T-13th
Home Runs Votto 373rd
RBI Votto 1133rd
Stolen Bases Stubbs 308th
Batting Avg. Votto .3242nd
Wins Arroyo 174th
ERA (+100 IP) Cueto 3.6424th
Innings Pitched Arroyo 215.28th
Strikeouts Cueto 13833rd

Awards

All-Star

Hank Aaron Award

NL Most Valuable Player Award

Gold Glove

Minor league affiliates

LevelTeamRecordPlaceManager
AAA Louisville Bats 79-641st Rick Sweet
AA Carolina Mudcats 58-795th David Bell
Advanced A Lynchburg Hillcats 61-774th Pat Kelly
A Dayton Dragons 53-758th Todd Benzinger
Rookie
Billings Mustangs 38-373rd Delino DeShields
AZL Reds 31-242nd Julio Garcia
DSL Reds 45-272ndJoel Noboa
VSL Reds 35-334thJosé Nieves

Local television

Fox Sports Ohio

Local radio

Cincinnati Reds Radio Network

Related Research Articles

<span class="mw-page-title-main">Roy Halladay</span> American baseball pitcher (1977–2017)

Harry Leroy "Roy" Halladay III was an American professional baseball pitcher, who played in Major League Baseball (MLB) for the Toronto Blue Jays and Philadelphia Phillies between 1998 and 2013. His nickname, "Doc", was coined by Toronto Blue Jays announcer Tom Cheek, and was a reference to Wild West gunslinger Doc Holliday. An eight-time All-Star, Halladay was one of the most dominant pitchers of his era. Known for his outstanding durability, he led the league in complete games seven times, the most of any pitcher whose career began after 1945. He also led the league in strikeout-to-walk ratio five times and innings pitched four times.

<span class="mw-page-title-main">No-hitter</span> Baseball game in which a team does not record a hit

In baseball, a no-hitter or no-hit game is a game in which a team does not record a hit. Major League Baseball (MLB) officially defines a no-hitter as a completed game in which a team that batted in at least nine complete innings recorded no hits. A pitcher who prevents the opposing team from achieving a hit is thereby said to have "thrown a no-hitter". In most cases, no-hitters are recorded by a single pitcher who throws a complete game; one thrown by two or more pitchers is a combined no-hitter.

<span class="mw-page-title-main">2006 World Series</span> 102nd edition of Major League Baseballs championship series

The 2006 World Series was the championship series of Major League Baseball's (MLB) 2006 season. The 102nd edition of the World Series, it was a best-of-seven playoff between the American League (AL) champion Detroit Tigers and the National League (NL) champion St. Louis Cardinals; the Cardinals won the series in five games to win their tenth World Series championship. This was the third World Series meeting between the Tigers and the Cardinals, the first in 38 years. The Cardinals won the first in 1934, and the Tigers won the second in 1968; each went the full seven games.

<span class="mw-page-title-main">2004 St. Louis Cardinals season</span>

The St. Louis Cardinals 2004 season was the team's 123rd season in St. Louis, Missouri and the 113th season in the National League. The Cardinals went 105–57 during the season, the most wins of any Cardinals team since 1944, and the first Cardinal team to win 100 or more games since 1985, and won the National League Central by 13 games over the NL Wild-Card Champion Houston Astros. In the playoffs the Cardinals defeated the Los Angeles Dodgers 3 games to 1 in the NLDS and the Astros 4 games to 3 in the NLCS to reach their first World Series since 1987. In the World Series the Cardinals faced the Boston Red Sox and were swept 4 games to 0. It was the final World Series played at Busch Memorial Stadium. Because the American League had home-field advantage as a result of winning the All-Star Game, Busch Memorial Stadium was where the Curse of the Bambino died.

<span class="mw-page-title-main">2008 Philadelphia Phillies season</span> Major League Baseball season

The Philadelphia Phillies' 2008 season was the 126th in the history of the franchise. The team finished with a regular season record of 92–70, first in the National League East. In the postseason, the Phillies won the World Series; this was the first major sports championship for Philadelphia since the 76ers swept the 1983 NBA Finals. During the season, they were managed by Charlie Manuel. To date, this is the most recent season the Phillies won the World Series.

The 2008 Toronto Blue Jays season, the team's 32nd year of existence, saw the Blue Jays finish in fourth place in the American League East with a record of 86 wins and 76 losses for a .531 winning percentage, thus making this season the third consecutive winning season for the Jays, as well as being the highest win–loss record since their 2006 season.

The following are the baseball events of the year 2009 throughout the world.

<span class="mw-page-title-main">2009 Philadelphia Phillies season</span> Major League Baseball season

The Philadelphia Phillies' 2009 season was the 127th season in the history of the franchise. The team, managed by Charlie Manuel, began their sixth season at Citizens Bank Park and defense of their 2008 World Series championship on April 5. After collecting a third straight National League East championship, the Phillies won their second consecutive National League pennant for the first time in franchise history; however they were defeated by the New York Yankees in the World Series.

<span class="mw-page-title-main">2009 National League Championship Series</span>

The 2009 National League Championship Series (NLCS) was a best-of-seven baseball game series pitting the Los Angeles Dodgers against the Philadelphia Phillies for the National League Championship and the right to represent the National League in the 2009 World Series. The Phillies defeated the Dodgers four games to one. Los Angeles, whose NL-best 95–67 record topped Philadelphia's 93–69 record, retained home-field advantage. The series, the 40th in league history, began on October 15 and finished on October 21. TBS carried the championship on television.

<span class="mw-page-title-main">2009 National League Division Series</span>

The 2009 National League Division Series (NLDS) consisted of two concurrent best-of-five game series that determined the participating teams in the 2009 National League Championship Series. Three divisional winners and a "wild card" team played in the two series. The NLDS began on Wednesday, October 7 and ended on Monday, October 12. TBS televised all games in the United States. The matchups were:

<span class="mw-page-title-main">2010 Philadelphia Phillies season</span>

The Philadelphia Phillies' 2010 season was the 128th season in the history of the franchise. As the two-time defending National League champion—having appeared in the 2008 and 2009 World Series—the Phillies won their fourth consecutive National League East championship, and also finished with the best record in baseball. After sweeping the Cincinnati Reds in the NLDS, however, the team lost to the San Francisco Giants in the NLCS.

<span class="mw-page-title-main">2010 National League Division Series</span>

The 2010 National League Division Series (NLDS) were two best-of-five-game series to determine the participating teams in the 2010 National League Championship Series. The three divisional winners and a fourth team—a "Wild Card"—played in two series from October 6 to 11. TBS televised all games in the United States.

<span class="mw-page-title-main">2010 National League Championship Series</span>

The 2010 National League Championship Series (NLCS) was a best-of-seven game Major League Baseball playoff series that pitted the winners of the 2010 National League Division Series—the Philadelphia Phillies and San Francisco Giants—against each other for the National League Championship. The Giants would defeat the Phillies, four games to two, to advance to their first World Series since 2002. The series, the 41st NLCS in league history, began on October 16 and ended on October 23. The Phillies had home field advantage as a result of their better regular-season record. The Phillies hosted Games 1, 2 and 6, while the Giants were at home for Games 3, 4 and 5.

<span class="mw-page-title-main">Roy Halladay's perfect game</span>

On May 29, 2010, Roy Halladay of the Philadelphia Phillies pitched the twentieth perfect game in Major League Baseball history, against the Florida Marlins in Sun Life Stadium. He retired all 27 batters, striking out 11. This was the first time in the modern era that two pitchers threw perfect games in the same month and that multiple perfect games had been achieved in the same season.

<span class="mw-page-title-main">2011 National League Division Series</span> Review of the series

The 2011 National League Division Series were two best-of-five playoffs comprising the opening round of the Major League Baseball postseason, played to determine the participating teams in the 2011 National League Championship Series. Three divisional winners and a fourth team—a wild card—played in two series. TBS televised all games in the United States. The regular season finished on September 28, with the National League playoffs beginning October 1.

The Philadelphia Phillies 2012 season was the 130th season in the history of the franchise. The Phillies attempted to win the division title for the sixth year in a row. However, they finished third place in the National League East with a record of 81–81 and missed the playoffs for the first time since 2006.

The 2012 Cincinnati Reds season was the 123rd season for the franchise in Major League Baseball, and their tenth at Great American Ball Park. The Reds improved on their record of 79–83 in 2011 and became the first team to clinch a playoff berth in 2012 by defeating the Cubs 5–3 on September 20. They clinched the National League Central with a 6–0 victory over the Dodgers on September 22. Their final record was 97–65 and they subsequently lost in five games to the San Francisco Giants in the NLDS.

<span class="mw-page-title-main">2012 National League Division Series</span>

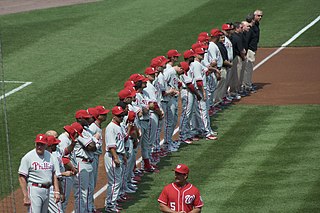
The 2012 National League Division Series were two best-of-five-game series to determine the participating teams in the 2012 National League Championship Series. The three divisional winners and a fourth team—the winner of a one-game Wild Card playoff—played in two separate series.

<span class="mw-page-title-main">2018 Cincinnati Reds season</span>

The 2018 Cincinnati Reds season was the 149th season for the franchise in Major League Baseball, and their 16th at Great American Ball Park in Cincinnati.

<span class="mw-page-title-main">2022 Philadelphia Phillies season</span> Major League Baseball season

The 2022 Philadelphia Phillies season was the 140th season in the history of the franchise, and the 19th season for the Philadelphia Phillies at Citizens Bank Park. The Phillies went 87–75 during the regular season. They went on to win the National League pennant for the first time since 2009.

References

  1. BASEBALL-REFERENCE.com Head-to-Head Records
  2. Zolecki, Todd (October 6, 2010). "Doctober! No-no for Halladay in playoff debut". MLB.com . Archived from the original on October 9, 2010. Retrieved October 6, 2010.
  3. Tanier, Mike (October 8, 2010). "Live Analysis: Reds at Phillies, Game 2". The New York Times. Archived from the original on October 9, 2010. Retrieved October 8, 2010.
  4. "Errors give Phillies late life, bury Reds in 2-0 hole". Associated Press. October 8, 2010. Archived from the original on October 10, 2010. Retrieved October 8, 2010.