Bristol North West | |
---|---|
Borough constituency for the House of Commons | |
County | Bristol |
Population | 100,809 (2011 UK Census) [1] |
Electorate | 72,211 (2018) [2] |
Major settlements | Avonmouth, Sea Mills, Shirehampton |
Current constituency | |
Created | 1950 |
Member of Parliament | Darren Jones (Labour) |
Seats | One |
Created from | Bristol West and Thornbury |
Bristol North West is a constituency [n 1] represented in the House of Commons of the UK Parliament since 2017 by Darren Jones of the Labour Party. [n 2]
The seat covers northwest parts of Bristol, extending to the Severn Estuary. [3] It includes deprived areas such as Lawrence Weston and Southmead, as well as wealthier areas including Westbury-on-Trym and Stoke Bishop. [4]
Bristol North West has traditionally been a Conservative-Labour swing seat. Party positions altered completely in 2010 with the Liberal Democrat candidate, Paul Harrod achieving second place with a slightly larger one party swing, of 11.4%, than winning candidate Charlotte Leslie and saw a fresh Labour Party candidate suffer a large decrease in percentage of the Labour vote of 20.8%. [n 3] This changed in 2015 with the Conservatives winning the seat with an increased majority of 9.5%, and Labour moving back into second place. In the snap 2017 general election, the seat was lost to the Labour Party on a swing of 9%. [5]
The 2017 win was a surprise to the successful Labour candidate Darren Jones. He attributed his win to three factors: Corbyn and a good Labour manifesto, the youth vote, and Europe (the constituency had voted 61% remain). [6] Jones was re-elected as MP for the constituency in 2019 with an increased majority.
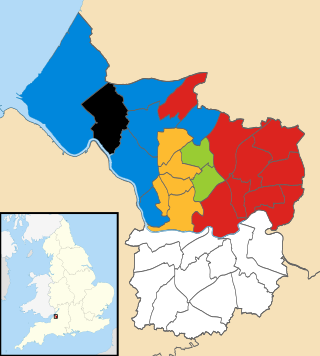
1950–1955: The County Borough of Bristol wards of Avon, Durdham, Horfield, and Westbury-on-Trym.
1955–1983: The County Borough of Bristol wards of Avon, Henbury, Horfield, Southmead, and Westbury-on-Trym.
1983–1997: The City of Bristol wards of Avonmouth, Henbury, Horfield, Kingsweston, Lockleaze, Southmead, and Westbury-on-Trym, and the District of Northavon wards of Filton Charborough, Filton Conygre, Filton Northville, Stoke Gifford North, and Stoke Gifford South.
1997–2010: The City of Bristol wards of Avonmouth, Henbury, Horfield, Kingsweston, Lockleaze, and Southmead, and the South Gloucestershire wards of Filton Charborough, Filton Conygre, Filton Northville, Patchway Callicroft, Patchway Coniston, Patchway Stoke Lodge, Stoke Gifford North, and Stoke Gifford South.
2010–present: The City of Bristol wards of Avonmouth, Henbury, Henleaze, Horfield, Kingsweston, Lockleaze, Southmead, Stoke Bishop, and Westbury-on-Trym.
The constituency boundary extends into the Severn Estuary. [7]
Following the review by the Boundary Commission for England into parliamentary representation in the former county of Avon Somerset and Gloucestershire the constituency had boundary changes at the 2010 general election. [8] In particular, the constituency is now wholly contained within the City of Bristol: the areas of Filton, Patchway, Stoke Gifford, Bradley Stoke and Aztec West which are in the South Gloucestershire district were transferred to a new Filton and Bradley Stoke constituency. At the same time, the areas of Stoke Bishop, Henleaze and Westbury-on-Trym were gained from Bristol West.
Further to the 2023 Periodic Review of Westminster constituencies, enacted by the Parliamentary Constituencies Order 2023, from the 2024 general election, the constituency will be composed of the following (as they existed on 1 December 2020):
The seat will be subject to moderate boundary changes which involves the gain of Bishopston and Ashley Down from Bristol West. [10] These gains will be offset by the loss of Lockleaze which will move into the re-established Bristol North East constituency. [11]
Party | Candidate | Votes | % | ±% | |
---|---|---|---|---|---|
Conservative | Laura Saunders [13] | ||||
Green | Mary Page [14] | ||||
SDP | Ben Smith [15] | ||||
Labour | |||||
Liberal Democrats | |||||
Majority | |||||
Turnout |
Party | Candidate | Votes | % | ±% | |
---|---|---|---|---|---|
Labour | Darren Jones | 27,330 | 48.9 | -1.8 | |
Conservative | Mark Weston | 21,638 | 38.7 | -3.1 | |
Liberal Democrats | Chris Coleman | 4,940 | 8.8 | +3.6 | |
Green | Heather Mack | 1,977 | 3.5 | +1.2 | |
Majority | 5,692 | 10.2 | +1.3 | ||
Turnout | 55,885 | 73.3 | +1.6 | ||
Labour hold | Swing | +0.7 | |||
Party | Candidate | Votes | % | ±% | |
---|---|---|---|---|---|
Labour | Darren Jones | 27,400 | 50.7 | +16.3 | |
Conservative | Charlotte Leslie | 22,639 | 41.8 | -2.1 | |
Liberal Democrats | Celia Downie | 2,814 | 5.2 | -1.0 | |
Green | Sharmila Bousa (withdrawn) | 1,243 | 2.3 | -3.4 | |
Majority | 4,761 | 8.9 | N/A | ||
Turnout | 54,096 | 71.7 | +4.1 | ||
Labour gain from Conservative | Swing | +9.2 | |||
Party | Candidate | Votes | % | ±% | |
---|---|---|---|---|---|
Conservative | Charlotte Leslie | 22,767 | 43.9 | +5.9 | |
Labour | Darren Jones | 17,823 | 34.4 | +8.5 | |
UKIP | Michael Frost | 4,889 | 9.4 | +7.1 | |
Liberal Democrats | Clare Campion-Smith | 3,214 | 6.2 | -25.3 | |
Green | Justin Quinnell | 2,952 | 5.7 | +4.7 | |
TUSC | Anne Lemon | 160 | 0.3 | New | |
Majority | 4,944 | 9.5 | +3.0 | ||
Turnout | 51,805 | 67.6 | -0.9 | ||
Conservative hold | Swing | -1.3 | |||
Party | Candidate | Votes | % | ±% | |
---|---|---|---|---|---|
Conservative | Charlotte Leslie | 19,115 | 38.0 | +5.5 | |
Liberal Democrats | Paul Harrod | 15,841 | 31.5 | +6.6 | |
Labour | Sam Townend | 13,059 | 25.9 | −12.2 | |
UKIP | Robert Upton | 1,175 | 2.3 | +0.7 | |
English Democrat | Ray Carr | 635 | 1.3 | −0.4 | |
Green | Alex Dunn | 511 | 1.0 | New | |
Majority | 3,274 | 6.5 | N/A | ||
Turnout | 50,336 | 68.5 | −0.3 | ||
Conservative gain from Labour | Swing | +15.45 [n 4] | |||
Party | Candidate | Votes | % | ±% | |
---|---|---|---|---|---|
Labour Co-op | Doug Naysmith | 22,192 | 46.7 | −5.4 | |
Conservative | Alastair Watson | 13,230 | 27.9 | −0.8 | |
Liberal Democrats | Bob Hoyle | 9,545 | 20.1 | +4.2 | |
UKIP | Christopher Lees | 1,132 | 2.4 | −0.1 | |
English Democrat | Michael Blundell | 828 | 1.7 | New | |
Socialist Alternative | Graeme Jones | 565 | 1.2 | New | |
Majority | 8,962 | 18.8 | -4.6 | ||
Turnout | 47,492 | 61.1 | +0.7 | ||
Labour Co-op hold | Swing | −2.3 | |||
Party | Candidate | Votes | % | ±% | |
---|---|---|---|---|---|
Labour Co-op | Doug Naysmith | 24,236 | 52.1 | +2.2 | |
Conservative | Charles Hansard | 13,349 | 28.7 | −0.6 | |
Liberal Democrats | Peter Tyzack | 7,387 | 15.9 | +2.7 | |
UKIP | Diane Carr | 1,140 | 2.5 | New | |
Socialist Labour | Vince Horrigan | 371 | 0.8 | -0.1 | |
Majority | 10,887 | 23.4 | +2.8 | ||
Turnout | 46,483 | 60.4 | −13.3 | ||
Labour Co-op hold | Swing | +1.4 | |||
Party | Candidate | Votes | % | ±% | |
---|---|---|---|---|---|
Labour Co-op | Doug Naysmith | 27,575 | 49.9 | +7.6 | |
Conservative | Michael Stern | 16,193 | 29.3 | −13.0 | |
Liberal Democrats | Ian Parry | 7,263 | 13.2 | −1.0 | |
Independent Labour | Charles Horton | 1,718 | 3.1 | New | |
Referendum | John Quintanillia | 1,609 | 2.9 | New | |
Socialist Labour | Giles Shorter | 482 | 0.9 | New | |
BNP | Stephen Parnell | 265 | 0.5 | New | |
Natural Law | Thomas Leighton | 140 | 0.3 | New | |
Majority | 11,382 | 20.6 | N/A | ||
Turnout | 55,245 | 73.7 | -8.6 | ||
Labour Co-op gain from Conservative | Swing | +10.3 | |||
Party | Candidate | Votes | % | ±% | |
---|---|---|---|---|---|
Conservative | Michael Stern | 25,354 | 42.3 | −4.3 | |
Labour Co-op | Doug Naysmith | 25,309 | 42.3 | +7.7 | |
Liberal Democrats | John D. Taylor | 8,498 | 14.2 | −4.6 | |
Independent Ind SD | Hilary S. Long | 729 | 1.2 | New | |
Majority | 45 | 0.1 | −12.0 | ||
Turnout | 59,890 | 82.3 | +2.9 | ||
Conservative hold | Swing | −6.0 | |||
Party | Candidate | Votes | % | ±% | |
---|---|---|---|---|---|
Conservative | Michael Stern | 26,953 | 46.6 | +2.7 | |
Labour | Terence Walker | 20,001 | 34.6 | +2.0 | |
SDP | John Kirkcaldy | 10,885 | 18.8 | -4.8 | |
Majority | 6,952 | 12.0 | +0.7 | ||
Turnout | 57,839 | 79.4 | +2.5 | ||
Conservative hold | Swing | +2.7 [n 5] | |||
Party | Candidate | Votes | % | ±% | |
---|---|---|---|---|---|
Conservative | Michael Stern | 24,617 | 43.9 | ||
Labour Co-op | Sarah R. Palmer | 18,290 | 32.6 | ||
SDP | Hilary S. Long | 13,228 | 23.6 | New | |
Majority | 6,327 | 11.3 | |||
Turnout | 56,135 | 76.9 | |||
Conservative hold | Swing | -8.65 [n 6] | |||
Party | Candidate | Votes | % | ±% | |
---|---|---|---|---|---|
Conservative | Michael Colvin | 25,915 | 48.6 | +7.7 | |
Labour | Ronald Thomas | 21,238 | 39.8 | -2.3 | |
Liberal | G.A. Davis | 5,857 | 11.0 | -6.0 | |
National Front | P.M. Kingston | 264 | 0.5 | New | |
More Prosperous Britain | T.L. Keen | 73 | 0.1 | New | |
Majority | 4,677 | 8.8 | N/A | ||
Turnout | 53,347 | 81.3 | +2.0 | ||
Conservative gain from Labour | Swing | +5.0 | |||
Party | Candidate | Votes | % | ±% | |
---|---|---|---|---|---|
Labour | Ronald Thomas | 22,156 | 42.1 | +3.5 | |
Conservative | Martin McLaren | 21,523 | 40.9 | +1.1 | |
Liberal | E. David | 8,914 | 17.0 | -3.9 | |
Majority | 633 | 1.2 | N/A | ||
Turnout | 52,593 | 79.3 | -3.2 | ||
Labour gain from Conservative | Swing | +1.2 | |||
Party | Candidate | Votes | % | ±% | |
---|---|---|---|---|---|
Conservative | Martin McLaren | 21,569 | 39.8 | -7.8 | |
Labour | Ronald Thomas | 20,919 | 38.6 | -6.9 | |
Liberal | E. David | 11,312 | 20.9 | +14.4 | |
Independent | T.E. Wetherall | 440 | 0.8 | New | |
Majority | 650 | 1.2 | -0.9 | ||
Turnout | 54,240 | 82.5 | +4.5 | ||
Conservative hold | Swing | -0.5 | |||
Party | Candidate | Votes | % | ±% | |
---|---|---|---|---|---|
Conservative | Martin McLaren | 24,124 | 47.6 | -1.1 | |
Labour | John Ellis | 23,075 | 45.5 | -4.6 | |
Liberal | H.J. Stevens | 3,299 | 6.5 | New | |
Communist | W.E. Williams | 227 | 0.5 | -0.7 | |
Majority | 1,049 | 2.1 | N/A | ||
Turnout | 50,725 | 78.0 | -4.0 | ||
Conservative gain from Labour | Swing | +1.75 | |||
Party | Candidate | Votes | % | ±% | |
---|---|---|---|---|---|
Labour | John Ellis | 24,195 | 50.1 | +7.2 | |
Conservative | Martin McLaren | 23,526 | 48.7 | +3.6 | |
Communist | B. Underwood | 595 | 1.2 | New | |
Majority | 669 | 1.4 | N/A | ||
Turnout | 48,316 | 82.0 | -1.1 | ||
Labour gain from Conservative | Swing | +1.8 [n 7] | |||
Party | Candidate | Votes | % | ±% | |
---|---|---|---|---|---|
Conservative | Martin McLaren | 22,129 | 45.1 | -6.9 | |
Labour | David Watkins | 21,030 | 42.9 | -5.1 | |
Liberal | T.G. Douglas | 5,883 | 12.0 | New | |
Majority | 1,099 | 2.2 | -1.8 | ||
Turnout | 49,042 | 83.1 | +0.2 | ||
Conservative hold | Swing | -0.9 | |||
Party | Candidate | Votes | % | ±% | |
---|---|---|---|---|---|
Conservative | Martin McLaren | 24,938 | 52.0 | +3.9 | |
Labour | Christopher Boyd | 23,019 | 48.0 | -3.9 | |
Majority | 1,919 | 4.0 | N/A | ||
Turnout | 47,957 | 82.9 | +3.8 | ||
Conservative gain from Labour | Swing | +3.9 | |||
Party | Candidate | Votes | % | ±% | |
---|---|---|---|---|---|
Labour | Christopher Boyd | 22,950 | 51.9 | +5.5 | |
Conservative | Gurney Braithwaite | 21,295 | 48.1 | -5.5 | |
Majority | 1,655 | 3.8 | N/A | ||
Turnout | 44,245 | 79.1 | -7.0 | ||
Labour gain from Conservative | Swing | +5.5 | |||
Party | Candidate | Votes | % | ±% | |
---|---|---|---|---|---|
Conservative | Gurney Braithwaite | 28,394 | 53.6 | +5.9 | |
Labour | Claud Morris | 24,553 | 46.4 | +3.7 | |
Majority | 3,841 | 7.2 | +2.2 | ||
Turnout | 52,947 | 86.1 | +1.0 | ||
Conservative hold | Swing | +2.2 [n 8] | |||
Party | Candidate | Votes | % | ±% | |
---|---|---|---|---|---|
Conservative | Gurney Braithwaite | 23,884 | 47.7 | ||
Labour | Claud Morris | 21,394 | 42.7 | ||
Liberal | Frances Mary Pugh | 4,784 | 9.6 | ||
Majority | 2,490 | 5.0 | |||
Turnout | 50,062 | 85.1 | |||
Conservative win (new seat) |
Horfield is a suburb of the city of Bristol, in southwest England. It lies on Bristol's northern edge, its border with Filton marking part of the boundary between Bristol and South Gloucestershire. Bishopston lies directly to the south. Monks Park and Golden Hill are to the west. Lockleaze and Ashley Down are on the eastern fringe. The Gloucester Road (A38) runs north–south through the suburb.
Bristol West is a borough constituency represented in the House of Commons of the Parliament of the United Kingdom since 2015 by Thangam Debbonaire of the Labour Party. It mostly covers the central and western parts of Bristol.
Southmead is a northern suburb and council ward of Bristol, in the south west of England, bordered by Filton in South Gloucestershire and Monks Park, Horfield, Henleaze and Westbury on Trym.
Kingswood is a constituency in South Gloucestershire. It is currently represented in the House of Commons of the UK Parliament by Damien Egan of the Labour Party since 2024.
Westbury on Trym is a suburb and council ward in the north of the City of Bristol, near the suburbs of Stoke Bishop, Westbury Park, Henleaze, Southmead and Henbury, in the southwest of England.
The Diocese of Bristol is an ecclesiastical jurisdiction or diocese of the Church of England in the Province of Canterbury, England. It is based in the city of Bristol and covers South Gloucestershire and parts of north Wiltshire, as far east as Swindon. The diocese is headed by the Bishop of Bristol and the Episcopal seat is located at the Cathedral Church of the Holy and Undivided Trinity, commonly known as Bristol Cathedral.
Filton and Bradley Stoke is a constituency represented in the House of Commons of the UK Parliament since 2010 by Jack Lopresti, a Conservative.
Charlton was the name of a small village or large hamlet in Gloucestershire, England with a Bethel Chapel and Sunday School. It was demolished in the late 1940s. Its site is occupied by part of the derelict runway and safety margins of the former Bristol Filton Airport. The village was located between Filton and what is today the Cribbs Causeway out-of-town commercial and retail area immediately north of Bristol. To the north of the village lay fields and Over Court Deer Park, which is today Bristol Golf Club.
The city of Bristol, England, is divided into many areas, which often overlap or have non-fixed borders. These include Parliamentary constituencies, council wards and unofficial neighbourhoods. There are no civil parishes in Bristol.
Westbury Park is a suburb of the city of Bristol, United Kingdom. It lies to the east of Durdham Down between the districts of Redland and Henleaze. The area is very similar in character to nearby Redland and comprises mainly Victorian and early twentieth-century architecture, along with a selection of Georgian buildings. Many of these buildings still have their original house names and many Victorian artifacts have been found in the gardens of Westbury Park.
Barton Regis was, from 1894 to 1904, a rural district in the English administrative county of Gloucestershire, adjacent to the City of Bristol.
The 2009 Bristol City Council elections were held on Thursday 4 June 2009, for 23 seats, that being one-third of the total number of councilors. The Liberal Democrats who had been leading a minority administration, won an overall majority of the council, the first time the party had achieved this on Bristol City Council. The Liberal Democrats were defending 11 seats, the Labour Party 10 and the Conservatives 2.
The 2010 Bristol City Council elections were held on Thursday 6 May 2010, for 23 seats, that being one third of the total number of councillors. The Liberal Democrats, who had won overall control of the council in 2009, increased their majority to six seats.
Elections for one third of Bristol City Council were held on 2 May 2013 as part of the 2013 United Kingdom local elections. No party gained overall control of the chamber, although administrative power rested with the Mayor of Bristol, who had been first elected in November 2012
The 2014 Bristol City Council election took place on 22 May 2014 to elect members of Bristol City Council in England, as part of the United Kingdom 2014 Local Elections.
The 2021 Bristol City Council election took place on 6 May 2021 to elect members of Bristol City Council in England. It coincided with nationwide local elections. Voters in the city also voted for the mayor of Bristol, the mayor of the West of England and for Avon and Somerset's police and crime commissioner. The election was originally due to take place in May 2020, but was postponed due to the COVID-19 pandemic.