| Demographics of Cameroon | |
|---|---|
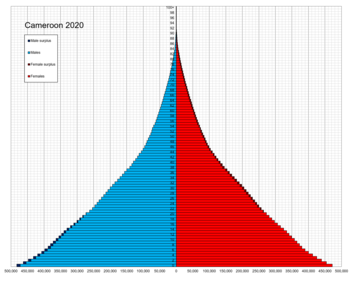 Population pyramid of Cameroon in 2020 | |
| Population | 29,321,637 (2022 est.) |
| Growth rate | 2.75% (2022 est.) |
| Birth rate | 35.53 births/1,000 population (2022 est.) |
| Death rate | 7.73 deaths/1,000 population (2022 est.) |
| Life expectancy | 63.27 years |
| • male | 61.49 years |
| • female | 65.09 years |
| Fertility rate | 4.55 children born/woman (2022 est.) |
| Infant mortality rate | 48.73 deaths/1,000 live births |
| Net migration rate | -0.31 migrant(s)/1,000 population (2022 est.) |
| Age structure | |
| 0–14 years | 42.34% |
| 65 and over | 3.11% |
| Sex ratio | |
| Total | 0.99 male(s)/female (2022 est.) |
| At birth | 1.03 male(s)/female |
| Under 15 | 1.02 male(s)/female |
| 65 and over | 0.74 male(s)/female |
| Nationality | |
| Nationality | Cameroonian |
| Language | |
| Official | English, French |
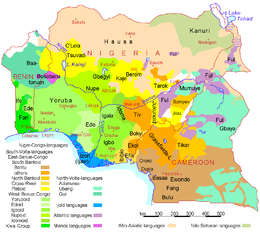
The demographic profile of Cameroon is complex for a country of its population. Cameroon comprises an estimated 250 distinct ethnic groups, which may be formed into five large regional-cultural divisions:
Contents
- Population
- Fertility and births
- Vital statistics
- Ethnic groups
- Languages
- Other demographic statistics
- Population 2
- Religion
- Age structure
- Birth rate
- Death rate
- Total fertility rate
- Net migration rate
- Mother's mean age at first birth
- Median age
- Population growth rate
- Urbanization
- Sex ratio
- Life expectancy at birth
- Contraceptive prevalence rate
- Dependency ratios
- School life expectancy (primary to tertiary education)
- HIV/AIDS
- Major infectious diseases
- Nationality
- Literacy
- Education expenditure
- References
- External links
- western highlanders ( Semi-Bantu or grassfielders), including the Bamileke, Bamum (or Bamoun), and many smaller Tikar groups in the Northwest (est. 38% of total population);
- coastal tropical forest peoples, including the Bassa, Duala (or Douala), and many smaller groups in the Southwest (12%);
- southern tropical forest peoples, including the Beti-Pahuin, Bulu (a subgroup of Beti-Pahuin), Fang (subgroup of Beti-Pahuin), Maka, Njem, and Baka pygmies (18%);
- predominantly Islamic peoples of the northern semi-arid regions (the Sahel) and central highlands, including the Fulani (French : Peul or Peuhl; Fula : Fulɓe) (14%); and
- the "Kirdi", non-Islamic or recently Islamic peoples of the northern desert and central highlands (18%).
113,000 [1] Igbo people live in Cameroon. The Cameroon government held two national censuses during the country's first 44 years as an independent country, in 1976 and again in 1987. Results from the second head count were never published. A third census, expected to take years to produce results, began on November 11, 2005, with a three-week interviewing phase. It is one of a series of projects and reforms required by the International Monetary Fund as prerequisites for foreign debt relief. The first results were published in 2010. [2]