Demographics of Sierra Leone

Last updated
Demographics of Sierra Leone
Sierra Leone single age population pyramid 2020.png
Sierra Leone population pyramid in 2020
Population8,420,641
Density80.06 inhabitants per sq km.
Growth rate15.40% (2004–2014 est.)
Birth rate37.40 births/1,000 inhabitants
Death rate11.03 deaths/1,000 inhabitants
Life expectancy57.39 years
  male54.85 years
  female60.00 years
Fertility rate4.2 children born/women
Infant mortality rate73.29 deaths/1,000 births
Age structure
0–14 years41.9%
15–64 years54.4%
65 and over3.7%
Sex ratio
Total0.94 male(s)/female
At birth1.03 male(s)/female
Under 150.99 male(s)/female
15–64 years0.94 male(s)/female
65 and over0.78 male(s)/female
Nationality
NationalitySierra Leonean(s)
Major ethnicTemne 25.2%, Mende 30.5%
Minor ethnicFula 5.4%, Limba 6.4%, Kono 10.4%, Loko 2.9%, Koranko 2.8%, Sherbro 2.6%, Mandingo 2.4%, Creole 5.2%, Other 5.2%
Language
OfficialEnglish
SpokenKrio, Temne, Mende

The demographics of Sierra Leone are made up of an indigenous population from 18 ethnic groups. The Temne in the north and the Mende in the south are the largest. About 60,000 are Krio, the descendants of freed slaves who returned to Sierra Leone from Great Britain, North America and slave ships captured on the high seas. In addition, about 5,000 Lebanese, 1,000 Indians, and 5,000 Europeans reside in the country.

Contents

In the past, some Sierra Leoneans were noted for their educational achievements, trading activity, entrepreneurial skills, and arts and crafts work, particularly woodcarving. Many are part of larger ethnic networks extending into several countries, which link West African states in the area. Their level of education and infrastructure have declined sharply over the last 30 years. [1]

Population

Historical populations of Sierra Leone
YearPop.±% p.a.
1963 2,180,355    
1974 2,735,159+2.08%
1985 3,515,812+2.31%
2004 4,976,871+1.85%
2014 5,743,725+1.44%
Source: [2]
Sierra Leone's total population, from 1961 to 2013. Sierra-Leone-demography.png
Sierra Leone's total population, from 1961 to 2013.

According to the 2022 revision of the World Population Prospects [3] [4] the total population was 8,420,641 in 2021, compared to only 1 895 000 in 1950. The proportion of children below the age of 15 in 2010 was 43%, 55.1% was between 15 and 65 years of age, while 1.9% was 65 years or older . [5]

Total populationPopulation aged 0–14 (%)Population aged 15–64 (%)Population aged 65+ (%)
19501 895 00039.457.63.0
19552 029 00039.657.52.9
19602 187 00039.657.52.9
19652 373 00039.857.32.9
19702 593 00040.556.92.9
19752 845 00040.556.63.0
19803 162 00041.156.02.9
19853 541 00042.055.32.7
19903 982 00042.455.12.6
19953 898 00042.355.32.4
20004 143 00042.455.52.1
20055 153 00042.955.21.9
20105 868 00043.055.11.9

Population Estimates by Sex and Age Group (01.VII.2020) (Estimates or projections based on the 2015 population census.): [6]

Age GroupMaleFemaleTotal%
Total3 987 2504 113 0688 100 318100
0–4620 177639 7451 259 92215.55
5–9546 368563 6081 109 97613.70
10–14492 216507 749999 96512.34
15–19415 263428 368843 63110.30
20–24373 462385 247758 7099.37
25–29324 639334 883659 5228.14
30–34272 318280 911553 2296.83
35–39226 560233 708460 2685.68
40–44181 985187 730369 7154.56
45–49144 473149 031293 5043.62
50–54110 450113 934224 3842.77
55–5984 14686 801170 9472.11
60–6464 60866 647131 2551.62
65-6947 37048 86596 2351.19
70-7433 56934 63068 1990.84
75-7922 30723 01045 3170.56
80+27 33928 20155 5400.69
Age groupMaleFemaleTotalPercent
0–141 658 7611 711 1023 369 86341.60
15–642 197 9042 267 2604 465 16455.12
65+130 585134 706265 2913.28

Vital statistics

Registration of vital events is in Sierra Leone not complete. The website Our World in Data prepared the following estimates based on statistics from the Population Department of the United Nations. [7]

Mid-year population (thousands)Live births (thousands)Deaths (thousands)Natural change (thousands)Crude birth rate (per 1000)Crude death rate (per 1000)Natural change (per 1000) Total fertility rate (TFR) Infant mortality (per 1000 live births) Life expectancy (in years)
19502 001  97  68  2948.634.114.56.09251.229.6
1951  2 027  98  69  3048.533.814.76.07249.529.8
1952  2 053  99  68  3148.233.315.06.03246.130.3
1953  2 079  100  68  3248.032.715.26.00242.930.9
1954  2 107  102  68  3348.332.415.96.05239.931.3
1955  2 136  104  69  3548.432.116.46.07237.031.8
1956  2 166  105  69  3648.631.816.86.10234.332.2
1957  2 198  107  69  3848.631.617.16.12231.432.6
1958  2 230  109  70  3948.731.317.46.13228.533.0
1959  2 264  110  70  4048.730.917.86.15225.633.5
1960  2 301  113  71  4248.930.618.36.18222.734.0
1961  2 341  115  71  4449.030.318.76.21219.834.4
1962  2 383  117  71  4549.030.019.16.22217.034.9
1963  2 427  119  72  4749.129.619.56.26214.135.3
1964  2 473  121  72  4949.129.219.96.29211.135.9
1965  2 521  123  72  5148.828.720.16.31208.236.4
1966  2 570  125  73  5248.728.320.46.35205.236.9
1967  2 620  127  73  5548.627.820.86.38202.337.4
1968  2 672  129  73  5648.327.420.96.39199.537.8
1969  2 725  131  74  5748.027.021.06.39196.738.2
1970  2 779  133  74  5947.826.521.36.41194.038.8
1971  2 832  135  74  6147.726.021.76.43191.439.3
1972  2 887  137  74  6347.525.622.06.45188.839.8
1973  2 942  140  74  6547.425.222.26.47186.440.2
1974  2 999  143  74  6847.524.822.76.53184.040.7
1975  3 056  145  75  7047.324.423.06.55181.541.2
1976  3 113  147  75  7247.124.023.26.55179.241.6
1977  3 172  149  75  7447.023.623.46.57177.042.1
1978  3 235  152  75  7747.023.223.76.59174.942.5
1979  3 300  155  76  7946.722.923.96.58172.942.9
1980  3 367  157  76  8146.522.623.96.56171.143.1
1981  3 437  160  77  8346.422.424.16.55169.343.4
1982  3 509  163  78  8546.522.224.36.56167.543.6
1983  3 586  167  79  8846.522.024.56.57165.943.8
1984  3 666  171  80  9146.521.924.76.59164.443.9
1985  3 749  174  82  9246.421.824.66.59163.143.9
1986  3 843  178  84  9446.421.824.66.60161.943.8
1987  3 948  183  85  9846.421.624.86.61160.344.0
1988  4 056  187  87  10046.221.524.66.59159.044.0
1989  4 159  191  89  10245.921.424.46.57157.944.0
1990  4 325  195  91  10445.821.324.56.57156.944.1
1991  4 378  206  97  10945.821.724.26.55156.443.5
1992  4 302  201  94  10745.921.524.46.56154.843.6
1993  4 296  200  93  10746.021.524.56.57153.643.6
1994  4 315  200  95  10546.021.924.16.56153.442.9
1995  4 324  200  96  10445.722.023.76.56152.042.7
1996  4 347  200  93  10845.821.224.66.55149.243.7
1997  4 405  202  93  10845.521.124.56.53147.143.7
1998  4 450  204  97  10745.421.623.86.50145.842.8
1999  4 475  204  99  10545.221.923.36.42141.642.1
2000  4 584  204  90  11445.019.825.26.36139.245.1
2001  4 857  212  91  12144.719.225.56.31136.045.7
2002  5 140  226  95  13144.318.725.76.23133.146.4
2003  5 351  231  96  13543.518.125.46.09130.047.0
2004  5 533  233  97  13742.317.524.85.92126.847.6
2005  5 683  237  96  14141.716.924.85.81123.448.2
2006  5 810  241  94  14841.416.125.35.74119.949.3
2007  5 939  242  91  15140.815.325.55.64116.150.4
2008  6 091  246  89  15740.314.525.85.56112.251.5
2009  6 260  248  86  16239.713.825.95.45108.552.6
2010  6 437  250  84  16638.913.125.85.33104.453.7
2011  6 612  253  82  17138.312.525.85.21100.654.6
2012  6 789  255  81  17437.611.925.65.0697.155.5
2013  6 965  254  79  17536.511.425.14.8793.656.3
2014  7 141  254  80  17435.511.224.34.7091.256.4
2015  7 315  253  78  17434.610.723.84.5588.157.2
2016  7 494  255  75  18034.010.024.04.4784.658.4
2017  7 678  258  76  18233.69.923.74.3982.158.7
2018  7 861  260  73  18733.19.323.84.2979.259.8
2019  8 047  262  73  18932.59.123.54.1976.760.3
2020  8 234  263  77  18631.99.322.64.0874.359.8
2021  8 421  264  77  18731.49.122.23.9872.060.1

Fertility and Births

Total Fertility Rate (TFR) (Wanted Fertility Rate) and Crude Birth Rate (CBR): [8]

YearCBR (Total)TFR (Total)CBR (Urban)TFR (Urban)CBR (Rural)TFR (Rural)
200831.55.1 (4.5)27.33.8 (3.4)33.45.8 (5.2)
201335.74.9 (4.2)29.53.5 (3.0)38.25.7 (4.9)
201930.04.2 (3.8)263.1 (2.9)335.1 (4.7)

Other demographic statistics

Demographic statistics according to the World Population Review in 2022. [9]

The following demographic are from the CIA World Factbook [10] unless otherwise indicated.

Population

8,692,606 (2022 est.)
6,312,212 (July 2018 est.)

Religions

Muslim 77.1%, Christian 22.9% (2019 est.)

Age structure

Population pyramid of Sierra Leone in 2020 Sierra Leone single age population pyramid 2020.png
Population pyramid of Sierra Leone in 2020
0-14 years: 41.38% (male 1,369,942/female 1,371,537)
15-24 years: 18.83% (male 610,396/female 636,880)
25-54 years: 32.21% (male 1,020,741/female 1,112,946)
55-64 years: 3.89% (male 121,733/female 135,664)
65 years and over: 3.7% (2020 est.) (male 100,712/female 144,382)
0-14 years: 41.71% (male 1,314,905 /female 1,317,921)
15-24 years: 18.6% (male 572,274 /female 602,105)
25-54 years: 32.23% (male 973,698 /female 1,060,688)
55-64 years: 3.7% (male 110,176 /female 123,268)
65 years and over: 3.76% (male 97,922 /female 139,255) (2018 est.)

Birth rate

32.2 births/1,000 population (2022 est.) Country comparison to the world: 24th
36 births/1,000 population (2018 est.) Country comparison to the world: 18th
38.12 births/1,000 population (2012 est.)

Death rate

9.32 deaths/1,000 population (2022 est.) Country comparison to the world: 50th
10.2 deaths/1,000 population (2018 est.) Country comparison to the world: 33rd
11.41 deaths/1,000 population (2017 est.)

Total fertility rate

3.8 children born/woman (2022 est.) Country comparison to the world: 31st
4.69 children born/woman (2018 est.) Country comparison to the world: 21st
4.9 children born/woman (2012 est.)

Population growth rate

2.49% (2022 est.) Country comparison to the world: 23rd
2.4% (2018 est.) Country comparison to the world: 27th
2.33% growth rate (2014 est.)

Median age

total: 19.1 years. Country comparison to the world: 206th
male: 18.5 years
female: 19.7 years (2020 est.)
total: 19.1 years. Country comparison to the world: 201st
male: 18.4 years
female: 19.7 years (2018 est.)

Mother's mean age at first birth

19.6 years (2019 est.)
note: median age at first birth among women 20-49

Contraceptive prevalence rate

21.2% (2019)
16.6% (2013)

Net migration rate

2.03 migrant(s)/1,000 population (2022 est.) Country comparison to the world: 50th
-1.8 migrant(s)/1,000 population (2018 est.) Country comparison to the world: 160th
-3.86 migrants/1,000 population (2012 est.)

Dependency ratios

total dependency ratio: 82.6 (2015 est.)
youth dependency ratio: 78 (2015 est.)
elderly dependency ratio: 4.6 (2015 est.)
potential support ratio: 21.9 (2015 est.)

Sex ratio

at birth: 1.03 male(s)/female
under 15 years: 0.99 male(s)/female
15–64 years: 0.92 male(s)/female
65 years and over: 0.78 male(s)/female
total population: 0.94 male(s)/female (2011 est.)

Maternal Mortality Ratio

890 deaths/100 000 births (2010)

Sierra Leone's MMR is the worst of any country in the world, according to the 2000 WHO, UNICEF and UNFPA report.

Life expectancy at birth

total population: 58.76 years. Country comparison to the world: 223rd
male: 57.16 years
female: 60.41 years (2022 est.)
total population: 59 years
male: 56.4 years
female: 61.7 years (2018 est.)
total population: 56.55 years
male: 54.08 years
female: 59.11 years (2012 est.)
total population: 45.25 years
male: 42.37 years
female: 48.21 years (2000 est.)

Urbanization

urban population: 43.8% of total population (2022)
rate of urbanization: 3.02% annual rate of change (2020-25 est.)
urban population: 42.1% of total population (2018)
rate of urbanization: 3.12% annual rate of change (2015-20 est.)

Education expenditures

4.6% of GDP (2017)

Health expenditures

11.1% of GDP (2014)

Physicians density

0.02 physicians/1,000 population (2010)

Hospital bed density

0.4 beds/1,000 population (2008)

HIV/AIDS

adult prevalence rate: 1.4% (2017 est.)
people living with HIV/AIDS: 61,000 (2017 est.)
deaths: 2,600 (2017 est.)

Major infectious diseases

degree of risk: very high (2020)
food or waterborne diseases: bacterial and protozoal diarrhea, hepatitis A, and typhoid fever
vectorborne diseases: malaria and dengue fever
water contact diseases: schistosomiasis
animal contact diseases: rabies
aerosolized dust or soil contact diseases: Lassa fever

note: on 21 March 2022, the US Centers for Disease Control and Prevention (CDC) issued a Travel Alert for polio in Africa; Sierra Leone is currently considered a high risk to travelers for circulating vaccine-derived polioviruses (cVDPV); vaccine-derived poliovirus (VDPV) is a strain of the weakened poliovirus that was initially included in oral polio vaccine (OPV) and that has changed over time and behaves more like the wild or naturally occurring virus; this means it can be spread more easily to people who are unvaccinated against polio and who come in contact with the stool or respiratory secretions, such as from a sneeze, of an "infected" person who received oral polio vaccine; the CDC recommends that before any international travel, anyone unvaccinated, incompletely vaccinated, or with an unknown polio vaccination status should complete the routine polio vaccine series; before travel to any high-risk destination, CDC recommends that adults who previously completed the full, routine polio vaccine series receive a single, lifetime booster dose of polio vaccine

Nationality

noun: Sierra Leonean(s)
adjective: Sierra Leonean

Ethnic groups

18 native African tribes 90% (Temne 30.5%, Mende 29.2%, Fula 12.4% Limba 6.4%, Kono 4.4%, Mandingo 2.4, Creole 1.2%, other 13.5%)
Creole (descendants of freed Jamaican slaves who were settled in the Freetown area in the late-18th century)
Refugees from Liberia's recent civil war
Small numbers of Europeans, Lebanese, Pakistanis, and Indians

Languages

English (official, regular use limited to literate minority)
Mende (principal vernacular in the south)
Temne (principal vernacular in the north)
Fula (principal language in Sierra Leone, it is also strongly and widely spoken across West Africa and beyond...)
Krio (English-based Creole, spoken by the descendants of freed American and West Indian slaves and Liberated Africans who were settled in the Freetown area, a lingua franca and a first language for 10% of the population but understood by 95%)

Education expenditure

9.3% of GDP (2020) Country comparison to the world: 7th

Literacy

Definition: Age 15 and over can read and write English, Mende, Temne, or Arabic

total population: 43.2%
male: 51.6%
female: 39.8% (2018)
total population: 48.1%
male: 58.7%
female: 37.7% (2015 est.)
Total population: 35.1%
Male: 46.9%
Female: 24.4% (2004 est.)
Total population: 31.4%
Male: 45.4%
Female: 18.2% (1995 est.)

Unemployment, youth ages 15-24

total: 9.4%
male: 14.8%
female: 6.1% (2014 est.)

Related Research Articles

<span class="mw-page-title-main">Demographics of Burkina Faso</span>

Burkina Faso's 22.1 million people belong to two major West African cultural groups: the Gur (Voltaic) and the Mandé. The Voltaic are far more numerous and include the Mossi, who make up about one-half of the population. The Mossi claim descent from warriors who migrated to present-day Burkina Faso and established an empire that lasted more than 800 years. Predominantly farmers, the Mossi are still bound by the traditions of the Mogho Naba, who hold court in Ouagadougou.

<span class="mw-page-title-main">Demographics of Chad</span>

The people of Chad speak more than 100 different languages and divide themselves into many ethnic groups. However, language and ethnicity are not the same. Moreover, neither element can be tied to a particular physical type.

<span class="mw-page-title-main">Demographics of the Central African Republic</span> Demographics of country

This article is about the demographic features of the population of the Central African Republic, including population density, ethnicity, education level, health of the populace, economic status, religious affiliations and other aspects of the population.

<span class="mw-page-title-main">Demographics of Djibouti</span>

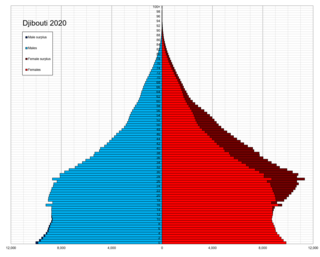
Demographic features of Djibouti include population density, ethnicity, education level, health, economic status, religious affiliations and other aspects.

<span class="mw-page-title-main">Demographics of Ethiopia</span>

The demographics of Ethiopia encompass the demographic features of inhabitants in Ethiopia, including ethnicity, languages, population density, education level, health, economic status, religious affiliations and other aspects of the population.

<span class="mw-page-title-main">Demographics of Guinea</span>

Demographics of Guinea describes the condition and overview of Guinea's peoples. Demographic topics include basic education, health, and population statistics as well as identified racial and religious affiliations.

<span class="mw-page-title-main">Demographics of Guinea-Bissau</span>

This is a demography of the population of Guinea-Bissau including population density, ethnicity, education level, health of the populace, economic status, religious affiliations and other aspects of the population.

<span class="mw-page-title-main">Demographics of Liberia</span>

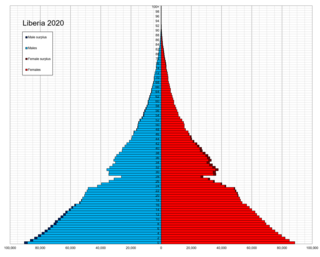
As of 2006, Liberia has the highest population growth rate in the world. 43.5% of Liberians were below the age of 15 in 2010. With recent civil wars being fought along ethnic lines, Liberia is a multiethnic and multicultural country.

<span class="mw-page-title-main">Demographics of Malawi</span> Demographics of the country

This article is about the demographic features of the population of Malawi, including population density, ethnicity, education level, health of the populace, economic status, religious affiliations and other aspects of the population.

<span class="mw-page-title-main">Demographics of Mali</span>

This article is about the demographic features of the population of Mali, including population density, ethnicity, education level, health of the populace, economic status, religious affiliations and other aspects of the population.

<span class="mw-page-title-main">Demographics of Mauritania</span>

Demographic features of the population of Mauritania include population density, ethnicity, education level, health of the populace, economic status, religious affiliations and other aspects.

<span class="mw-page-title-main">Demographics of Mozambique</span>

The demographics of Mozambique describes the condition and overview of Mozambique's peoples. Demographic topics include basic education, health, and population statistics as well as identified racial and religious affiliations.

<span class="mw-page-title-main">Demographics of Niger</span>

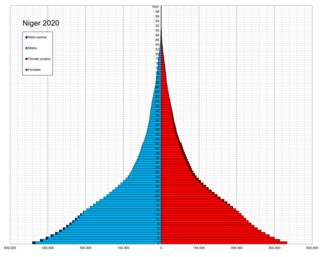
This article is about the demographic features of Nigeriens, the people of Niger, including population density, ethnicity, education level, health of the populace, economic status, religious affiliations and other aspects of the population.

<span class="mw-page-title-main">Demographics of Nigeria</span>

Nigeria is the most populous country in Africa and the sixth in the world. It is also one of the most densely populated countries in Africa, with approximately 218.5 million people in an area of 923,768 km2 (356,669 sq mi).

<span class="mw-page-title-main">Demographics of the Republic of the Congo</span> National demographics

This article is about the demographic features of the population of the Republic of the Congo, including population density, ethnicity, education level, health of the populace, economic status, religious affiliations and other aspects of the population.

<span class="mw-page-title-main">Demographics of Senegal</span>

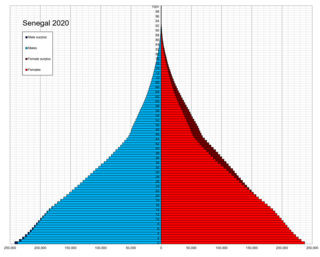
This article is about the demographic features of the population of Senegal, including population density, ethnicity, education level, health of the populace, economic status, religious affiliations and other aspects of the population.

<span class="mw-page-title-main">Demographics of Madagascar</span>

This article is about the demographic features of the population of Madagascar, including population density, ethnicity, education level, health of the populace, economic status, religious affiliations and other aspects of the population.

<span class="mw-page-title-main">Demographics of Uganda</span> Aspect of human geography in Uganda

Demographic features of the population of Uganda include population density, ethnicity, education level, health of the populace, economic status, religious affiliations and others.

<span class="mw-page-title-main">Demographics of the Gambia</span> Demographics of the West African country

The demographic characteristics of the population of The Gambia are known through national censuses, conducted in ten-year intervals and analyzed by The Gambian Bureau of Statistics (GBOS) since 1963. The latest census was conducted in 2013. The population of The Gambia at the 2013 census was 1.8 million. The population density is 176.1 per square kilometer, and the overall life expectancy in The Gambia is 64.1 years. Since the first census of 1963, the population of The Gambia has increased every ten years by an average of 43.2 percent. Since 1950s, the birth rate has constantly exceeded the death rate; the natural growth rate is positive. The Gambia is in the second stage of demographic transition. In terms of age structure, The Gambia is dominated by 15- to 24-year-old segment (57.6%). The median age of the population is 19.9 years, and the gender ratio of the total population is 0.98 males per female.

<span class="mw-page-title-main">Demographics of Somalia</span>

The demographics of Somalis encompass the demographic features of Somalia's inhabitants, including ethnicity, language, population density, education level, health, economic status, religious affiliations and other aspects of the population. Somalia is believed to be one of the most homogeneous countries in sub-Saharan Africa.

References

  1. "Sierra Leone (02/08)". U.S. Department of State. Retrieved 2008-02-17.
  2. "FINAL RESULTS 2004 POPULATION AND HOUSING CENSUS" (PDF). Sierra-leone.org. Retrieved 7 November 2017.
  3. "World Population Prospects 2022". population.un.org. United Nations Department of Economic and Social Affairs, Population Division. Retrieved July 17, 2022.
  4. "World Population Prospects 2022: Demographic indicators by region, subregion and country, annually for 1950-2100" (XSLX). population.un.org ("Total Population, as of 1 July (thousands)"). United Nations Department of Economic and Social Affairs, Population Division. Retrieved July 17, 2022.
  5. Population Division of the Department of Economic and Social Affairs of the United Nations Secretariat, World Population Prospects: The 2010 Revision Archived May 6, 2011, at the Wayback Machine
  6. "UNSD — Demographic and Social Statistics".
  7. "Population & Demography Data Explorer". Our World in Data. Retrieved 2022-07-22.
  8. "Sierra Leone - Demographic and Health Survey 2008". microdata.worldbank.org.
  9. [worldpopulationreview.com/countries/sierra-leone-population/ "Sierra Leone Population 2022"], World Population Review{{citation}}: Check |url= value (help)
  10. "The World FactBook - Sierra Leone", The World Factbook , July 12, 2018PD-icon.svg This article incorporates text from this source, which is in the public domain .