Digital elevation model

Last updated
3D rendering of a DEM of Tithonium Chasma on Mars Mtm-05277e 3d.png
3D rendering of a DEM of Tithonium Chasma on Mars

A digital elevation model (DEM) or digital surface model (DSM) is a 3D computer graphics representation of elevation data to represent terrain or overlaying objects, commonly of a planet, moon, or asteroid. A "global DEM" refers to a discrete global grid. DEMs are used often in geographic information systems (GIS), and are the most common basis for digitally produced relief maps. A digital terrain model (DTM) represents specifically the ground surface while DEM and DSM may represent tree top canopy or building roofs.

Contents

While a DSM may be useful for landscape modeling, city modeling and visualization applications, a DTM is often required for flood or drainage modeling, land-use studies, [1] geological applications, and other applications, [2] and in planetary science.

Terminology

Surfaces represented by a Digital Surface Model include buildings and other objects. Digital Terrain Models represent the bare ground. DTM DSM.svg
Surfaces represented by a Digital Surface Model include buildings and other objects. Digital Terrain Models represent the bare ground.

There is no universal usage of the terms digital elevation model (DEM), digital terrain model (DTM) and digital surface model (DSM) in scientific literature. In most cases the term digital surface model represents the earth's surface and includes all objects on it. In contrast to a DSM, the digital terrain model (DTM) represents the bare ground surface without any objects like plants and buildings (see the figure on the right). [3] [4]

DEM is often used as a generic term for DSMs and DTMs, [5] only representing height information without any further definition about the surface. [6] Other definitions equalise the terms DEM and DTM, [7] equalise the terms DEM and DSM, [8] define the DEM as a subset of the DTM, which also represents other morphological elements, [9] or define a DEM as a rectangular grid and a DTM as a three-dimensional model (TIN). [10] Most of the data providers (USGS, ERSDAC, CGIAR, Spot Image) use the term DEM as a generic term for DSMs and DTMs. Some datasets such as SRTM or the ASTER GDEM are originally DSMs, although in forested areas, SRTM reaches into the tree canopy giving readings somewhere between a DSM and a DTM). DTMs are created from high resolution DSM datasets using complex algorithms to filter out buildings and other objects, a process known as "bare-earth extraction". [11] [12] In the following, the term DEM is used as a generic term for DSMs and DTMs.

Types

Heightmap of Earth's surface (including water and ice), rendered as an equirectangular projection with elevations indicated as normalized 8-bit grayscale, where lighter values indicate higher elevation Srtm ramp2.world.21600x10800.jpg
Heightmap of Earth's surface (including water and ice), rendered as an equirectangular projection with elevations indicated as normalized 8-bit grayscale, where lighter values indicate higher elevation

A DEM can be represented as a raster (a grid of squares, also known as a heightmap when representing elevation) or as a vector-based triangular irregular network (TIN). [13] The TIN DEM dataset is also referred to as a primary (measured) DEM, whereas the Raster DEM is referred to as a secondary (computed) DEM. [14] The DEM could be acquired through techniques such as photogrammetry, lidar, IfSAR or InSAR, land surveying, etc. (Li et al. 2005).

DEMs are commonly built using data collected using remote sensing techniques, but they may also be built from land surveying.

Rendering

Relief map of Spain's Sierra Nevada, showing use of both shading and false color as visualization tools to indicate elevation Maps-for-free Sierra Nevada.png
Relief map of Spain's Sierra Nevada, showing use of both shading and false color as visualization tools to indicate elevation

The digital elevation model itself consists of a matrix of numbers, but the data from a DEM is often rendered in visual form to make it understandable to humans. This visualization may be in the form of a contoured topographic map, or could use shading and false color assignment (or "pseudo-color") to render elevations as colors (for example, using green for the lowest elevations, shading to red, with white for the highest elevation.).

Visualizations are sometimes also done as oblique views, reconstructing a synthetic visual image of the terrain as it would appear looking down at an angle. In these oblique visualizations, elevations are sometimes scaled using "vertical exaggeration" in order to make subtle elevation differences more noticeable. [15] Some scientists, [16] [17] however, object to vertical exaggeration as misleading the viewer about the true landscape.

Production

Mappers may prepare digital elevation models in a number of ways, but they frequently use remote sensing rather than direct survey data.

Older methods of generating DEMs often involve interpolating digital contour maps that may have been produced by direct survey of the land surface. This method is still used in mountain areas, where interferometry is not always satisfactory. Note that contour line data or any other sampled elevation datasets (by GPS or ground survey) are not DEMs, but may be considered digital terrain models. A DEM implies that elevation is available continuously at each location in the study area.

Satellite mapping

One powerful technique for generating digital elevation models is interferometric synthetic aperture radar where two passes of a radar satellite (such as RADARSAT-1 or TerraSAR-X or Cosmo SkyMed), or a single pass if the satellite is equipped with two antennas (like the SRTM instrumentation), collect sufficient data to generate a digital elevation map tens of kilometers on a side with a resolution of around ten meters. [18] Other kinds of stereoscopic pairs can be employed using the digital image correlation method, where two optical images are acquired with different angles taken from the same pass of an airplane or an Earth Observation Satellite (such as the HRS instrument of SPOT5 or the VNIR band of ASTER). [19]

The SPOT 1 satellite (1986) provided the first usable elevation data for a sizeable portion of the planet's landmass, using two-pass stereoscopic correlation. Later, further data were provided by the European Remote-Sensing Satellite (ERS, 1991) using the same method, the Shuttle Radar Topography Mission (SRTM, 2000) using single-pass SAR and the Advanced Spaceborne Thermal Emission and Reflection Radiometer (ASTER, 2000) instrumentation on the Terra satellite using double-pass stereo pairs. [19]

The HRS instrument on SPOT 5 has acquired over 100 million square kilometers of stereo pairs.

Planetary mapping

MOLA digital elevation model showing the two hemispheres of Mars. This image appeared on the cover of Science magazine in May 1999. PIA02040 Martian hemispheres by MOLA.jpg
MOLA digital elevation model showing the two hemispheres of Mars. This image appeared on the cover of Science magazine in May 1999.

A tool of increasing value in planetary science has been use of orbital altimetry used to make digital elevation map of planets. A primary tool for this is laser altimetry but radar altimetry is also used. [20] Planetary digital elevation maps made using laser altimetry include the Mars Orbiter Laser Altimeter (MOLA) mapping of Mars, [21] the Lunar Orbital Laser Altimeter (LOLA) [22] and Lunar Altimeter (LALT) mapping of the Moon, and the Mercury Laser Altimeter (MLA) mapping of Mercury. [23] In planetary mapping, each planetary body has a unique reference surface. [24]

Methods for obtaining elevation data used to create DEMs

Gatewing X100 unmanned aerial vehicle GatewingX100.jpg
Gatewing X100 unmanned aerial vehicle

Accuracy

The quality of a DEM is a measure of how accurate elevation is at each pixel (absolute accuracy) and how accurately is the morphology presented (relative accuracy). Quality assessment of DEM can be performed by comparison of DEMs from different sources. [27] Several factors play an important role for quality of DEM-derived products:

Uses

Digital Elevation Model - Red Rocks Amphitheater, Colorado obtained using a UAV Digital Elevation Model - Red Rocks Amphitheater, Colorado.jpg
Digital Elevation Model - Red Rocks Amphitheater, Colorado obtained using a UAV
Bezmiechowa airfield 3D Digital Surface Model obtained using Pteryx UAV flying 200 m above hilltop Bezmiechowa DSM 3D 2010-05-29 Pteryx UAV.jpg
Bezmiechowa airfield 3D Digital Surface Model obtained using Pteryx UAV flying 200 m above hilltop
Digital Surface Model of motorway interchange construction site. Note that tunnels are closed. DSM construction site.jpg
Digital Surface Model of motorway interchange construction site. Note that tunnels are closed.
Example DEM flown with the Gatewing X100 in Assenede DEM Assenede1.PNG
Example DEM flown with the Gatewing X100 in Assenede
Digital Terrain Model Generator + Textures(Maps) + Vectors Geabios3d.jpg
Digital Terrain Model Generator + Textures(Maps) + Vectors

Common uses of DEMs include:

Sources

Global

Released at the beginning of 2022, FABDEM offers a bare earth simulation of the Earth's surface at 30 arc-second resolution. Adapted from GLO-30, the data removes all forests and buildings. The data is free to download non-commercially and through the developer's website at a cost commercially.

An alternative free global DEM is called GTOPO30 (30 arcsecond resolution, c. 1  km along the equator) is available, but its quality is variable and in some areas it is very poor. A much higher quality DEM from the Advanced Spaceborne Thermal Emission and Reflection Radiometer (ASTER) instrument of the Terra satellite is also freely available for 99% of the globe, and represents elevation at 30 meter resolution. A similarly high resolution was previously only available for the United States territory under the Shuttle Radar Topography Mission (SRTM) data, while most of the rest of the planet was only covered in a 3 arc-second resolution (around 90 meters along the equator). SRTM does not cover the polar regions and has mountain and desert no data (void) areas. SRTM data, being derived from radar, represents the elevation of the first-reflected surfacequite often tree tops. So, the data are not necessarily representative of the ground surface, but the top of whatever is first encountered by the radar.

Submarine elevation (known as bathymetry) data is generated using ship-mounted depth soundings. When land topography and bathymetry is combined, a truly global relief model is obtained. The SRTM30Plus dataset (used in NASA World Wind) attempts to combine GTOPO30, SRTM and bathymetric data to produce a truly global elevation model. [30] The Earth2014 global topography and relief model [31] provides layered topography grids at 1 arc-minute resolution. Other than SRTM30plus, Earth2014 provides information on ice-sheet heights and bedrock (that is, topography below the ice) over Antarctica and Greenland. Another global model is Global Multi-resolution Terrain Elevation Data 2010 (GMTED2010) with 7.5 arc second resolution. It is based on SRTM data and combines other data outside SRTM coverage. A novel global DEM of postings lower than 12 m and a height accuracy of less than 2 m is expected from the TanDEM-X satellite mission which started in July 2010.

The most common grid (raster) spacing is between 50 and 500 meters. In gravimetry e.g., the primary grid may be 50 m, but is switched to 100 or 500 meters in distances of about 5 or 10 kilometers.

Since 2002, the HRS instrument on SPOT 5 has acquired over 100 million square kilometers of stereo pairs used to produce a DTED2 format DEM (with a 30-meter posting) DEM format DTED2 over 50 million km2. [32] The radar satellite RADARSAT-2 has been used by MacDonald, Dettwiler and Associates Ltd. to provide DEMs for commercial and military customers. [33]

In 2014, acquisitions from radar satellites TerraSAR-X and TanDEM-X will be available in the form of a uniform global coverage with a resolution of 12 meters. [34]

ALOS provides since 2016 a global 1-arc second DSM free of charge, [35] and a commercial 5 meter DSM/DTM. [36]

Local

Many national mapping agencies produce their own DEMs, often of a higher resolution and quality, but frequently these have to be purchased, and the cost is usually prohibitive to all except public authorities and large corporations. DEMs are often a product of national lidar dataset programs.

Free DEMs are also available for Mars: the MEGDR, or Mission Experiment Gridded Data Record, from the Mars Global Surveyor's Mars Orbiter Laser Altimeter (MOLA) instrument; and NASA's Mars Digital Terrain Model (DTM). [37]

Websites

OpenTopography [38] is a web based community resource for access to high-resolution, Earth science-oriented, topography data (lidar and DEM data), and processing tools running on commodity and high performance compute system along with educational resources. [39] OpenTopography is based at the San Diego Supercomputer Center [40] at the University of California San Diego and is operated in collaboration with colleagues in the School of Earth and Space Exploration at Arizona State University and UNAVCO. [41] Core operational support for OpenTopography comes from the National Science Foundation, Division of Earth Sciences.

The OpenDemSearcher is a Mapclient with a visualization of regions with free available middle and high resolution DEMs. [42]

STL 3D model of the Moon with 10x elevation exaggeration rendered with data from the Lunar Orbiter Laser Altimeter of the Lunar Reconnaissance Orbiter Moon elevation.stl
STL 3D model of the Moon with 10× elevation exaggeration rendered with data from the Lunar Orbiter Laser Altimeter of the Lunar Reconnaissance Orbiter

See also

DEM file formats

Related Research Articles

<span class="mw-page-title-main">Lidar</span> Method of spatial measurement using laser

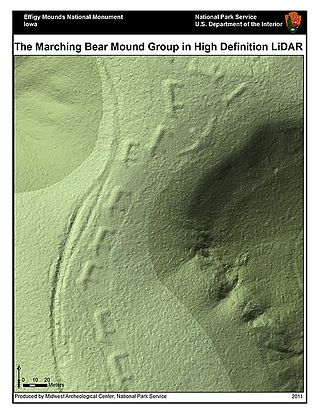
Lidar is a method for determining ranges by targeting an object or a surface with a laser and measuring the time for the reflected light to return to the receiver. Lidar may operate in a fixed direction or it may scan multiple directions, in which case it is known as lidar scanning or 3D laser scanning, a special combination of 3-D scanning and laser scanning. Lidar has terrestrial, airborne, and mobile applications.

<span class="mw-page-title-main">Topography</span> Study of the forms of land surfaces

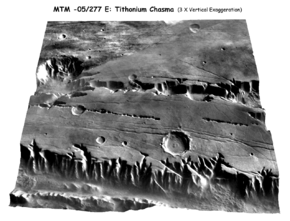
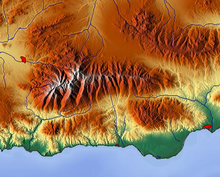
Topography is the study of the forms and features of land surfaces. The topography of an area may refer to the land forms and features themselves, or a description or depiction in maps.

<span class="mw-page-title-main">Advanced Spaceborne Thermal Emission and Reflection Radiometer</span> Japanese imaging device aboard NASAs Terra satellite

The Advanced Spaceborne Thermal Emission and Reflection Radiometer (ASTER) is a Japanese remote sensing instrument onboard the Terra satellite launched by NASA in 1999. It has been collecting data since February 2000.

<span class="mw-page-title-main">Terrain</span> Vertical and horizontal dimension and shape of land surface

Terrain or relief involves the vertical and horizontal dimensions of land surface. The term bathymetry is used to describe underwater relief, while hypsometry studies terrain relative to sea level. The Latin word terra means "earth."

<span class="mw-page-title-main">Bathymetry</span> Study of underwater depth of lake or ocean floors

Bathymetry is the study of underwater depth of ocean floors, lake floors, or river floors. In other words, bathymetry is the underwater equivalent to hypsometry or topography. The first recorded evidence of water depth measurements are from Ancient Egypt over 3000 years ago. Bathymetric charts, are typically produced to support safety of surface or sub-surface navigation, and usually show seafloor relief or terrain as contour lines and selected depths (soundings), and typically also provide surface navigational information. Bathymetric maps may also use a Digital Terrain Model and artificial illumination techniques to illustrate the depths being portrayed. The global bathymetry is sometimes combined with topography data to yield a global relief model. Paleobathymetry is the study of past underwater depths.

<span class="mw-page-title-main">NASA WorldWind</span> Open-source virtual globe

NASA WorldWind is an open-source virtual globe. According to the website, "WorldWind is an open source virtual globe API. WorldWind allows developers to quickly and easily create interactive visualizations of 3D globe, map and geographical information. Organizations around the world use WorldWind to monitor weather patterns, visualize cities and terrain, track vehicle movement, analyze geospatial data and educate humanity about the Earth." It was first developed by NASA in 2003 for use on personal computers and then further developed in concert with the open source community since 2004. As of 2017, a web-based version of WorldWind is available online. An Android version is also available.

<span class="mw-page-title-main">Satellite geodesy</span> Measurement of the Earth using satellites

Satellite geodesy is geodesy by means of artificial satellites—the measurement of the form and dimensions of Earth, the location of objects on its surface and the figure of the Earth's gravity field by means of artificial satellite techniques. It belongs to the broader field of space geodesy. Traditional astronomical geodesy is not commonly considered a part of satellite geodesy, although there is considerable overlap between the techniques.

<span class="mw-page-title-main">Space-based radar</span> Use of radar systems mounted on satellites

Space-based radar or spaceborne radar is a radar operating in outer space; orbiting radar is a radar in orbit and Earth orbiting radar is a radar in geocentric orbit. A number of Earth-observing satellites, such as RADARSAT, have employed synthetic aperture radar (SAR) to obtain terrain and land-cover information about the Earth.

<span class="mw-page-title-main">TOPEX/Poseidon</span> Satellite mission to map ocean surface topography

TOPEX/Poseidon was a joint satellite altimeter mission between NASA, the U.S. space agency; and CNES, the French space agency, to map ocean surface topography. Launched on August 10, 1992, it was the first major oceanographic research satellite. TOPEX/Poseidon helped revolutionize oceanography by providing data previously impossible to obtain. Oceanographer Walter Munk described TOPEX/Poseidon as "the most successful ocean experiment of all time." A malfunction ended normal satellite operations in January 2006.

<span class="mw-page-title-main">Elevation</span> Height of a geographic location above a fixed reference point

The elevation of a geographic location is its height above or below a fixed reference point, most commonly a reference geoid, a mathematical model of the Earth's sea level as an equipotential gravitational surface . The term elevation is mainly used when referring to points on the Earth's surface, while altitude or geopotential height is used for points above the surface, such as an aircraft in flight or a spacecraft in orbit, and depth is used for points below the surface.

<span class="mw-page-title-main">Shuttle Radar Topography Mission</span> Project to create a digital topographic database of Earth

The Shuttle Radar Topography Mission (SRTM) is an international research effort that obtained digital elevation models on a near-global scale from 56°S to 60°N, to generate the most complete high-resolution digital topographic database of Earth prior to the release of the ASTER GDEM in 2009. SRTM consisted of a specially modified radar system that flew on board the Space Shuttle Endeavour during the 11-day STS-99 mission in February 2000. The radar system was based on the older Spaceborne Imaging Radar-C/X-band Synthetic Aperture Radar (SIR-C/X-SAR), previously used on the Shuttle in 1994. To acquire topographic data, the SRTM payload was outfitted with two radar antennas. One antenna was located in the Shuttle's payload bay, the other – a critical change from the SIR-C/X-SAR, allowing single-pass interferometry – on the end of a 60-meter (200-foot) mast that extended from the payload bay once the Shuttle was in space. The technique employed is known as interferometric synthetic aperture radar. Intermap Technologies was the prime contractor for processing the interferometric synthetic aperture radar data.

<span class="mw-page-title-main">Triangulated irregular network</span> Representation of a surface as a triangle mesh with elevated vertices

In computer graphics, a triangulated irregular network (TIN) is a representation of a continuous surface consisting entirely of triangular facets, used mainly as Discrete Global Grid in primary elevation modeling.

Geomorphometry, or geomorphometrics, is the science and practice of measuring the characteristics of terrain, the shape of the surface of the Earth, and the effects of this surface form on human and natural geography. It gathers various mathematical, statistical and image processing techniques that can be used to quantify morphological, hydrological, ecological and other aspects of a land surface. Common synonyms for geomorphometry are geomorphological analysis, terrain morphometry, terrain analysis, and land surface analysis. Geomorphometrics is the discipline based on the computational measures of the geometry, topography and shape of the Earth's horizons, and their temporal change. This is a major component of geographic information systems (GIS) and other software tools for spatial analysis.

<span class="mw-page-title-main">TerraSAR-X</span>

TerraSAR-X, is an imaging radar Earth observation satellite, a joint venture being carried out under a public-private-partnership between the German Aerospace Center (DLR) and EADS Astrium. The exclusive commercial exploitation rights are held by the geo-information service provider Astrium. TerraSAR-X was launched on 15 June 2007 and has been in operational service since January 2008. With its twin satellite TanDEM-X, launched 21 June 2010, TerraSAR-X acquires the data basis for the WorldDEM, the worldwide and homogeneous DEM available from 2014.

<span class="mw-page-title-main">Surface Water and Ocean Topography</span> NASA satellite of the Explorer program

The Surface Water and Ocean Topography (SWOT) mission is a satellite altimeter jointly developed and operated by NASA and CNES, the French space agency, in partnership with the Canadian Space Agency (CSA) and UK Space Agency (UKSA). The objectives of the mission are to make the first global survey of the Earth's surface water, to observe the fine details of the ocean surface topography, and to measure how terrestrial surface water bodies change over time.

Intermap Technologies is a publicly traded company headquartered in Douglas County, Colorado, United States. Intermap provides geospatial solutions that allow GIS professionals in commercial and government organizations worldwide to build a broad range of applications. Industries such as energy, engineering, government, risk management, telecommunications, water resource management, and automotive use Intermap’s NEXTMap 3D terrain products and geospatial services.

NPA Satellite Mapping is the longest-established satellite mapping specialist in Europe, with expertise in geoscience applications of earth observation and remote sensing. In addition to processing and distributing data from a variety of optical and radar satellites, NPA specialises in added-value and derived products, providing validation and interpretation of satellite-based imagery.

<span class="mw-page-title-main">Operation IceBridge</span> Arctic research project by NASA

Operation IceBridge (OIB) was a NASA mission to monitor changes in polar ice. It is an airborne follow-on mission to the ICESat satellite, until after the ICESat-2 mission was launched in September 2018. OIB ended in 2019.

<span class="mw-page-title-main">Global relief model</span> Model of Earths relief including elevation and depth underwater

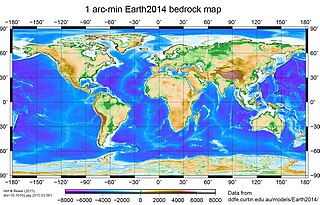
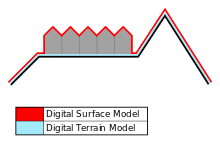
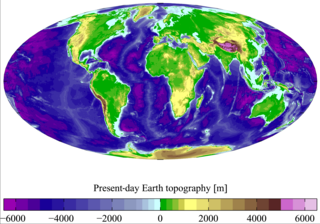
A global relief model, sometimes also denoted as global topography model or composite model, combines digital elevation model (DEM) data over land with digital bathymetry model (DBM) data over water-covered areas to describe Earth's relief. A relief model thus shows how Earth's surface would look like in the absence of water or ice masses.

Geological structure measurement by LiDAR technology is a remote sensing method applied in structural geology. It enables monitoring and characterisation of rock bodies. This method's typical use is to acquire high resolution structural and deformational data for identifying geological hazards risk, such as assessing rockfall risks or studying pre-earthquake deformation signs.

References

  1. I. Balenovic, H. Marjanovic, D. Vuletic, etc. Quality assessment of high density digital surface model over different land cover classes. PERIODICUM BIOLOGORUM. VOL. 117, No 4, 459–470, 2015.
  2. "Appendix A – Glossary and Acronyms" (PDF). Severn Tidal Tributaries Catchment Flood Management Plan – Scoping Stage. UK: Environment Agency. Archived from the original (PDF) on 2007-07-10.
  3. "Intermap Digital Surface Model: accurate, seamless, wide-area surface models". Archived from the original on 2011-09-28.
  4. Li, Z., Zhu, Q. and Gold, C. (2005), Digital terrain modeling: principles and methodology, CRC Press, Boca Raton, FL.
  5. Hirt, C. (2014). "Digital Terrain Models". Encyclopedia of Geodesy. pp. 1–6. doi:10.1007/978-3-319-02370-0_31-1. ISBN   978-3-319-01868-3 . Retrieved February 10, 2016.
  6. Peckham, Robert Joseph; Jordan, Gyozo (Eds.)(2007): Development and Applications in a Policy Support Environment Series: Lecture Notes in Geoinformation and Cartography. Heidelberg.
  7. Podobnikar, Tomaz (2008). "Methods for visual quality assessment of a digital terrain model". S.A.P.I.EN.S. 1 (2).
  8. Adrian W. Graham, Nicholas C. Kirkman, Peter M. Paul (2007): Mobile radio network design in the VHF and UHF bands: a practical approach. West Sussex.
  9. "DIN Standard 18709-1". Archived from the original on 2011-01-11.
  10. "Landslide Glossary USGS". Archived from the original on 2011-05-16.
  11. Li, Z., Zhu, Q. and Gold, C. (2005), Digital terrain modeling: principles and methodology, CRC Press, Boca Raton, FL.
  12. "Understanding Digital Surface Models, Digital Terrain Models and Digital Elevation Models: A Comprehensive Guide to Digital Models of the Earth's Surface". FlyGuys. Retrieved 7 September 2023.
  13. DeMers, Michael (2002). GIS Modeling in Raster. Wiley. ISBN   978-0-471-31965-8.
  14. RONALD TOPPE (1987): Terrain models — A tool for natural hazard Mapping Archived 2020-07-29 at the Wayback Machine . In: Avalanche Formation, Movement and Effects (Proceedings of the Davos Symposium, September 1986). IAHS Publ. no. 162,1987
  15. Making 3D Terrain Maps, Shaded Relief. Retrieved 11 March 2019.
  16. David Morrison, ""Flat-Venus Society" organizes", EOS, Volume 73, Issue 9, American Geophysical Union, 3 March 1992, p. 99. https://doi.org/10.1029/91EO00076. Retrieved 11 March 2019.
  17. Robert Simmon. "Elegant Figures What Not To Do: Vertical Exaggeration," NASA Earth Observatory, November 5, 2010. Retrieved 11 March 2019.
  18. "WorldDEM(TM): Airbus Defence and Space". www.intelligence-airbusds.com. Archived from the original on 2018-06-04. Retrieved 2018-01-05.
  19. 1 2 Nikolakopoulos, K. G.; Kamaratakis, E. K; Chrysoulakis, N. (10 November 2006). "SRTM vs ASTER elevation products. Comparison for two regions in Crete, Greece" (PDF). International Journal of Remote Sensing. 27 (21): 4819–4838. Bibcode:2006IJRS...27.4819N. doi:10.1080/01431160600835853. ISSN   0143-1161. S2CID   1939968. Archived from the original (PDF) on July 21, 2011. Retrieved June 22, 2010.
  20. Hargitai, Henrik; Willner, Konrad; Buchroithner, Manfred (2019), Hargitai, Henrik (ed.), "Methods in Planetary Topographic Mapping: A Review", Planetary Cartography and GIS, Lecture Notes in Geoinformation and Cartography, Springer International Publishing, pp. 147–174, doi:10.1007/978-3-319-62849-3_6, ISBN   978-3-319-62848-6, S2CID   133855780
  21. Bruce Banerdt, Orbital Laser Altimeter, The Martian Chronicle, Volume 1, No. 3, NASA. Retrieved 11 March 2019.
  22. NASA, LOLA. Retrieved 11 March 2019.
  23. John F. Cavanaugh, et al., "The Mercury Laser Altimeter Instrument for the MESSENGER Mission", Space Sci Rev, DOI 10.1007/s11214-007-9273-4, 24 August 2007. Retrieved 11 March 2019.
  24. Hargitai, Henrik; Willner, Konrad; Hare, Trent (2019), Hargitai, Henrik (ed.), "Fundamental Frameworks in Planetary Mapping: A Review", Planetary Cartography and GIS, Lecture Notes in Geoinformation and Cartography, Springer International Publishing, pp. 75–101, doi:10.1007/978-3-319-62849-3_4, ISBN   978-3-319-62848-6, S2CID   133867607
  25. 1 2 Campbell, D. M. H.; White, B.; Arp, P. A. (2013-11-01). "Modeling and mapping soil resistance to penetration and rutting using LiDAR-derived digital elevation data". Journal of Soil and Water Conservation. 68 (6): 460–473. doi: 10.2489/jswc.68.6.460 . ISSN   0022-4561.
  26. James, M. R.; Robson, S. (2012). "Straightforward reconstruction of 3D surfaces and topography with a camera: Accuracy and geoscience application" (PDF). Journal of Geophysical Research: Earth Surface. 117 (F3): n/a. Bibcode:2012JGRF..117.3017J. doi: 10.1029/2011JF002289 .
  27. Szypuła, Bartłomiej (1 January 2019). "Quality assessment of DEM derived from topographic maps for geomorphometric purposes". Open Geosciences. 11 (1): 843–865. Bibcode:2019OGeo...11...66S. doi:10.1515/geo-2019-0066. hdl: 20.500.12128/11742 . ISSN   2391-5447. S2CID   208868204.
  28. Adams, Aaron (2019). A Comparative Usability Assessment of Augmented Reality 3-D Printed Terrain Models and 2-D Topographic Maps. NMSU. Retrieved 11 March 2022 via ProQuest.{{cite book}}: CS1 maint: location missing publisher (link)
  29. "I. Balenović, A. Seletković, R. Pernar, A. Jazbec. Estimation of the mean tree height of forest stands by photogrammetric measurement using digital aerial images of high spatial resolution. ANNALS OF FOREST RESEARCH. 58(1), P. 125-143, 2015".
  30. "Martin Gamache's paper on free sources of global data" (PDF).
  31. Hirt, C.; Rexer, M. (2015). "Earth2014: 1 arc-min shape, topography, bedrock and ice-sheet models - available as gridded data and degree-10,800 spherical harmonics" (PDF). International Journal of Applied Earth Observation and Geoinformation. 39: 103–112. Bibcode:2015IJAEO..39..103H. doi:10.1016/j.jag.2015.03.001. hdl: 20.500.11937/25468 . Retrieved February 20, 2016.
  32. "GEO Elevation Services : Airbus Defence and Space". www.astrium-geo.com. Archived from the original on 2014-06-26. Retrieved 2012-01-11.
  33. "International - Geospatial". gs.mdacorporation.com. Archived from the original on 2016-03-04. Retrieved 2012-02-02.
  34. "TerraSAR-X : Airbus Defence and Space". www.astrium-geo.com. Archived from the original on 2014-08-12. Retrieved 2012-01-11.
  35. "ALOS World 3D - 30m". www.eorc.jaxa.jp. Archived from the original on 2020-05-04. Retrieved 2017-09-09.
  36. "ALOS World 3D". www.aw3d.jp.
  37. "A basic guide for using Digital Elevation Models with Terragen". Archived from the original on 2007-05-19.
  38. "OpenTopography". www.opentopography.org.
  39. "About OpenTopography".
  40. "San Diego Supercomputer Center". www.sdsc.edu. Retrieved 2018-08-16.
  41. "Home | UNAVCO". www.unavco.org. Retrieved 2018-08-16.
  42. OpenDemSearcher

Further reading

Data products