Topographic map

Last updated

A topographic map of Stowe, Vermont with contour lines Topographic map example.png
A topographic map of Stowe, Vermont with contour lines
Part of the same map in a perspective shaded relief view illustrating how the contour lines follow the terrain Topographic-Relief-perspective-sample.jpg
Part of the same map in a perspective shaded relief view illustrating how the contour lines follow the terrain
Sheet #535 (2013 version; second digital edition) of MTN50 Spanish National Topographic map series, covering Algete town (near Madrid) and its surroundings. MTN50-0535-2013-cns Algete.jpg
Sheet #535 (2013 version; second digital edition) of MTN50 Spanish National Topographic map series, covering Algete town (near Madrid) and its surroundings.
Section of topographical map of Nablus area (West Bank) with contour lines at 100-meter intervals. Heights are colour-coded. IsraelCVFRtopography.jpg
Section of topographical map of Nablus area (West Bank) with contour lines at 100-meter intervals. Heights are colour-coded.

In modern mapping, a topographic map or topographic sheet is a type of map characterized by large-scale detail and quantitative representation of relief features, usually using contour lines (connecting points of equal elevation), but historically using a variety of methods. Traditional definitions require a topographic map to show both natural and artificial features. [1] A topographic survey is typically based upon a systematic observation and published as a map series, made up of two or more map sheets that combine to form the whole map. A topographic map series uses a common specification that includes the range of cartographic symbols employed, as well as a standard geodetic framework that defines the map projection, coordinate system, ellipsoid and geodetic datum. Official topographic maps also adopt a national grid referencing system.

Contents

Natural Resources Canada provides this description of topographic maps: [2]

These maps depict in detail ground relief (landforms and terrain), drainage (lakes and rivers), forest cover, administrative areas, populated areas, transportation routes and facilities (including roads and railways), and other man-made features.

Other authors define topographic maps by contrasting them with another type of map; they are distinguished from smaller-scale "chorographic maps" that cover large regions, [3] [4] "planimetric maps" that do not show elevations, [5] and "thematic maps" that focus on specific topics. [6]

However, in the vernacular and day to day world, the representation of relief (contours) is popularly held to define the genre, such that even small-scale maps showing relief are commonly (and erroneously, in the technical sense) called "topographic". [4]

The study or discipline of topography is a much broader field of study, which takes into account all natural and human-made features of terrain. Maps were among the first artifacts to record observations about topography. [7]

History

Topographic maps are based on topographical surveys. Performed at large scales, these surveys are called topographical in the old sense of topography, showing a variety of elevations and landforms. [8] This is in contrast to older cadastral surveys, which primarily show property and governmental boundaries. The first multi-sheet topographic map series of an entire country, the Carte géométrique de la France, was completed in 1789. [9] The Great Trigonometric Survey of India, started by the East India Company in 1802, then taken over by the British Raj after 1857 was notable as a successful effort on a larger scale and for accurately determining heights of Himalayan peaks from viewpoints over one hundred miles distant. [10]

Global indexing system first developed for International Map of the World Soviet topographic map codes.svg
Global indexing system first developed for International Map of the World

Topographic surveys were prepared by the military to assist in planning for battle and for defensive emplacements (thus the name and history of the United Kingdom's Ordnance Survey). As such, elevation information was of vital importance. [11]

As they evolved, topographic map series became a national resource in modern nations in planning infrastructure and resource exploitation. In the United States, the national map-making function which had been shared by both the Army Corps of Engineers and the Department of the Interior migrated to the newly created United States Geological Survey in 1879, where it has remained since. [12] [13]

1913 saw the beginning of the International Map of the World initiative, which set out to map all of Earth's significant land areas at a scale of 1:1 million, on about one thousand sheets, each covering four degrees latitude by six or more degrees longitude. Excluding borders, each sheet was 44 cm high and (depending on latitude) up to 66 cm wide. Although the project eventually foundered, it left an indexing system that remains in use.

By the 1980s, centralized printing of standardized topographic maps began to be superseded by databases of coordinates that could be used on computers by moderately skilled end users to view or print maps with arbitrary contents, coverage and scale. For example, the federal government of the United States' TIGER initiative compiled interlinked databases of federal, state and local political borders and census enumeration areas, and of roadways, railroads, and water features with support for locating street addresses within street segments. TIGER was developed in the 1980s and used in the 1990 and subsequent decennial censuses. Digital elevation models (DEM) were also compiled, initially from topographic maps and stereographic interpretation of aerial photographs and then from satellite photography and radar data. Since all these were government projects funded with taxes and not classified for national security reasons, the datasets were in the public domain and freely usable without fees or licensing.

TIGER and DEM datasets greatly facilitated geographic information systems and made the Global Positioning System much more useful by providing context around locations given by the technology as coordinates. Initial applications were mostly professionalized forms such as innovative surveying instruments and agency-level GIS systems tended by experts. By the mid-1990s, increasingly user-friendly resources such as online mapping in two and three dimensions, integration of GPS with mobile phones and automotive navigation systems appeared. As of 2011, the future of standardized, centrally printed topographical maps is left somewhat in doubt. [14] [15]

Uses

Curvimeter used to measure a distance on a topographic map Kurvimeter 1 fcm.jpg
Curvimeter used to measure a distance on a topographic map

Topographic maps have many multiple uses in the present day: any type of geographic planning or large-scale architecture; Earth sciences and many other geographic disciplines; mining and other Earth-based endeavours; civil engineering and recreational uses such as hiking and orienteering.

It takes practice and skill to read and interpret a topographic map. This includes not only how to identify map features, but also how to interpret contour lines to infer landforms like cliffs, ridges, draws, etc. Training in map reading is often given in orienteering, scouting, and the military. [16]

Conventions

The various features shown on the map are represented by conventional signs or symbols. For example, colors can be used to indicate a classification of roads. These signs are usually explained in the margin of the map, or on a separately published characteristic sheet. [17]

Topographic maps are also commonly called contour maps or topo maps. In the United States, where the primary national series is organized by a strict 7.5-minute grid, they are often called or quads or quadrangles.

Topographic maps conventionally show topography, or land contours, by means of contour lines. Contour lines are curves that connect contiguous points of the same altitude (isohypse). In other words, every point on the marked line of 100 m elevation is 100 m above mean sea level.

These maps usually show not only the contours, but also any significant streams or other bodies of water, forest cover, built-up areas or individual buildings (depending on scale), and other features and points of interest such as what direction those streams are flowing.

Most topographic maps were prepared using photogrammetric interpretation of aerial photography using a stereoplotter. Modern mapping also employs lidar and other Remote sensing techniques. Older topographic maps were prepared using traditional surveying instruments.

The cartographic style (content and appearance) of topographic maps is highly variable between national mapping organizations. Aesthetic traditions and conventions persist in topographic map symbology, particularly amongst European countries at medium map scales. [18]

Publishers of national topographic map series

Although virtually the entire terrestrial surface of Earth has been mapped at scale 1:1,000,000, medium and large-scale mapping has been accomplished intensively in some countries and much less in others. [19] Several commercial vendors supply international topographic map series.

According to 2007/2/EC European directive, national mapping agencies of European Union countries must have publicly available services for searching, viewing and downloading their official map series. [20] Topographic maps produced by some of them are available under a free license that allows re-use, such as a Creative Commons license. [21]

See also

Related Research Articles

<span class="mw-page-title-main">Map</span> Symbolic depiction of relationships

A map is a symbolic depiction emphasizing relationships between elements of some space, such as objects, regions, or themes.

<span class="mw-page-title-main">Digital elevation model</span> 3D computer-generated imagery and measurements of terrain

A digital elevation model (DEM) or digital surface model (DSM) is a 3D computer graphics representation of elevation data to represent terrain or overlaying objects, commonly of a planet, moon, or asteroid. A "global DEM" refers to a discrete global grid. DEMs are used often in geographic information systems (GIS), and are the most common basis for digitally produced relief maps. A digital terrain model (DTM) represents specifically the ground surface while DEM and DSM may represent tree top canopy or building roofs.

<span class="mw-page-title-main">Topography</span> Study of the forms of land surfaces

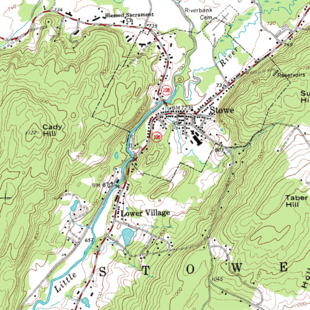
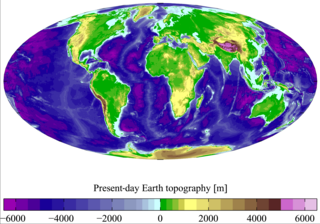
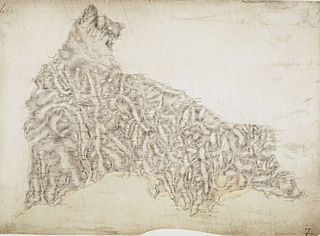
Topography is the study of the forms and features of land surfaces. The topography of an area may refer to the land forms and features themselves, or a description or depiction in maps.

<span class="mw-page-title-main">Landform</span> Feature of the solid surface of a planetary body

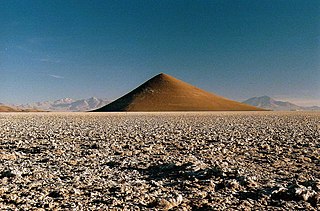
A landform is a natural or anthropogenic land feature on the solid surface of the Earth or other planetary body. Landforms together make up a given terrain, and their arrangement in the landscape is known as topography. Landforms include hills, mountains, canyons, and valleys, as well as shoreline features such as bays, peninsulas, and seas, including submerged features such as mid-ocean ridges, volcanoes, and the great ocean basins.

<span class="mw-page-title-main">Terrain</span> Vertical and horizontal dimension and shape of land surface

Terrain or relief involves the vertical and horizontal dimensions of land surface. The term bathymetry is used to describe underwater relief, while hypsometry studies terrain relative to sea level. The Latin word terra means "earth."

<span class="mw-page-title-main">Orthophoto</span> Geometrically corrected aerial photograph

An orthophoto, orthophotograph, orthoimage or orthoimagery is an aerial photograph or satellite imagery geometrically corrected ("orthorectified") such that the scale is uniform: the photo or image follows a given map projection. Unlike an uncorrected aerial photograph, an orthophoto can be used to measure true distances, because it is an accurate representation of the Earth's surface, having been adjusted for topographic relief, lens distortion, and camera tilt.

<span class="mw-page-title-main">Geologic map</span> Special-purpose map to show geological features

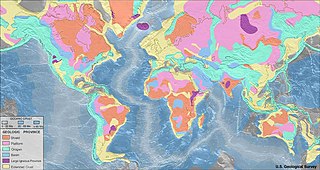
A geologic map or geological map is a special-purpose map made to show various geological features. Rock units or geologic strata are shown by color or symbols. Bedding planes and structural features such as faults, folds, are shown with strike and dip or trend and plunge symbols which give three-dimensional orientations features.

<span class="mw-page-title-main">Bathymetry</span> Study of underwater depth of lake or ocean floors

Bathymetry is the study of underwater depth of ocean floors, lake floors, or river floors. In other words, bathymetry is the underwater equivalent to hypsometry or topography. The first recorded evidence of water depth measurements are from Ancient Egypt over 3000 years ago. Bathymetric charts, are typically produced to support safety of surface or sub-surface navigation, and usually show seafloor relief or terrain as contour lines and selected depths (soundings), and typically also provide surface navigational information. Bathymetric maps may also use a Digital Terrain Model and artificial illumination techniques to illustrate the depths being portrayed. The global bathymetry is sometimes combined with topography data to yield a global relief model. Paleobathymetry is the study of past underwater depths.

Planimetrics is the study of plane measurements, including angles, distances, and areas.

<span class="mw-page-title-main">Elevation</span> Height of a geographic location above a fixed reference point

The elevation of a geographic location is its height above or below a fixed reference point, most commonly a reference geoid, a mathematical model of the Earth's sea level as an equipotential gravitational surface . The term elevation is mainly used when referring to points on the Earth's surface, while altitude or geopotential height is used for points above the surface, such as an aircraft in flight or a spacecraft in orbit, and depth is used for points below the surface.

<span class="mw-page-title-main">Terrain cartography</span> Representation of surface shape on maps

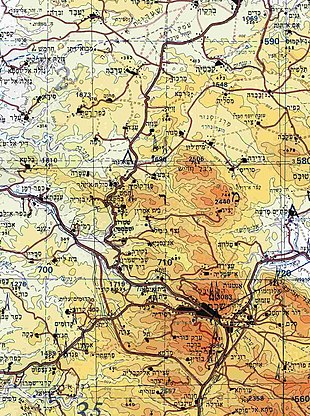
Terrain cartography or relief mapping is the depiction of the shape of the surface of the Earth on a map, using one or more of several techniques that have been developed. Terrain or relief is an essential aspect of physical geography, and as such its portrayal presents a central problem in cartographic design, and more recently geographic information systems and geovisualization.

<span class="mw-page-title-main">Quadrangle (geography)</span> Large area in geology or geography

A "quadrangle" is a topographic map produced by the United States Geological Survey (USGS) covering the United States. The maps are usually named after local physiographic features. The shorthand "quad" is also used, especially with the name of the map; for example, "the Ranger Creek, Texas quad". A quadrangle is defined by north and south boundaries of constant latitude, and by east and west boundaries of constant longitude.

<span class="mw-page-title-main">Stereoplotter</span>

A stereoplotter uses stereo photographs to determine elevations. It has been the primary method to plot contour lines on topographic maps since the 1930s. Although the specific devices have advanced technologically, they are all based on the apparent change in position of a feature in the two stereo photographs.

<span class="mw-page-title-main">Orienteering map</span>

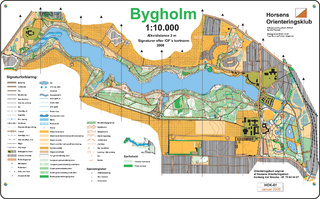
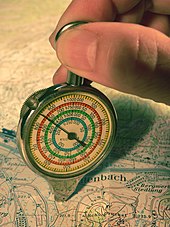
An orienteering map is a map specially prepared for use in orienteering events. It is a large-scale topographic map with extra markings to help the participant navigate through the course.

Planetary cartography, or cartography of extraterrestrial objects (CEO), is the cartography of solid objects outside of the Earth. Planetary maps can show any spatially mapped characteristic for extraterrestrial surfaces. Some well-known examples of these maps have been produced by the USGS, such as the latest Geologic Map of Mars, but many others are published in specialized scientific journals.

<span class="mw-page-title-main">National mapping agency</span> Organisation that produces maps and geographic information of a country

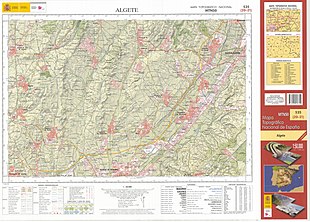
A national mapping agency (NMA) is an organisation, usually publicly owned, that produces topographic maps and geographic information of a country. Some national mapping agencies also deal with cadastral matters.

<span class="mw-page-title-main">Ethiopia – United States Mapping Mission</span>

The Ethiopia-United States Mapping Mission, also known as the Ethi-U.S. Mapping Mission, was an operation undertaken by the United States Army during the 1960s to provide up-to-date topographic map coverage of the entire country of Ethiopia. The soldiers who conducted the mapping operations on the ground during that time used the latest surveying and mapping techniques and were exposed to many hardships and dangers, but they completed their mission near the end of the decade. The maps that were created still serve as the base maps for the country of Ethiopia and are presently being updated and maintained by the Ethiopian Mapping Authority.

<span class="mw-page-title-main">United States Geological Survey</span> Scientific agency of the United States government

The United States Geological Survey (USGS), founded as the Geological Survey, is an agency of the United States government whose work spans the disciplines of biology, geography, geology, and hydrology. The agency was founded on March 3, 1879, to study the landscape of the United States, its natural resources, and the natural hazards that threaten it. The agency also makes maps of extraterrestrial planets and moons based on data from U.S. space probes.

<span class="mw-page-title-main">James W. Bagley</span>

Major James Warren Bagley was an American aerial photographer, topographic engineer and inventor.

DAT/EM Systems International is an Alaska-based company that develops digital photogrammetric mapping applications to extract and edit 3D vector terrain and object features from stereo imagery and point clouds. DAT/EM Systems International develops solutions for the photogrammetry, engineering & GIS industries.

References

  1. Kent, Alexander (1 July 2009). "Topographic Maps: Methodological Approaches for Analyzing Cartographic Style". Journal of Map & Geography Libraries. 5 (2): 131–156. doi:10.1080/15420350903001187. S2CID   128466975 . Retrieved 13 June 2020.
  2. Government of Canada (8 April 2016). "National Topographic System Maps". Earth Sciences – Geography. Natural Resources Canada. Archived from the original on 15 May 2016. Retrieved 16 May 2016. yes
  3. P. D. A. Harvey, The History of Topographical Maps: Symbols, Pictures and Surveys, Thames and Hudson, 1980, ISBN   0-500-24105-8, p. 9. "By a topographical map, we mean a large-scale map, one that sets out to convey the shape and pattern of landscape, showing a tiny portion of the earth's surface as it lies within one's own direct experience, and quite distinct from the small-scale maps that show us the features of whole provinces, nations and continents."
  4. 1 2 Art & Architecture Thesaurus entry for topographic maps Archived 7 June 2011 at the Wayback Machine .
  5. Committee on Nomenclature of the American Society of Photogrammetry, "Definitions of terms used in photogrammetric surveying and mapping: preliminary report", Photogrammetric Engineering, 8, 247–283, 1942. "Topographic Map. A map that presents the horizontal and vertical positions of the features represented; distinguished from a planimetric map by the addition of relief in measurable form." This definition is used in many glossaries of map terminology.
  6. M.-J. Kraak and F. Ormeling, Cartography: Visualization of Spatial Data, Longman, 1996, ISBN   0-582-25953-3, p. 44. "Traditionally, the main division of maps is into topographic and thematic maps. Topographic maps supply a general image of the earth's surface: roads, rivers, buildings, often the nature of the vegetation, the relief and the names of the various mapped objects."
  7. Kent, A.J.; Hopfstock, A. (November 2018). "Topographic Mapping: Past, Present and Future". The Cartographic Journal. 55 (4): 305–308. doi: 10.1080/00087041.2018.1576973 .
  8. The range of information is indicated by the title of a map produced in 1766: A Topographical Map of Hartfordshire from an Actual Survey in which is Express'd all the Roads, Lanes, Churches, Noblemen and Gentlemen's Seats, and every Thing remarkable in the County, by Andrew Dury and John Andrews, reprinted by Hertfordshire Publications in 1980. This showed the relief by using hachures.
  9. Library of Congress, Geography and Maps: General Collections Archived 16 September 2017 at the Wayback Machine
  10. Dickey, Parke A (October 1985). "Who discovered Mount Everest?". Eos. 66 (41): 54–59. Bibcode:1985EOSTr..66..697D. doi:10.1029/EO066i041p00697 . Retrieved 26 June 2011.
  11. Peter Barber, The Map Book, Weidenfeld & Nicolson, 2005, ISBN   0-297-84372-9, pp. 232, 250.
  12. "Organizing the U.S. Geological Survey". The United States Geological Survey: 1879–1989. U.S. Geological Survey, U.S. Department of the Interior. 10 April 2000. Archived from the original on 2 July 2007. Retrieved 19 June 2007.
  13. "The Four Great Surveys of the West". The United States Geological Survey: 1879–1989. U.S. Geological Survey, U.S. Department of the Interior. 10 April 2000. Archived from the original on 10 June 2007. Retrieved 19 June 2007.
  14. Ramirez, J. Raul. "Maps for the Future: A Discussion" (PDF). Archived from the original (PDF) on 22 November 2011. Retrieved 1 July 2011.
  15. Hurst, Paul (2010), Will we be lost without paper maps in the digital age? (PDF) (M.S. thesis), U.K.: University of Sheffield, pp. 1–18, archived from the original (PDF) on 2 October 2011, retrieved 1 July 2011
  16. US Department of the Army (2015). Map Reading and Land Navigation (PDF). Field Manual No. 3-25.26. Washington, DC.{{cite book}}: CS1 maint: location missing publisher (link)
  17. Ordnance Survey, Explorer Map Symbols Archived 1 November 2012 at the Wayback Machine ; Swisstopo, Conventional Signs Archived 26 July 2011 at the Wayback Machine ; United States Geological Survey, Topographic Map Symbols Archived 10 September 2008 at the Wayback Machine .
  18. Kent, Alexander J.; Vujakovic, Peter (August 2009). "Stylistic Diversity in European State 1 : 50 000 Topographic Maps". The Cartographic Journal. 46 (3): 179–213. doi:10.1179/000870409x12488753453453. ISSN   0008-7041. S2CID   129681695.
  19. Pickles, John. Cartography, Digital Transitions, and Questions of History (PDF). International Cartographic Association, 1999. Ottawa. p. 17. Archived from the original (PDF) on 23 November 2011. Retrieved 29 June 2011.
  20. "L_2007108EN.01000101.xml". 19 January 2022. Archived from the original on 19 January 2022. Retrieved 3 August 2022.
  21. "Spanish IGN products license (in Spanish)" (PDF). Archived from the original (PDF) on 6 May 2022. Retrieved 3 August 2022.