Dvorak technique

Last updated

Common developmental patterns seen during tropical cyclone development, and their Dvorak-assigned intensities DvorakCDP1973.png
Common developmental patterns seen during tropical cyclone development, and their Dvorak-assigned intensities

The Dvorak technique (developed between 1969 and 1984 by Vernon Dvorak) is a widely used system to estimate tropical cyclone intensity (which includes tropical depression, tropical storm, and hurricane/typhoon/intense tropical cyclone intensities) based solely on visible and infrared satellite images. Within the Dvorak satellite strength estimate for tropical cyclones, there are several visual patterns that a cyclone may take on which define the upper and lower bounds on its intensity. The primary patterns used are curved band pattern (T1.0-T4.5), shear pattern (T1.5–T3.5), central dense overcast (CDO) pattern (T2.5–T5.0), central cold cover (CCC) pattern, banding eye pattern (T4.0–T4.5), and eye pattern (T4.5–T8.0).

Contents

Both the central dense overcast and embedded eye pattern use the size of the CDO. The CDO pattern intensities start at T2.5, equivalent to minimal tropical storm intensity (40 mph, 65 km/h). The shape of the central dense overcast is also considered. The eye pattern utilizes the coldness of the cloud tops within the surrounding mass of thunderstorms and contrasts it with the temperature within the eye itself. The larger the temperature difference is, the stronger the tropical cyclone. Once a pattern is identified, the storm features (such as length and curvature of banding features) are further analyzed to arrive at a particular T-number. The CCC pattern indicates little development is occurring, despite the cold cloud tops associated with the quickly evolving feature.

Several agencies issue Dvorak intensity numbers for tropical cyclones and their precursors, including the National Hurricane Center's Tropical Analysis and Forecast Branch (TAFB), the NOAA/NESDIS Satellite Analysis Branch (SAB), and the Joint Typhoon Warning Center at the Naval Meteorology and Oceanography Command in Pearl Harbor, Hawaii.

Evolution of the method

The Dvorak technique does not correctly diagnose cyclone intensity for storms like Subtropical Storm Andrea since it only applies to tropical cyclones Subtropical Storm Andrea 2007.jpg
The Dvorak technique does not correctly diagnose cyclone intensity for storms like Subtropical Storm Andrea since it only applies to tropical cyclones

The initial development of this technique occurred in 1969 by Vernon Dvorak, using satellite pictures of tropical cyclones within the northwest Pacific Ocean. The system as it was initially conceived involved pattern matching of cloud features with a development and decay model. As the technique matured through the 1970s and 1980s, measurement of cloud features became dominant in defining tropical cyclone intensity and central pressure of the tropical cyclone's low-pressure area. Use of infrared satellite imagery led to a more objective assessment of the strength of tropical cyclones with eyes, using the cloud top temperatures within the eyewall and contrasting them with the warm temperatures within the eye itself. Constraints on short term intensity change are used less frequently than they were back in the 1970s and 1980s. The central pressures assigned to tropical cyclones have required modification, as the original estimates were 5–10 hPa (0.15–0.29 inHg) too low in the Atlantic and up to 20 hPa (0.59 inHg) too high in the northwest Pacific. This led to the development of a separate wind-pressure relationship for the northwest Pacific, devised by Atkinson and Holliday in 1975, then modified in 1977. [1]

As human analysts using the technique lead to subjective biases, efforts have been made to make more objective estimates using computer programs, which have been aided by higher-resolution satellite imagery and more powerful computers. Since tropical cyclone satellite patterns can fluctuate over time, automated techniques use a six-hour averaging period to lead to more reliable intensity estimates. Development of the objective Dvorak technique began in 1998, which performed best with tropical cyclones that had eyes (of hurricane or typhoon strength). It still required a manual center placement, keeping some subjectivity within the process. By 2004, an advanced objective Dvorak technique was developed which utilized banding features for systems below hurricane intensity and to objectively determine the tropical cyclone's center. A central pressure bias was uncovered in 2004 relating to the slope of the tropopause and cloud top temperatures which change with latitude that helped improve central pressure estimates within the objective technique. [1]

Details of the method

Dvorak T-Number and Corresponding Intensity [2]
T-Number 1-min Winds Category (SSHWS)Min. Pressure (millibars)
(knots)(mph)(km/h)AtlanticNW Pacific
1.0 – 1.5252945below TD--------
2.0303555TD10091000
2.5354065TS1005998
3.0455283TS1000991
3.55563102TS-Cat 1 994984
4.06575120 Cat 1 987976
4.57789143 Cat 1Cat 2 979966
5.090104167 Cat 2Cat 3 970954
5.5102117189 Cat 3 960941
6.0115132213 Cat 4 948927
6.5127146235 Cat 4 935915
7.0140161260 Cat 5 921898
7.5155178287 Cat 5 906879
8.0170196315 Cat 5 890858
8.5185213343 Cat 5 873841
Note: The pressures shown for the NW Pacific basin are lower as the pressure of the entire basin are relatively lower than that of the Atlantic basin. [3]
Values of 8.1–8.5 are only assigned by the CIMSS and NOAA automated advanced Dvorak systems and not used in subjective analyses. [4]
Dvorak enhancement imagery of Typhoon Haiyan at T8.0 Haiyan 2013-11-07 1430Z IR-BD lineless.png
Dvorak enhancement imagery of Typhoon Haiyan at T8.0

In a developing cyclone, the technique takes advantage of the fact that cyclones of similar intensity tend to have certain characteristic features, and as they strengthen, they tend to change in appearance in a predictable manner. The structure and organization of the tropical cyclone are tracked over 24 hours to determine if the storm has weakened, maintained its intensity, or strengthened. Various central cloud and banding features are compared with templates that show typical storm patterns and their associated intensity. [5] If infrared satellite imagery is available for a cyclone with a visible eye pattern, then the technique utilizes the difference between the temperature of the warm eye and the surrounding cold cloud tops to determine intensity (colder cloud tops generally indicate a more intense storm). In each case a "T-number" (an abbreviation for Tropical Number) and a Current Intensity (CI) value are assigned to the storm. These measurements range between 1 (minimum intensity) and 8 (maximum intensity). [3] The T-number and CI value are the same except for weakening storms, in which case the CI is higher. [6] [7] For weakening systems, the CI is held as the tropical cyclone intensity for 12 hours, though research from the National Hurricane Center indicates that six hours is more reasonable. [8] The table at right shows the approximate surface wind speed and sea level pressure that corresponds to a given T-number. [9] The amount a tropical cyclone can change in strength per 24-hour period is limited to 2.5 T-numbers per day. [1]

Pattern types

Within the Dvorak satellite strength estimate for tropical cyclones, there are several visual patterns that a cyclone may take on which define the upper and lower bounds on its intensity. The primary patterns used are curved band pattern (T1.0-T4.5), shear pattern (T1.5-T3.5), central dense overcast (CDO) pattern (T2.5-T5.0), banding eye pattern (T4.0-T4.5), eye pattern (T4.5 – T8.0), and central cold cover (CCC) pattern. [10] Both the central dense overcast and embedded eye pattern utilize the size of the CDO. The CDO pattern intensities start at T2.5, equivalent to minimal tropical storm intensity (40 miles per hour (64 km/h)). The shape of the central dense overcast is also considered. The farther the center is tucked into the CDO, the stronger it is deemed. [11] Tropical cyclones with maximum sustained winds between 65 miles per hour (105 km/h) and 100 miles per hour (160 km/h) can have their center of circulations obscured by cloudiness of the central dense overcast within visible and infrared satellite imagery, which makes diagnosis of their intensity a challenge. [12]

The CCC pattern, with its large and quickly developing mass of thick cirrus clouds spreading out from an area of convection near a tropical cyclone center within a short time frame, indicates little development. When it develops, rainbands and cloud lines around the tropical cyclone weaken and the thick cloud shield obscures the circulation center. While it resembles a CDO pattern, it is rarely seen. [10]

The eye pattern utilizes the coldness of the cloud tops within the surrounding mass of thunderstorms and contrasts it with the temperature within the eye itself. The larger the temperature difference is, the stronger the tropical cyclone. [11] Winds within tropical cyclones can also be estimated by tracking features within the CDO using rapid scan geostationary satellite imagery, whose pictures are taken minutes apart rather than every half-hour. [13]

Once a pattern is identified, the storm features (such as length and curvature of banding features) are further analyzed to arrive at a particular T-number. [14]

Usage

Several agencies issue Dvorak intensity numbers for tropical cyclones and their precursors. These include the National Hurricane Center's Tropical Analysis and Forecast Branch (TAFB), the National Oceanic and Atmospheric Administration's Satellite Analysis Branch (SAB), and the Joint Typhoon Warning Center at the Naval Pacific Meteorology and Oceanography Center in Pearl Harbor, Hawaii. [9]

The National Hurricane Center will often quote Dvorak T-numbers in their tropical cyclone products. The following example is from discussion number 3 of Tropical Depression 24 (eventually Hurricane Wilma) of the 2005 Atlantic hurricane season: [15]

BOTH TAFB AND SAB CAME IN WITH A DVORAK SATELLITE INTENSITY ESTIMATE OF T2.5/35 KT. HOWEVER ...OFTENTIMES THE SURFACE WIND FIELD OF LARGE DEVELOPING LOW PRESSURE SYSTEMS LIKE THIS ONE WILL LAG ABOUT 12 HOURS BEHIND THE SATELLITE SIGNATURE. THEREFORE... THE INITIAL INTENSITY HAS ONLY BEEN INCREASED TO 30 KT.

Note that in this case the Dvorak T-number (in this case T2.5) was simply used as a guide but other factors determined how the NHC decided to set the system's intensity.

The Cooperative Institute for Meteorological Satellite Studies (CIMSS) at the University of Wisconsin–Madison has developed the Objective Dvorak Technique (ODT). This is a modified version of the Dvorak technique which uses computer algorithms rather than subjective human interpretation to arrive at a CI number. This is generally not implemented for tropical depressions or weak tropical storms. [9] The China Meteorological Agency (CMA) is expected to start using the standard 1984 version of Dvorak in the near future. The Indian Meteorological Department (IMD) prefers using visible satellite imagery over infrared imagery due to a perceived high bias in estimates derived from infrared imagery during the early morning hours of convective maximum. The Japan Meteorological Agency (JMA) uses the infrared version of Dvorak over the visible imagery version. Hong Kong Observatory and JMA continue to utilize Dvorak after tropical cyclone landfall. Various centers hold on to the maximum current intensity for 6–12 hours, though this rule is broken when rapid weakening is obvious. [8]

Citizen science site Cyclone Center uses a modified version of the Dvorak technique to categorize post-1970 tropical weather. [16]

Benefits and disadvantages

The most significant benefit of the use of the technique is that it has provided a more complete history of tropical cyclone intensity in areas where aircraft reconnaissance is neither possible nor routinely available. Intensity estimates of maximum sustained wind are currently within 5 miles per hour (8.0 km/h) of what aircraft are able to measure half of the time, though the assignment of intensity of systems with strengths between moderate tropical-storm force (60 miles per hour (97 km/h)) and weak hurricane- or typhoon-force (100 miles per hour (160 km/h)) is the least certain. Its overall precision has not always been true, as refinements in the technique led to intensity changes between 1972 and 1977 of up to 20 miles per hour (32 km/h). The method is internally consistent in that it constrains rapid increases or decreases in tropical cyclone intensity. Some tropical cyclones fluctuate in strength more than the 2.5 T numbers per day limit allowed by the rule, which can work to the technique's disadvantage and has led to occasional abandonment of the constraints since the 1980s. Systems with small eyes near the limb, or edge, of a satellite image can be biased too weakly using the technique, which can be resolved through use of polar-orbiting satellite imagery. Subtropical cyclone intensity cannot be determined using Dvorak, which led to the development of the Hebert-Poteat technique in 1975. Cyclones undergoing extratropical transition, losing their thunderstorm activity, see their intensities underestimated using the Dvorak technique. This led to the development of the Miller and Lander extratropical transition technique which can be used under these circumstances. [1]

See also

Other tools used to determine tropical cyclone intensity:

Related Research Articles

<span class="mw-page-title-main">Rainband</span> Cloud and precipitation structure

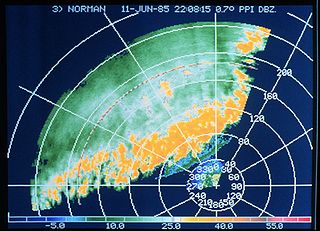
A rainband is a cloud and precipitation structure associated with an area of rainfall which is significantly elongated. Rainbands can be stratiform or convective, and are generated by differences in temperature. When noted on weather radar imagery, this precipitation elongation is referred to as banded structure. Rainbands within tropical cyclones are curved in orientation. Rainbands of tropical cyclones contain showers and thunderstorms that, together with the eyewall and the eye, constitute a hurricane or tropical storm. The extent of rainbands around a tropical cyclone can help determine the cyclone's intensity.

<span class="mw-page-title-main">Annular tropical cyclone</span> Tropical cyclone with a symmetrical shape

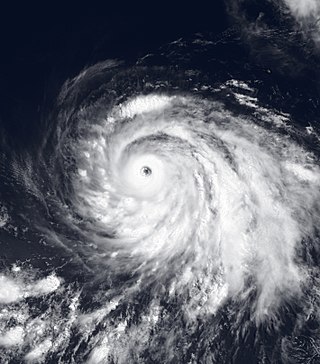
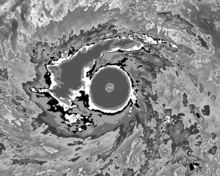
An annular tropical cyclone is a tropical cyclone that features a normal to large, symmetric eye surrounded by a thick and uniform ring of intense convection, often having a relative lack of discrete rainbands, and bearing a symmetric appearance in general. As a result, the appearance of an annular tropical cyclone can be referred to as akin to a tire or doughnut. Annular characteristics can be attained as tropical cyclones intensify; however, outside the processes that drive the transition from asymmetric systems to annular systems and the abnormal resistance to negative environmental factors found in storms with annular features, annular tropical cyclones behave similarly to asymmetric storms. Most research related to annular tropical cyclones is limited to satellite imagery and aircraft reconnaissance as the conditions thought to give rise to annular characteristics normally occur over open water, well removed from landmasses where surface observations are possible.

<span class="mw-page-title-main">Eye (cyclone)</span> Central area of calm weather in a tropical cyclone

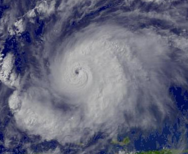
The eye is a region of mostly calm weather at the center of a tropical cyclone. The eye of a storm is a roughly circular area, typically 30–65 kilometers in diameter. It is surrounded by the eyewall, a ring of towering thunderstorms where the most severe weather and highest winds of the cyclone occur. The cyclone's lowest barometric pressure occurs in the eye and can be as much as 15 percent lower than the pressure outside the storm.

<span class="mw-page-title-main">Vernon Dvorak</span> American meteorologist (1928–2022)

Vernon Francis Dvorak was an American meteorologist. He studied meteorology at the University of California, Los Angeles and wrote his Master thesis An investigation of the inversion-cloud regime over the subtropical waters west of California in 1966. In 1973 he developed the Dvorak technique to analyze tropical cyclones from satellite imagery. He worked with the National Environmental Satellite, Data, and Information Service. He lived in Ojai, California, until his death on September 19, 2022.

<span class="mw-page-title-main">Central dense overcast</span> Large central area of thunderstorms surrounding its circulation center

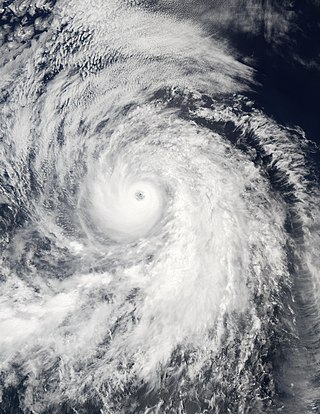
The central dense overcast, or CDO, of a tropical cyclone or strong subtropical cyclone is the large central area of thunderstorms surrounding its circulation center, caused by the formation of its eyewall. It can be round, angular, oval, or irregular in shape. This feature shows up in tropical cyclones of tropical storm or hurricane strength. How far the center is embedded within the CDO, and the temperature difference between the cloud tops within the CDO and the cyclone's eye, can help determine a tropical cyclone's intensity with the Dvorak technique. Locating the center within the CDO can be a problem with strong tropical storms and minimal hurricanes as its location can be obscured by the CDO's high cloud canopy. This center location problem can be resolved through the use of microwave satellite imagery.

<span class="mw-page-title-main">Extratropical cyclone</span> Type of cyclone

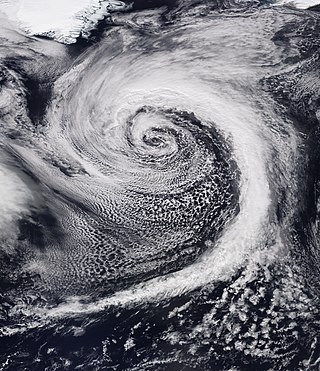
Extratropical cyclones, sometimes called mid-latitude cyclones or wave cyclones, are low-pressure areas which, along with the anticyclones of high-pressure areas, drive the weather over much of the Earth. Extratropical cyclones are capable of producing anything from cloudiness and mild showers to severe gales, thunderstorms, blizzards, and tornadoes. These types of cyclones are defined as large scale (synoptic) low pressure weather systems that occur in the middle latitudes of the Earth. In contrast with tropical cyclones, extratropical cyclones produce rapid changes in temperature and dew point along broad lines, called weather fronts, about the center of the cyclone.

<span class="mw-page-title-main">Tropical cyclone</span> Rapidly rotating storm system

A tropical cyclone is a rapidly rotating storm system characterized by a low-pressure center, a closed low-level atmospheric circulation, strong winds, and a spiral arrangement of thunderstorms that produce heavy rain and squalls. Depending on its location and strength, a tropical cyclone is referred to by different names, including hurricane, typhoon, tropical storm, cyclonic storm, tropical depression, or simply cyclone. A hurricane is a strong tropical cyclone that occurs in the Atlantic Ocean or northeastern Pacific Ocean, and a typhoon occurs in the northwestern Pacific Ocean. In the Indian Ocean and South Pacific, comparable storms are referred to as "tropical cyclones". In modern times, on average around 80 to 90 named tropical cyclones form each year around the world, over half of which develop hurricane-force winds of 65 kn or more. Tropical cyclones carry heat and energy away from the tropics and transport it towards temperate latitudes, which plays an important role in regulating global climate.

<span class="mw-page-title-main">Hurricane Dora (1999)</span> Category 4 Pacific hurricane in 1999

Hurricane Dora was one of few tropical cyclones to track across all three north Pacific basins and the first since Hurricane John in 1994. The fourth named storm, third hurricane, and second major hurricane of the 1999 Pacific hurricane season, Dora developed on August 6 from a tropical wave to the south of Mexico. Forming as a tropical depression, the system gradually strengthened and was upgraded to Tropical Storm Dora later that day. Thereafter Dora began heading in a steadily westward direction, before becoming a hurricane on August 8. Amid warm sea surface temperatures and low wind shear, the storm continued to intensify, eventually peaking as a 140 mph (220 km/h) Category 4 hurricane on August 12.

<span class="mw-page-title-main">Hurricane Adolph</span> Category 4 Pacific hurricane in 2001

Hurricane Adolph was the first and one of only two East Pacific hurricanes in May to reach Category 4 strength on the Saffir-Simpson Hurricane Scale since record keeping began in the East Pacific, with the other being Amanda of 2014. Adolph was the first depression of the season, forming on May 25; it became a hurricane three days later. After rapidly intensifying, Adolph became the most powerful storm in terms of maximum sustained winds this season, along with Hurricane Juliette. The storm briefly threatened land before dissipating on June 1, after moving over colder waters.

<span class="mw-page-title-main">Hurricane Guillermo (1997)</span> Category 5 Pacific hurricane in 1997

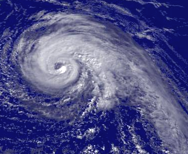
Hurricane Guillermo was the ninth-most intense Pacific hurricane on record, attaining peak winds of 160 mph (260 km/h) and a barometric pressure of 919 hPa (27.14 inHg). Forming out of a tropical wave on July 30, 1997, roughly 345 mi (555 km) south of Salina Cruz, Mexico, Guillermo tracked in a steady west-northwestward direction while intensifying. The system reached hurricane status by August 1 before undergoing rapid intensification the following day. At the end of this phase, the storm attained its peak intensity as a powerful Category 5 hurricane. The storm began to weaken during the afternoon of August 5 and was downgraded to a tropical storm on August 8. Once entering the Central Pacific Hurricane Center's area of responsibility, Guillermo briefly weakened to a tropical depression before re-attaining tropical storm status. On August 15, the storm reached an unusually high latitude of 41.8°N before transitioning into an extratropical cyclone. The remnants persisted for more than a week as they tracked towards the northeast and later south and east before being absorbed by a larger extratropical system off the coast of California on August 24.

<span class="mw-page-title-main">Radius of maximum wind</span> Meteorological concept

The radius of maximum wind (RMW) is the distance between the center of a cyclone and its band of strongest winds. It is a parameter in atmospheric dynamics and tropical cyclone forecasting. The highest rainfall rates occur near the RMW of tropical cyclones. The extent of a cyclone's storm surge and its maximum potential intensity can be determined using the RMW. As maximum sustained winds increase, the RMW decreases. Recently, RMW has been used in descriptions of tornadoes. When designing buildings to prevent against failure from atmospheric pressure change, RMW can be used in the calculations.

<span class="mw-page-title-main">1975 Pacific Northwest hurricane</span> Category 1 Pacific hurricane in 1975

The 1975 Pacific Northwest hurricane was an unusual Pacific tropical cyclone that attained hurricane status farther north than any other Pacific hurricane. It was officially unnamed, with the cargo ship Transcolorado providing vital meteorological data in assessing the storm. The twelfth tropical cyclone of the 1975 Pacific hurricane season, it developed from a cold-core upper-level low merging with the remnants of a tropical cyclone on August 31, well to the northeast of Hawaii. Convection increased as the circulation became better defined, and by early on September 2, it became a tropical storm. Turning to the northeast through an area of warm water temperatures, the storm quickly strengthened, and, after developing an eye, it attained hurricane status late on September 3, while located about 1,200 miles (1,950 km) south of Alaska. After maintaining peak winds for about 18 hours, the storm rapidly weakened, as it interacted with an approaching cold front. Early on September 5, it lost its identity near the coast of Alaska.

The maximum sustained wind associated with a tropical cyclone is a common indicator of the intensity of the storm. Within a mature tropical cyclone, it is found within the eyewall at a distance defined as the radius of maximum wind, or RMW. Unlike gusts, the value of these winds are determined via their sampling and averaging the sampled results over a period of time. Wind measuring has been standardized globally to reflect the winds at 10 metres (33 ft) above mean sea level, and the maximum sustained wind represents the highest average wind over either a one-minute (US) or ten-minute time span, anywhere within the tropical cyclone. Surface winds are highly variable due to friction between the atmosphere and the Earth's surface, as well as near hills and mountains over land.

<span class="mw-page-title-main">Hurricane Hernan (1996)</span> Category 1 Pacific hurricane in 1996

Hurricane Hernan was fourth and final tropical cyclone to strike Mexico at hurricane intensity during the 1996 Pacific hurricane season. The thirteenth tropical cyclone, eighth named storm, and fifth hurricane of the season, Hernan developed as a tropical depression from a tropical wave to the south of Mexico on September 30. The depression quickly strengthened, and became Tropical Storm Hernan later that day. Hernan curved north-northwestward the following day, before eventually turning north-northeastward. Still offshore of the Mexican coast on October 2, Hernan intensified into a hurricane. Six hours later, Hernan attained its peak as an 85 mph (140 km/h) Category 1 hurricane on the Saffir-Simpson Hurricane Wind Scale (SSHWS). After weakening somewhat, on 1000 UTC October 3, Hurricane Hernan made landfall near Barra de Navidad, Jalisco, with winds of 75 mph (120 km/h). Only two hours after landfall, Hernan weakened to a tropical storm. By October 4, Tropical Storm Hernan had weakened into a tropical depression, and dissipated over Nayarit on the following day.

<span class="mw-page-title-main">Hurricane Fausto (2002)</span> Category 4 Pacific hurricane in 2002

Hurricane Fausto was a long-lived tropical cyclone that formed during the 2002 Pacific hurricane season, and later regenerated at an unusually high latitude over the north-central Pacific Ocean. Fausto was the eighth tropical cyclone, sixth named storm, fourth hurricane, and third major hurricane of the annual season. The storm developed on August 21 from a tropical wave that had crossed the Atlantic, and entered the Pacific on August 17. Becoming a tropical depression, the system intensified, and quickly became Tropical Storm Fausto early on August 22. Fausto rapidly intensified, and was already a hurricane on that same day as becoming a tropical storm. Rapid intensification continued, and the tropical cyclone ultimately peaked as a strong Category 4 hurricane on the Saffir–Simpson hurricane scale. At that time, the winds 145 mph (233 km/h). Fausto began to gradually weaken after attaining peak intensity on August 24, and was eventually downgraded to a tropical storm two days later. Weakening continued, and Fausto degenerated into a remnant low on August 28 while well northeast of Hawaii.

<span class="mw-page-title-main">Cyclone Monica</span> Category 5 Australian region cyclone in 2006

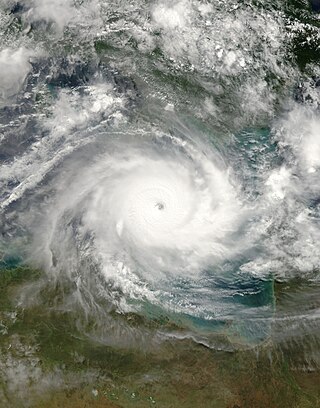
Severe Tropical Cyclone Monica was the most intense tropical cyclone, in terms of maximum sustained winds, on record to impact Australia. The 17th and final storm of the 2005–06 Australian region cyclone season, Monica originated from an area of low pressure off the coast of Papua New Guinea on 16 April 2006. The storm quickly developed into a Category 1 cyclone the next day, at which time it was given the name Monica. Travelling towards the west, the storm intensified into a severe tropical cyclone before making landfall in Far North Queensland, near Lockhart River, on 19 April 2006. After moving over land, convection associated with the storm quickly became disorganised.

<span class="mw-page-title-main">Typhoon Alex (1987)</span> Pacific typhoon in 1987

Typhoon Alex, known in the Philippines as Typhoon Etang, affected the Taiwan, China, and South Korea during July 1987. Typhoon Alex developed from the monsoon trough that spawned a tropical disturbance late on July 21 southwest of Guam which organized into a tropical depression shortly thereafter. The system steadily became better organized, and the next day, a tropical depression had developed. Satellite intensity estimates gradually increased, and on July 23, the depression intensified into Tropical Storm Alex. After initially tracking west-northwest, Tropical Storm Alex started tracking northwest. An eye developed on July 24, and on the next day, Alex was classified as a typhoon, when Alex attained its peak intensity of 120 km/h (75 mph) and a minimum barometric pressure of 970 mbar (29 inHg). Alex weakened while tracking more northward, though interaction with Taiwan resulted in a more westward track starting on July 27. The storm struck near Shanghai as a tropical storm, and weakened over land, although it remained identifiable through August 2.

<span class="mw-page-title-main">Meteorological history of Typhoon Haiyan</span>

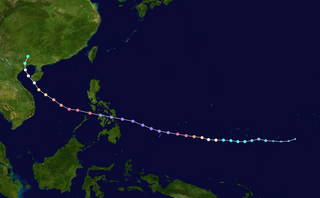
Typhoon Haiyan's meteorological history began with its origins as a tropical disturbance east-southeast of Pohnpei and lasted until its degeneration as a tropical cyclone over southern China. The thirteenth typhoon of the 2013 Pacific typhoon season, Haiyan originated from an area of low pressure several hundred kilometers east-southeast of Pohnpei in the Federated States of Micronesia on November 2. Tracking generally westward, environmental conditions favored tropical cyclogenesis and the system developed into a tropical depression the following day. After becoming a tropical storm and attaining the name Haiyan at 0000 UTC on November 4, the system began a period of rapid intensification that brought it to typhoon intensity by 1800 UTC on November 5. By November 6, the Joint Typhoon Warning Center (JTWC) assessed the system as a Category 5-equivalent super typhoon on the Saffir–Simpson hurricane wind scale; the storm passed over the island of Kayangel in Palau shortly after attaining this strength.

<span class="mw-page-title-main">Cyclone Connie</span> South-West Indian tropical cyclone in 2000

Intense Tropical Cyclone Connie was a strong tropical cyclone that affected both Mauritius and Réunion in late January 2000. On January 24, 2000, a tropical disturbance developed well east of Madagascar. Despite moderate wind shear, it gradually strengthened while stalling offshore, and late on January 25, was believed to have attained tropical storm status. After turning generally southeast, Connie attained cyclone intensity on January 27. Rapid intensification ensued. Shortly after developing a well-defined eye, Connie attained peak intensity at 0000 UTC on January 28 as an intense tropical cyclone. Thereafter, Connie slowly weakened due to increased wind shear as thunderstorm activity quickly diminished around the eye. After threatening Mauritius, Connie then turned southwest, passing very close to Réunion late on January 28. After briefly leveling off in intensity that evening, Connie soon became less organized, and midday on January 29, the eye became less defined. The next day, Connie weakened to a severe tropical storm. Despite forecasts of additional weakening, Connie maintained its intensity for most of January 31. However, weakening resumed on February 1 and the storm transitioned to an extratropical cyclone on February 2. Two days later, Connie merged with another low-pressure area.

<span class="mw-page-title-main">Meteorological history of Hurricane Patricia</span>

Hurricane Patricia was the most intense tropical cyclone ever recorded in the Western Hemisphere and the second-most intense worldwide in terms of barometric pressure. It also featured the highest one-minute maximum sustained winds ever recorded in a tropical cyclone. Originating from a sprawling disturbance near the Gulf of Tehuantepec in mid-October 2015, Patricia was first classified a tropical depression on October 20. Initial development was slow, with only modest strengthening within the first day of its classification. The system later became a tropical storm and was named Patricia, the twenty-fourth named storm of the annual hurricane season. Exceptionally favorable environmental conditions fueled explosive intensification on October 22. A well-defined eye developed within an intense central dense overcast and Patricia grew from a tropical storm to a Category 5 hurricane in just 24 hours—a near-record pace. The magnitude of intensification was poorly forecast and both forecast models and meteorologists suffered from record-high prediction errors.

References

  1. 1 2 3 4 Velden, Christopher; Bruce Harper; Frank Wells; John L. Beven II; Ray Zehr; Timothy Olander; Max Mayfield; Charles “Chip” Guard; Mark Lander; Roger Edson; Lixion Avila; Andrew Burton; Mike Turk; Akihiro Kikuchi; Adam Christian; Philippe Caroff & Paul McCrone (September 2006). "The Dvorak Tropical Cyclone Intensity Estimation Technique: A Satellite-Based Method That Has Endured For Over 30 Years" (PDF). Bulletin of the American Meteorological Society. 87 (9): 1195–1214. Bibcode:2006BAMS...87.1195V. doi:10.1175/bams-87-9-1195. S2CID   15193271 . Retrieved 2012-09-26.
  2. Satellite and Information Service Division (April 17, 2005). "Dvorak Current Intensity Chart". National Oceanic and Atmospheric Administration . Retrieved 2006-06-12.
  3. 1 2 Landsea, Chris (2006). "Subject: H1) What is the Dvorak technique and how is it used?". Hurricane Research Division . Retrieved 2012-09-09.
  4. Timothy L. Olander; Christopher S. Velden (February 2015). ADT – Advanced Dvorak Technique Users' Guide (McIDAS Version 8.2.1) (PDF). Cooperative Institute for Meteorological Satellite Studies (Report). University of Wisconsin–Madison. p. 49. Retrieved October 29, 2015.
  5. Naval Research Laboratory. "Tropical Cyclone Forecasters Reference Guide". United States Navy. Archived from the original on 2006-08-11. Retrieved 2006-05-29.
  6. Leffler, J.W. "T-Number Curve Comparison between JTWC and JMA". Archived from the original on 2006-07-25.
  7. National Oceanic and Atmospheric Administration Satellite and Information Service (2011-08-26). "The Dvorak Technique Explained". National Oceanic and Atmospheric Administration . Retrieved 2006-05-29.
  8. 1 2 Burton, Andrew; Christopher Velden (2011-04-16). "Proceedings of the International Workshop on Satellite Analysis of Tropical Cyclones Report No. TCP-52" (PDF). World Meteorological Organization. pp. 3–4. Retrieved 2012-11-23.
  9. 1 2 3 Velden, Christopher; Timothy L. Olander & Raymond M. Zehr (March 1998). "Development of an Objective Scheme to Estimate Tropical Cyclone Intensity from Digital Geostationary Satellite Infrared Imagery". Weather and Forecasting. University of Wisconsin. 13 (1): 172–186. Bibcode:1998WtFor..13..172V. doi: 10.1175/1520-0434(1998)013<0172:DOAOST>2.0.CO;2 . S2CID   913230 . Retrieved 2012-09-09.
  10. 1 2 Lander, Mark A. (January 1999). "Pictures of the Month: A Tropical Cyclone With an Enormous Central Cold Cover". Monthly Weather Review. American Meteorological Society. 127 (1): 132–134. Bibcode:1999MWRv..127..132L. doi: 10.1175/1520-0493(1999)127<0132:atcwae>2.0.co;2 .
  11. 1 2 Dvorak, Vernon F. (February 1973). "A Technique For the Analysis and Forecasting of Tropical Cyclone Intensities From Satellite Pictures". National Oceanic and Atmospheric Administration: 5–8.{{cite journal}}: Cite journal requires |journal= (help)
  12. Wimmers, Anthony; Chistopher Velden (2012). "Advances in Objective Tropical Cyclone Center Fixing Using Multispectral Satellite Imagery". American Meteorological Society. Retrieved 2012-08-12.
  13. Rogers, Edward; R. Cecil Gentry; William Shenk & Vincent Oliver (May 1979). "The Benefits of Using Short-Interval Satellite Images To Derive Winds For Tropical Cyclones". Monthly Weather Review. American Meteorological Society. 107 (5): 575–584. Bibcode:1979MWRv..107..575R. doi: 10.1175/1520-0493(1979)107<0575:tbousi>2.0.co;2 . hdl: 2060/19790002501 .
  14. De Maria, Mark (1999-04-19). "Satellite Application is Tropical Weather Forecasting". Archived from the original on 2006-08-13. Retrieved 2006-05-29.
  15. Stewart, Stacy (2005-10-16). "NHC Tropical Depression 24 Discussion Number 3". National Hurricane Center . Retrieved 2006-05-29.
  16. "Cyclone Center". www.cyclonecenter.org. Retrieved 2015-08-05.
Agencies issuing Dvorak intensity estimates
Other