Electromagnetic absorption by water

Last updated

Absorption spectrum (attenuation coefficient vs. wavelength) of liquid water (red), atmospheric water vapor (green) and ice (blue line) between 667 nm and 200 mm. The plot for vapor is a transformation of data Synthetic spectrum for gas mixture 'Pure H2O' (296K, 1 atm) retrieved from Hitran on the Web Information System. Water infrared absorption coefficient.gif
Absorption spectrum (attenuation coefficient vs. wavelength) of liquid water (red), atmospheric water vapor (green) and ice (blue line) between 667 nm and 200 μm. The plot for vapor is a transformation of data Synthetic spectrum for gas mixture 'Pure H2O' (296K, 1 atm) retrieved from Hitran on the Web Information System.
Liquid water absorption spectrum across a wide wavelength range Absorption spectrum of liquid water.png
Liquid water absorption spectrum across a wide wavelength range

The absorption of electromagnetic radiation by water depends on the state of the water.

Contents

The absorption in the gas phase occurs in three regions of the spectrum. Rotational transitions are responsible for absorption in the microwave and far-infrared, vibrational transitions in the mid-infrared and near-infrared. Vibrational bands have rotational fine structure. Electronic transitions occur in the vacuum ultraviolet regions.

Liquid water has no rotational spectrum but does absorb in the microwave region. Its weak absorption in the visible spectrum results in the pale blue color of water.

Overview

The water molecule, in the gaseous state, has three types of transition that can give rise to absorption of electromagnetic radiation:

In reality, vibrations of molecules in the gaseous state are accompanied by rotational transitions, giving rise to a vibration-rotation spectrum. Furthermore, vibrational overtones and combination bands occur in the near-infrared region. The HITRAN spectroscopy database lists more than 37,000 spectral lines for gaseous H216O, ranging from the microwave region to the visible spectrum. [5] [12]

In liquid water the rotational transitions are effectively quenched, but absorption bands are affected by hydrogen bonding. In crystalline ice the vibrational spectrum is also affected by hydrogen bonding and there are lattice vibrations causing absorption in the far-infrared. Electronic transitions of gaseous molecules will show both vibrational and rotational fine structure.

Units

Infrared absorption band positions may be given either in wavelength (usually in micrometers, μm) or wavenumber (usually in reciprocal centimeters, cm−1) scale.

Rotational spectrum

Part of the pure rotation absorption spectrum of water vapour Atmospheric terahertz transmittance at Mauna Kea (simulated).svg
Part of the pure rotation absorption spectrum of water vapour
Rotating water molecule Water molecule rotation animation.gif
Rotating water molecule

The water molecule is an asymmetric top, that is, it has three independent moments of inertia. Rotation about the 2-fold symmetry axis is illustrated at the left. Because of the low symmetry of the molecule, a large number of transitions can be observed in the far infrared region of the spectrum. Measurements of microwave spectra have provided a very precise value for the O−H bond length, 95.84 ± 0.05 pm and H−O−H bond angle, 104.5 ± 0.3°. [13]

Vibrational spectrum

The three fundamental vibrations of the water molecule
Symmetrical stretching.gif
ν1, O-H symmetric stretching
3657 cm−1 (2.734 μm)
Scissoring.gif
ν2, H-O-H bending
1595 cm−1 (6.269 μm)
Asymmetrical stretching.gif
ν3, O-H asymmetric stretching
3756 cm−1 (2.662 μm)

The water molecule has three fundamental molecular vibrations. The O-H stretching vibrations give rise to absorption bands with band origins at 3657 cm−11, 2.734 μm) and 3756 cm−13, 2.662 μm) in the gas phase. The asymmetric stretching vibration, of B2 symmetry in the point group C2v is a normal vibration. The H-O-H bending mode origin is at 1595 cm−12, 6.269 μm). Both symmetric stretching and bending vibrations have A1 symmetry, but the frequency difference between them is so large that mixing is effectively zero. In the gas phase all three bands show extensive rotational fine structure. [14] In the near-infrared spectrum ν3 has a series of overtones at wavenumbers somewhat less than n·ν3, n=2,3,4,5... Combination bands, such as ν2 + ν3 are also easily observed in the near-infrared region. [15] [16] The presence of water vapor in the atmosphere is important for atmospheric chemistry especially as the infrared and near infrared spectra are easy to observe. Standard (atmospheric optical) codes are assigned to absorption bands as follows. 0.718 μm (visible): α, 0.810 μm: μ, 0.935 μm: ρστ, 1.13 μm: φ, 1.38 μm: ψ, 1.88 μm: Ω, 2.68 μm: X. The gaps between the bands define the infrared window in the Earth's atmosphere. [17]

The infrared spectrum of liquid water is dominated by the intense absorption due to the fundamental O-H stretching vibrations. Because of the high intensity, very short path lengths, usually less than 50 μm, are needed to record the spectra of aqueous solutions. There is no rotational fine structure, but the absorption bands are broader than might be expected, because of hydrogen bonding. [18] Peak maxima for liquid water are observed at 3450 cm−1 (2.898 μm), 3615 cm−1 (2.766 μm) and 1640 cm −1 (6.097 μm). [14] Direct measurement of the infrared spectra of aqueous solutions requires that the cuvette windows be made of substances such as calcium fluoride which are water-insoluble. This difficulty can alternatively be overcome by using an attenuated total reflectance (ATR) device rather than transmission.

In the near-infrared range liquid water has absorption bands around 1950 nm (5128 cm−1), 1450 nm (6896 cm−1), 1200 nm (8333 cm−1) and 970 nm, (10300 cm−1). [19] [20] [15] The regions between these bands can be used in near-infrared spectroscopy to measure the spectra of aqueous solutions, with the advantage that glass is transparent in this region, so glass cuvettes can be used. The absorption intensity is weaker than for the fundamental vibrations, but this is not important as longer path-length cuvettes can be used. The absorption band at 698 nm (14300 cm−1) is a 3rd overtone (n=4). It tails off onto the visible region and is responsible for the intrinsic blue color of water. This can be observed with a standard UV/vis spectrophotometer, using a 10 cm path-length. The colour can be seen by eye by looking through a column of water about 10 m in length; the water must be passed through an ultrafilter to eliminate color due to Rayleigh scattering which also can make water appear blue. [16] [21] [22]

The spectrum of ice is similar to that of liquid water, with peak maxima at 3400 cm−1 (2.941 μm), 3220 cm−1 (3.105 μm) and 1620 cm−1 (6.17 μm) [14]

In both liquid water and ice clusters, low-frequency vibrations occur, which involve the stretching (TS) or bending (TB) of intermolecular hydrogen bonds (O–H•••O). Bands at wavelengths λ = 50-55 μm or 182-200 cm−1 (44 μm, 227 cm−1 in ice) have been attributed to TS, intermolecular stretch, and 200 μm or 50 cm−1 (166 μm, 60 cm−1 in ice), to TB, intermolecular bend [11]

Visible region

Predicted wavelengths of overtones and combination bands of liquid water in the visible region [16]
ν1, ν3ν2wavelength /nm
40742
41662
50605
51550
60514
61474
70449
71418
80401
81376

Absorption coefficients for 200 nm and 900 nm are almost equal at 6.9 m−1 (attenuation length of 14.5 cm). Very weak light absorption, in the visible region, by liquid water has been measured using an integrating cavity absorption meter (ICAM). [16] The absorption was attributed to a sequence of overtone and combination bands whose intensity decreases at each step, giving rise to an absolute minimum at 418 nm, at which wavelength the attenuation coefficient is about 0.0044 m−1, which is an attenuation length of about 227 meters. These values correspond to pure absorption without scattering effects. The attenuation of, e.g., a laser beam would be slightly stronger.

Visible light absorption spectrum of pure water (absorption coefficient vs. wavelength) Absorption coefficient of water.svg
Visible light absorption spectrum of pure water (absorption coefficient vs. wavelength)

Electronic spectrum

The electronic transitions of the water molecule lie in the vacuum ultraviolet region. For water vapor the bands have been assigned as follows. [11]

At least some of these transitions result in photodissociation of water into H+OH. Among them the best known is that at 166.5 nm.

Microwaves and radio waves

Dielectric permittivity and dielectric loss of water between 0 degC and 100 degC, the arrows showing the effect of increasing temperature Dielectric loss water.png
Dielectric permittivity and dielectric loss of water between 0 °C and 100 °C, the arrows showing the effect of increasing temperature

The pure rotation spectrum of water vapor extends into the microwave region.

Liquid water has a broad absorption spectrum in the microwave region, which has been explained in terms of changes in the hydrogen bond network giving rise to a broad, featureless, microwave spectrum. [24] The absorption (equivalent to dielectric loss) is used in microwave ovens to heat food that contains water molecules. A frequency of 2.45 GHz, wavelength 122 mm, is commonly used.

Radiocommunication at GHz frequencies is very difficult in fresh waters and even more so in salt waters. [11]

Atmospheric effects

Synthetic stick absorption spectrum of a simple gas mixture corresponding to the Earth's atmosphere composition based on HITRAN data created using Hitran on the Web system. Green color - water vapor, WN - wavenumber (caution: lower wavelengths on the right, higher on the left). Water vapor concentration for this gas mixture is 0.4%. Synthetic atmosphere absorption spectrum.gif
Synthetic stick absorption spectrum of a simple gas mixture corresponding to the Earth's atmosphere composition based on HITRAN data created using Hitran on the Web system. Green color - water vapor, WN – wavenumber (caution: lower wavelengths on the right, higher on the left). Water vapor concentration for this gas mixture is 0.4%.

Water vapor is a greenhouse gas in the Earth's atmosphere, responsible for 70% of the known absorption of incoming sunlight, particularly in the infrared region, and about 60% of the atmospheric absorption of thermal radiation by the Earth known as the greenhouse effect. [25] It is also an important factor in multispectral imaging and hyperspectral imaging used in remote sensing [12] because water vapor absorbs radiation differently in different spectral bands. Its effects are also an important consideration in infrared astronomy and radio astronomy in the microwave or millimeter wave bands. The South Pole Telescope was constructed in Antarctica in part because the elevation and low temperatures there mean there is very little water vapor in the atmosphere. [26]

Similarly, carbon dioxide absorption bands occur around 1400, 1600 and 2000 nm, [27] but its presence in the Earth's atmosphere accounts for just 26% of the greenhouse effect. [25] Carbon dioxide gas absorbs energy in some small segments of the thermal infrared spectrum that water vapor misses. This extra absorption within the atmosphere causes the air to warm just a bit more and the warmer the atmosphere the greater its capacity to hold more water vapor. This extra water vapor absorption further enhances the Earth's greenhouse effect. [28]

In the atmospheric window between approximately 8000 and 14000 nm, in the far-infrared spectrum, carbon dioxide and water absorption is weak. [29] This window allows most of the thermal radiation in this band to be radiated out to space directly from the Earth's surface. This band is also used for remote sensing of the Earth from space, for example with thermal Infrared imaging.

As well as absorbing radiation, water vapour occasionally emits radiation in all directions, according to the Black Body Emission curve for its current temperature overlaid on the water absorption spectrum. Much of this energy will be recaptured by other water molecules, but at higher altitudes, radiation sent towards space is less likely to be recaptured, as there is less water available to recapture radiation of water-specific absorbing wavelengths. By the top of the troposphere, about 12 km above sea level, most water vapor condenses to liquid water or ice as it releases its heat of vapourization. Once changed state, liquid water and ice fall away to lower altitudes. This will be balanced by incoming water vapour rising via convection currents.

Liquid water and ice emit radiation at a higher rate than water vapour (see graph above). Water at the top of the troposphere, particularly in liquid and solid states, cools as it emits net photons to space. Neighboring gas molecules other than water (e.g. nitrogen) are cooled by passing their heat kinetically to the water. This is why temperatures at the top of the troposphere (known as the tropopause) are about -50 degrees Celsius.

See also

Related Research Articles

<span class="mw-page-title-main">Electromagnetic spectrum</span> Range of frequencies or wavelengths of electromagnetic radiation

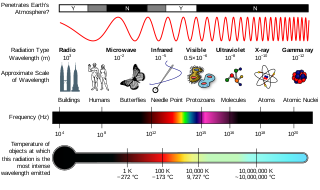
The electromagnetic spectrum is the full range of electromagnetic radiation, organized by frequency or wavelength. The spectrum is divided into separate bands, with different names for the electromagnetic waves within each band. From low to high frequency these are: radio waves, microwaves, infrared, visible light, ultraviolet, X-rays, and gamma rays. The electromagnetic waves in each of these bands have different characteristics, such as how they are produced, how they interact with matter, and their practical applications.

<span class="mw-page-title-main">Infrared</span> Form of electromagnetic radiation

Infrared is electromagnetic radiation (EMR) with wavelengths longer than that of visible light but shorter than microwaves. The infrared spectral band begins with waves that are just longer than those of red light, the longest waves in the visible spectrum, so IR is invisible to the human eye. IR is generally understood to include wavelengths from around 750 nm to 1 mm. IR is commonly divided between longer-wavelength thermal IR, emitted from terrestrial sources, and shorter-wavelength IR or near-IR, part of the solar spectrum. Longer IR wavelengths (30–100 μm) are sometimes included as part of the terahertz radiation band. Almost all black-body radiation from objects near room temperature is in the IR band. As a form of electromagnetic radiation, IR carries energy and momentum, exerts radiation pressure, and has properties corresponding to both those of a wave and of a particle, the photon.

<span class="mw-page-title-main">Infrared spectroscopy</span> Measurement of infrared radiations interaction with matter

Infrared spectroscopy is the measurement of the interaction of infrared radiation with matter by absorption, emission, or reflection. It is used to study and identify chemical substances or functional groups in solid, liquid, or gaseous forms. It can be used to characterize new materials or identify and verify known and unknown samples. The method or technique of infrared spectroscopy is conducted with an instrument called an infrared spectrometer which produces an infrared spectrum. An IR spectrum can be visualized in a graph of infrared light absorbance on the vertical axis vs. frequency, wavenumber or wavelength on the horizontal axis. Typical units of wavenumber used in IR spectra are reciprocal centimeters, with the symbol cm−1. Units of IR wavelength are commonly given in micrometers, symbol μm, which are related to the wavenumber in a reciprocal way. A common laboratory instrument that uses this technique is a Fourier transform infrared (FTIR) spectrometer. Two-dimensional IR is also possible as discussed below.

<span class="mw-page-title-main">Spectroscopy</span> Study involving matter and electromagnetic radiation

Spectroscopy is the field of study that measures and interprets electromagnetic spectra. In narrower contexts, spectroscopy is the precise study of color as generalized from visible light to all bands of the electromagnetic spectrum.

<span class="mw-page-title-main">Spectral line</span> A distinctive narrow spectral feature of chemical species

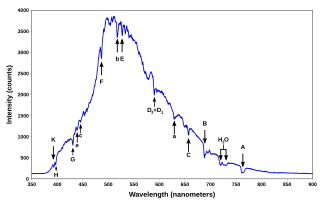
A spectral line is a weaker or stronger region in an otherwise uniform and continuous spectrum. It may result from emission or absorption of light in a narrow frequency range, compared with the nearby frequencies. Spectral lines are often used to identify atoms and molecules. These "fingerprints" can be compared to the previously collected ones of atoms and molecules, and are thus used to identify the atomic and molecular components of stars and planets, which would otherwise be impossible.

<span class="mw-page-title-main">Microwave radiometer</span> Tool measuring EM radiation at 0.3–300-GHz frequency

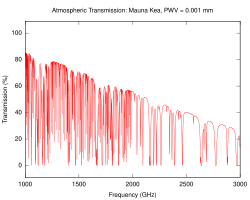
A microwave radiometer (MWR) is a radiometer that measures energy emitted at one millimeter-to-metre wavelengths (frequencies of 0.3–300 GHz) known as microwaves. Microwave radiometers are very sensitive receivers designed to measure thermally-emitted electromagnetic radiation. They are usually equipped with multiple receiving channels to derive the characteristic emission spectrum of planetary atmospheres, surfaces or extraterrestrial objects. Microwave radiometers are utilized in a variety of environmental and engineering applications, including remote sensing, weather forecasting, climate monitoring, radio astronomy and radio propagation studies.

<span class="mw-page-title-main">Absorption spectroscopy</span> Spectroscopic techniques that measure the absorption of radiation

Absorption spectroscopy is spectroscopy that involves techniques that measure the absorption of electromagnetic radiation, as a function of frequency or wavelength, due to its interaction with a sample. The sample absorbs energy, i.e., photons, from the radiating field. The intensity of the absorption varies as a function of frequency, and this variation is the absorption spectrum. Absorption spectroscopy is performed across the electromagnetic spectrum.

Rotational–vibrational spectroscopy is a branch of molecular spectroscopy that is concerned with infrared and Raman spectra of molecules in the gas phase. Transitions involving changes in both vibrational and rotational states can be abbreviated as rovibrational transitions. When such transitions emit or absorb photons, the frequency is proportional to the difference in energy levels and can be detected by certain kinds of spectroscopy. Since changes in rotational energy levels are typically much smaller than changes in vibrational energy levels, changes in rotational state are said to give fine structure to the vibrational spectrum. For a given vibrational transition, the same theoretical treatment as for pure rotational spectroscopy gives the rotational quantum numbers, energy levels, and selection rules. In linear and spherical top molecules, rotational lines are found as simple progressions at both higher and lower frequencies relative to the pure vibration frequency. In symmetric top molecules the transitions are classified as parallel when the dipole moment change is parallel to the principal axis of rotation, and perpendicular when the change is perpendicular to that axis. The ro-vibrational spectrum of the asymmetric rotor water is important because of the presence of water vapor in the atmosphere.

<span class="mw-page-title-main">Rotational spectroscopy</span> Spectroscopy of quantized rotational states of gases

Rotational spectroscopy is concerned with the measurement of the energies of transitions between quantized rotational states of molecules in the gas phase. The rotational spectrum of polar molecules can be measured in absorption or emission by microwave spectroscopy or by far infrared spectroscopy. The rotational spectra of non-polar molecules cannot be observed by those methods, but can be observed and measured by Raman spectroscopy. Rotational spectroscopy is sometimes referred to as pure rotational spectroscopy to distinguish it from rotational-vibrational spectroscopy where changes in rotational energy occur together with changes in vibrational energy, and also from ro-vibronic spectroscopy where rotational, vibrational and electronic energy changes occur simultaneously.

<span class="mw-page-title-main">Raman scattering</span> Inelastic scattering of photons by matter

In physics, Raman scattering or the Raman effect is the inelastic scattering of photons by matter, meaning that there is both an exchange of energy and a change in the light's direction. Typically this effect involves vibrational energy being gained by a molecule as incident photons from a visible laser are shifted to lower energy. This is called normal Stokes-Raman scattering.

<span class="mw-page-title-main">Molecular physics</span> Study of the physical and chemical properties of molecules

Molecular physics is the study of the physical properties of molecules and molecular dynamics. The field overlaps significantly with physical chemistry, chemical physics, and quantum chemistry. It is often considered as a sub-field of atomic, molecular, and optical physics. Research groups studying molecular physics are typically designated as one of these other fields. Molecular physics addresses phenomena due to both molecular structure and individual atomic processes within molecules. Like atomic physics, it relies on a combination of classical and quantum mechanics to describe interactions between electromagnetic radiation and matter. Experiments in the field often rely heavily on techniques borrowed from atomic physics, such as spectroscopy and scattering.

<span class="mw-page-title-main">Absorption band</span> Range on the electromagnetic spectrum

In quantum mechanics, an absorption band is a range of wavelengths, frequencies or energies in the electromagnetic spectrum that are characteristic of a particular transition from initial to final state in a substance.

<span class="mw-page-title-main">Infrared window</span> Atmospheric window

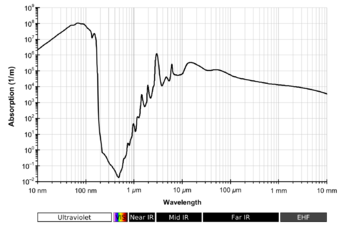
The infrared atmospheric window refers to a region of the infrared spectrum where there is relatively little absorption of terrestrial thermal radiation by atmospheric gases. The window plays an important role in the atmospheric greenhouse effect by maintaining the balance between incoming solar radiation and outgoing IR to space. In the Earth's atmosphere this window is roughly the region between 8 and 14 μm although it can be narrowed or closed at times and places of high humidity because of the strong absorption in the water vapor continuum or because of blocking by clouds. It covers a substantial part of the spectrum from surface thermal emission which starts at roughly 5 μm. Principally it is a large gap in the absorption spectrum of water vapor. Carbon dioxide plays an important role in setting the boundary at the long wavelength end. Ozone partly blocks transmission in the middle of the window.

FUTBOLIN is a radiative transfer model for the calculation of line-by-line atmospheric emission/transmission spectra in planetary atmospheres. It has been developed by Javier Martín-Torres. It allows generating high-resolution synthetic spectra in the 0.3-1000 micrometre spectral range.

Chemical imaging is the analytical capability to create a visual image of components distribution from simultaneous measurement of spectra and spatial, time information. Hyperspectral imaging measures contiguous spectral bands, as opposed to multispectral imaging which measures spaced spectral bands.

<span class="mw-page-title-main">HITRAN</span>

HITRAN molecular spectroscopic database is a compilation of spectroscopic parameters used to simulate and analyze the transmission and emission of light in gaseous media, with an emphasis on planetary atmospheres. The knowledge of spectroscopic parameters for transitions between energy levels in molecules is essential for interpreting and modeling the interaction of radiation (light) within different media.

<span class="mw-page-title-main">Fourier-transform infrared spectroscopy</span> Technique to analyze the infrared spectrum of matter

Fourier-transform infrared spectroscopy (FTIR) is a technique used to obtain an infrared spectrum of absorption or emission of a solid, liquid, or gas. An FTIR spectrometer simultaneously collects high-resolution spectral data over a wide spectral range. This confers a significant advantage over a dispersive spectrometer, which measures intensity over a narrow range of wavelengths at a time.

Vibronic spectroscopy is a branch of molecular spectroscopy concerned with vibronic transitions: the simultaneous changes in electronic and vibrational energy levels of a molecule due to the absorption or emission of a photon of the appropriate energy. In the gas phase, vibronic transitions are accompanied by changes in rotational energy also.

<span class="mw-page-title-main">Iron(I) hydride</span> Chemical compound

Iron(I) hydride, systematically named iron hydride and poly(hydridoiron) is a solid inorganic compound with the chemical formula (FeH)
n
(also written ([FeH])
n
or FeH). It is both thermodynamically and kinetically unstable toward decomposition at ambient temperature, and as such, little is known about its bulk properties.

In spectroscopy, collision-induced absorption and emission refers to spectral features generated by inelastic collisions of molecules in a gas. Such inelastic collisions may induce quantum transitions in the molecules, or the molecules may form transient supramolecular complexes with spectral features different from the underlying molecules. Collision-induced absorption and emission is particularly important in dense gases, such as hydrogen and helium clouds found in astronomical systems.

References

  1. John Bertie. "John Bertie's Download Site - Spectra" . Retrieved August 8, 2012.
  2. Bertie J. E.; Lan Z. (1996). "Infrared Intensities of Liquids XX: The Intensity of the OH Stretching Band of Liquid Water Revisited, and the Best Current Values of the Optical Constants of H2O(l) at 25°C between 15,000 and 1 cm−1". Applied Spectroscopy. 50 (8): 1047–1057. Bibcode:1996ApSpe..50.1047B. doi:10.1366/0003702963905385. S2CID   97329854 . Retrieved 2012-08-08.
  3. Data of Bertie JE and Lan 1996. In: Miroslaw Jonasz , Top. Part. Disp. Sci. 2007 978-0-9780628-0-4
  4. 1 2 "Spectroscopy of Atmospheric Gases (spectral databases)". V.E. Zuev Institute of Atmospheric Optics SB RAS. Archived from the original on April 16, 2013. Retrieved August 8, 2012. ... various data sources: HITRAN and GEISA spectral databanks, original data obtained by IAO researchers in collaboration with other scientists, H2O spectra simulated by Partridge and Schwenke etc...
  5. 1 2 3 "The HITRAN Database". Atomic and Molecular Physics Division, Harvard-Smithsonian Center for Astrophysics. Retrieved August 8, 2012. HITRAN is a compilation of spectroscopic parameters that a variety of computer codes use to predict and simulate the transmission and emission of light in the atmosphere.
  6. 1 2 3 "Hitran on the Web Information System". Harvard-Smithsonian Center for Astrophysics (CFA), Cambridge, MA, USA; V.E. Zuev Institute of Atmosperic Optics (IAO), Tomsk, Russia. Retrieved August 11, 2012.
  7. Aringer B.; Kerschbaum F.; Jørgensen U. G. (2002). "H2O in stellar atmospheres" (PDF). Astronomy and Astrophysics. 395 (3): 915–927. Bibcode:2002A&A...395..915A. doi: 10.1051/0004-6361:20021313 . Retrieved 2012-08-08.
  8. Richard Brandt. "Optical constants of ice from the ultraviolet to the microwave".
  9. Warren S. G. (1984). "Optical constants of ice from the ultraviolet to the microwave" (PDF). Applied Optics. 23 (8): 1206. Bibcode:1984ApOpt..23.1206W. doi:10.1364/AO.23.001206. PMID   18204705 . Retrieved 2012-08-08.
  10. Warren S. G.; Brandt R. E. (2008). "Optical constants of ice from the ultraviolet to the microwave: A revised compilation" (PDF). J. Geophys. Res. 113 (D14): D14220. Bibcode:2008JGRD..11314220W. doi: 10.1029/2007JD009744 . Retrieved 2012-08-08.
  11. 1 2 3 4 Wozniak B.; Dera J. (2007). Atmospheric and Oceanographic Sciences Library (PDF). New York: Springer Science+Business Media. LLC. ISBN   978-0-387-30753-4 . Retrieved August 4, 2012.
  12. 1 2 Gordon, Iouli E.; Laurence S. Rothman; Robert R. Gamache; David Jacquemart; Chris Boone; Peter F. Bernathd; Mark W. Shephard; Jennifer S. Delamere; Shepard A. Clough (2007-06-24). "Current updates of the water-vapor line list in HITRAN: A new Diet for air-broadened half-widths" (PDF). Journal of Quantitative Spectroscopy & Radiative Transfer. Retrieved 2007-11-03. Water vapor is the principal absorber of longwave radiation in the terrestrial atmosphere and it has a profound effect on the atmospheric energy budget in many spectral regions. The HITRAN database lists more than 64,000 significant transitions of water vapor ranging from the microwave region to the visible, with intensities that cover many orders of magnitude. These transitions are used, or have to be accounted for, in various remote-sensing applications.
  13. Banwell, Colin N.; McCash, Elaine M. (1994). Fundamentals of molecular spectroscopy (4th ed.). McGraw-Hill. p. 50. ISBN   978-0-07-707976-5.
  14. 1 2 3 Nakamoto, Kazuo (1997). Infrared and Raman spectra of inorganic and coordination compounds (5th ed.). Wiley. p. 170. ISBN   978-0-47116394-7.
  15. 1 2 Jacquemoud, S.; Ustin, S.L. (2003). "Application of radiative transfer models to moisture content estimation and burned land mapping" (PDF). Joint European Association of Remote Sensing Laboratories (EARSeL) and GOFC/GOLD-Fire Program, 4th Workshop on Forest Fires, Ghent University, Belgium 5--7 June 2003. Retrieved 2008-10-15. ...in the action spectrum of water the three main peaks near 1400, 1950, and 2500 nm, and two minor ones at 970 and 1200 nm
  16. 1 2 3 4 5 Pope R. M.; Fry E. S. (1997). "Absorption spectrum (380–700 nm) of pure water. II. Integrating cavity measurements". Applied Optics. 36 (33): 8710–8723. Bibcode:1997ApOpt..36.8710P. doi:10.1364/AO.36.008710. PMID   18264420. S2CID   11061625.
  17. Duarte, F. J., ed. (1995). Tunable Laser Applications. New York: M. Dekker. ISBN   978-0-8247-8928-2. There are three sets of water-vapor absorption lines in the near-IR spectral region. Those near 730 and 820 nm are useful for lower tropo- spheric measurements, whereas those near 930 nm are useful for upper- tropospheric measurements...
  18. Chaplin, Martin (2007-10-28). "Water Absorption Spectrum". Archived from the original on 2020-11-11. Retrieved 2007-11-04. In the liquid, rotations tend to be restricted by hydrogen bonds, giving the librations. Also, spectral lines are broader causing overlap of many of the absorption peaks. The main stretching band in liquid water is shifted to a lower frequency and the bending frequency increased by hydrogen bonding.
  19. Carter, G.A.; McCain, D.C. (1993). "Relationship of leaf spectral reflectance to chloroplast water content determined using NMR microscopy". Remote Sensing of Environment. 46 (3): 305–310. Bibcode:1993RSEnv..46..305C. doi:10.1016/0034-4257(93)90050-8. Archived from the original on 2019-12-13. Retrieved 2007-10-31. Reflectance responses to leaf water content were greatest in the water absorption bands near 1450 nm, 1950 nm, and 2500 nm wavelengths
  20. Rossel, R.A.V.; McBratney, A.B. (1998). "Laboratory evaluation of a proximal sensing technique for simultaneous measurement of soil clay and water content". Geoderma. 85 (1): 19–39. Bibcode:1998Geode..85...19V. doi:10.1016/S0016-7061(98)00023-8. the strong absorption bands of OH groups in soil water at around 1450, 1950 and 2500 nm.
  21. 1 2 Kou L.; Labrie D.; Chýlek P. (1993). "Refractive indices of water and ice the 0.65- to 2.5-μm spectral range". Applied Optics. 32 (19): 3531–3540. Bibcode:1993ApOpt..32.3531K. doi:10.1364/AO.32.003531. PMID   20829977.
  22. 1 2 Data of Pope RM and Fry 1997 and of Kou L et al. 1993. In: Miroslaw Jonasz , Top. Part. Disp. Sci. 2007 978-0-9780628-0-4
  23. Chaplin, Martin. "Water and Microwaves". Water Structure and Science. Archived from the original on 2020-11-11.
  24. Kaatze, G.A.; Behrends, R.; Pottel, R. (2002). "Hydrogen network fluctuations and dielectric spectrometry of liquids". J. Non-Cryst. Solids. 305 (1–3): 19–29. Bibcode:2002JNCS..305...19K. doi:10.1016/S0022-3093(02)01084-0.
  25. 1 2 Maurellis, Ahilleas (2003-05-01). "The climatic effects of water vapour - physicsworld.com". Physics World . Institute of Physics . Retrieved 2019-02-18.
  26. "South Pole Telescope: South Pole : Why is the telescope at the South Pole?". University of Chicago. Archived from the original on 2007-10-15. Retrieved 2007-11-03. Quick Answer: Because the South Pole is probably the best place on Earth for this telescope. It is extremely dry, making the atmosphere exceptionally transparent for SPT.
  27. Prieto-Blanco, Ana; Peter R. J. North; Nigel Fox; Michael J. Barnsley. "Satellite estimation of surface/atmosphere parameters: a sensitivity study" (PDF). Archived from the original (PDF) on 2011-07-26. Retrieved 2007-10-31. ...water absorption bands (around 940nm, 1100nm, 1450nm, 1950nm and 2500nm) and carbon dioxide absorption bands (1400nm, 1600nm and 2000nm)...
  28. "EO Study: Does the Earth have an Iris Analog". NASA. 2002-06-17. Retrieved 2007-11-04.
  29. Cotton, William (2006). Human Impacts on Weather and Climate. Cambridge: Cambridge University Press. ISBN   978-0-521-84086-6. Little absorption is evident in the region called the atmospheric window between 8 and 14 μm