List of U.S. cities with large Black populations

Last updated
Proportion of Black Americans in each county of the fifty states, the District of Columbia, and Puerto Rico as of the 2020 United States Census Black Americans by county.png
Proportion of Black Americans in each county of the fifty states, the District of Columbia, and Puerto Rico as of the 2020 United States Census

This list of U.S. cities by black population covers all incorporated cities and Census-designated places with a population over 100,000 and a proportion of black residents over 30% in the 50 U.S. states, the District of Columbia, and the territory of Puerto Rico and the population in each city that is black or African American.

Contents

The data source for the list is the 2020 United States Census. [1]

At the time of the 2020 Census, there were 47.5 million Americans who were black (either alone or in combination), making up 14.2% of the U.S. population. State by state, the highest number of black Americans could be found in Texas (3.96 million), Florida (3.70 million), Georgia (3.54 million), New York (3.53 million), and California (2.83 million). Meanwhile, the highest proportions of African Americans were in the District of Columbia (44.17%), Mississippi (37.94%), Louisiana (33.13%), Georgia (33.03%), and Maryland (32.01%).[ citation needed ]

Throughout the country, there are 342 cities with a population over 100,000. 19 of them had black (alone or in combination) majorities, and in 46 more cities, between 30% and 50% of the population identified as black. Out of the 19 majority-black cities, four were in Georgia and Louisiana and Alabama had three each. Meanwhile, the states of Florida, Ohio, Michigan, New Jersey, Texas, Virginia, Tennessee, Massachusetts, Maryland, and Mississippi each had one majority-black city.[ citation needed ]

In 2020, the largest cities which had a black majority were Detroit, Michigan (population 639K), Memphis, Tennessee (population 633K), Baltimore, Maryland (population 586K), New Orleans, Louisiana (population 384K), and Cleveland, Ohio (population 373K).[ citation needed ]

List

The list below displays each city (or city-equivalent) in the fifty states, the District of Columbia, and Puerto Rico with a population over 100,000 and a Black proportion over 30% as of the 2020 Census. It includes the city's total population, the number of Black people in the city, and the percentage of people in the city who are Black as of the 2020 Census. The table is initially sorted by the Black proportion of each city but is sortable by any of its columns, as can be found by clicking the table headers.

Cities where people who are Black alone are not at least 30% of the population, while people who are either Black alone, or, in combination with another race, do form at least 30% of the population, are italicized. [nb 1]

CityStateBlack %Black alone %PopulationBlack
population
Black alone
population
South Fulton Flag of Georgia (U.S. state).svg  Georgia 93.26%90.53%107,436100,19097,259
Jackson Flag of Mississippi.svg  Mississippi 80.45%78.86%153,701123,656121,215
Detroit Flag of Michigan.svg  Michigan 80.38%77.69%639,111513,697496,534
Birmingham Flag of Alabama.svg  Alabama 69.82%68.40%200,733140,156137,296
Miami Gardens Flag of Florida.svg  Florida 66.97%63.50%111,64074,76170,886
Memphis Flag of Tennessee.svg  Tennessee 63.34%61.57%633,104401,033389,779
Montgomery Flag of Alabama.svg  Alabama 61.91%60.29%200,603124,187120,950
Baltimore Flag of Maryland.svg  Maryland 60.42%57.79%585,708353,890338,478
Augusta Flag of Georgia (U.S. state).svg  Georgia 58.61%55.81%202,081118,441112,773
Shreveport Flag of Louisiana.svg  Louisiana 57.82%56.02%187,593108,474105,088
New Orleans Flag of Louisiana.svg  Louisiana 57.02%54.24%383,997218,969208,273
Macon Flag of Georgia (U.S. state).svg  Georgia 56.48%54.58%157,34688,86585,885
Baton Rouge Flag of Louisiana.svg  Louisiana 55.43%53.84%227,470126,097122,461
Hampton Flag of Virginia.svg  Virginia 53.65%49.52%137,14873,57967,915
Newark Flag of New Jersey.svg  New Jersey 53.22%49.45%311,549165,802154,048
Mobile Flag of Alabama.svg  Alabama 53.04%51.35%187,04199,19896,039
Cleveland Flag of Ohio.svg  Ohio 51.59%48.37%372,624192,239180,224
Brockton Flag of Massachusetts.svg  Massachusetts 51.42%34.98%105,64354,32036,951
Savannah Flag of Georgia (U.S. state).svg  Georgia 51.41%49.14%147,78075,97972,618
Atlanta Flag of Georgia (U.S. state).svg  Georgia 49.51%47.22%498,715246,906235,513
Columbus Flag of Georgia (U.S. state).svg  Georgia 49.40%46.47%206,922102,21296,163
Beaumont Flag of Texas.svg  Texas 49.15%47.32%115,28256,66654,549
Fayetteville Flag of North Carolina.svg  North Carolina 47.58%42.99%208,50199,20889,645
Miramar Flag of Florida.svg  Florida 46.43%42.39%134,72162,55357,109
Newport News Flag of Virginia.svg  Virginia 46.35%42.25%186,24786,33078,687
St. Louis Flag of Missouri.svg  Missouri 45.45%43.04%301,578137,059129,814
Greensboro Flag of North Carolina.svg  North Carolina 44.83%41.99%299,035134,071125,574
Rochester Flag of New York.svg  New York 44.55%40.10%211,32894,14284,752
Washington Flag of Washington, D.C.svg  District of Columbia 44.17%41.45%689,545304,539285,810
Dayton Flag of Ohio.svg  Ohio 43.90%40.67%137,64460,43255,981
Norfolk Flag of Virginia.svg  Virginia 43.55%40.16%238,005103,65795,594
Killeen Flag of Texas.svg  Texas 43.47%37.27%153,09566,55657,055
Cincinnati Flag of Ohio.svg  Ohio 43.35%40.55%309,317134,092125,443
North Charleston Flag of South Carolina.svg  South Carolina 42.99%40.64%114,85249,37146,673
Richmond Flag of Virginia.svg  Virginia 42.91%40.45%226,61097,24091,653
Little Rock Flag of Arkansas.svg  Arkansas 42.35%40.64%202,59185,79082,340
Hartford Flag of Connecticut.svg  Connecticut 42.32%38.19%121,05451,23646,231
Inglewood Flag of California.svg  California 42.24%38.70%107,76245,52341,708
Philadelphia Flag of Pennsylvania.svg  Pennsylvania 42.01%39.31%1,603,797673,785630,462
Milwaukee Flag of Wisconsin.svg  Wisconsin 41.50%38.59%577,222239,542222,746
Columbia Flag of South Carolina.svg  South Carolina 40.36%38.50%136,63255,14052,598
Buffalo Flag of New York.svg  New York 40.16%36.87%278,349111,796102,636
Bridgeport Flag of Connecticut.svg  Connecticut 38.59%35.07%148,65457,37252,138
Durham Flag of North Carolina.svg  North Carolina 38.59%36.24%283,506109,411102,742
Tallahassee Flag of Florida.svg  Florida 37.22%35.02%196,16973,00768,691
New Haven Flag of Connecticut.svg  Connecticut 35.82%32.20%134,02348,00143,160
Charlotte Flag of North Carolina.svg  North Carolina 35.39%33.05%874,579309,487289,062
Syracuse Flag of New York.svg  New York 35.37%30.67%148,62052,57345,588
Winston-Salem Flag of North Carolina.svg  North Carolina 34.98%32.52%249,54587,28681,148
Akron Flag of Ohio.svg  Ohio 34.94%31.41%190,46966,55559,821
High Point Flag of North Carolina.svg  North Carolina 34.35%32.10%114,05939,18336,610
West Palm Beach Flag of Florida.svg  Florida 34.13%31.65%117,41540,07537,160
Jacksonville Flag of Florida.svg  Florida 33.20%30.57%949,611315,281290,279
Toledo Flag of Ohio.svg  Ohio 32.67%28.76%270,87188,50377,897
Lafayette Flag of Louisiana.svg  Louisiana 32.42%30.70%121,37439,35437,259
Columbus Flag of Ohio.svg  Ohio 31.77%28.65%905,748287,735259,483
Chesapeake Flag of Virginia.svg  Virginia 31.68%28.97%249,42279,01372,268
Huntsville Flag of Alabama.svg  Alabama 31.45%29.34%215,00667,62663,085
Columbia Flag of Maryland.svg  Maryland 31.25%27.65%104,68132,71828,941
Peoria Flag of Illinois.svg  Illinois 31.13%27.86%113,15035,22831,527
Chattanooga Flag of Tennessee.svg  Tennessee 30.89%29.09%181,09955,95052,690
Chicago Flag of Illinois.svg  Illinois 30.79%29.17%2,746,388845,638801,195
Roanoke Flag of Virginia.svg  Virginia 30.76%27.47%100,01130,76427,470
Pompano Flag of Florida.svg  Florida 30.71%28.55%112,04634,41031,994
Indianapolis Flag of Indiana.svg  Indiana 30.55%27.95%887,642271,214248,067

See also

Notes

  1. The United States Census Bureau uses the term race alone for people who answered the question on race by indicating only one race. The census uses the term race in combination for people who reported belonging to more than one race group. [2]

Related Research Articles

<span class="mw-page-title-main">Demographics of the United States</span>

The United States had an official estimated resident population of 334,914,895 on July 1, 2023, according to the U.S. Census Bureau. This figure includes the 50 states and the District of Columbia but excludes the population of five unincorporated U.S. territories as well as several minor island possessions. The United States is the third most populous country in the world, and the most populous in the Americas and the Western Hemisphere. The Census Bureau showed a population increase of 0.4% for the twelve-month period ending in July 2022, below the world average annual rate of 0.9%. The total fertility rate in the United States estimated for 2022 is 1.665 children per woman, which is below the replacement fertility rate of approximately 2.1.

<span class="mw-page-title-main">Great Migration (African American)</span> African American migration from Southern US between 1916 and 1970

The Great Migration, sometimes known as the Great Northward Migration or the Black Migration, was the movement of six million African Americans out of the rural Southern United States to the urban Northeast, Midwest, and West between 1910 and 1970. It was substantially caused by poor economic and social conditions due to prevalent racial segregation and discrimination in the Southern states where Jim Crow laws were upheld. In particular, continued lynchings motivated a portion of the migrants, as African Americans searched for social reprieve. The historic change brought by the migration was amplified because the migrants, for the most part, moved to the then-largest cities in the United States at a time when those cities had a central cultural, social, political, and economic influence over the United States; there, African-Americans established culturally influential communities of their own. According to Isabel Wilkerson, despite the loss of leaving their homes in the South, and the barriers faced by the migrants in their new homes, the migration was an act of individual and collective agency, which changed the course of American history, a "declaration of independence" written by their actions.

<span class="mw-page-title-main">Deep South</span> Cultural region of the United States

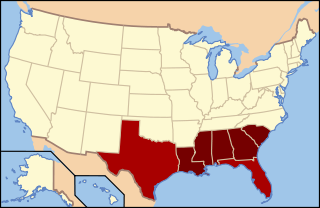
The Deep South or the Lower South is a cultural and geographic subregion of the Southern United States. The term was first used to describe the states which were most economically dependent on plantations and slavery. After the American Civil War ended in 1865, the region suffered economic hardship and was a major site of racial tension during and after the Reconstruction era. Before 1945, the Deep South was often referred to as the "Cotton States" since cotton was the primary cash crop for economic production. The civil rights movement in the 1950s and 1960s helped usher in a new era, sometimes referred to as the New South. The Deep South is part of the highly-religious, socially conservative Bible Belt and is currently a Republican Party stronghold.

<span class="mw-page-title-main">Eastern United States</span> Geographic region

The Eastern United States, often abbreviated as simply the East, is a macroregion of the United States located to the east of the Mississippi River. It includes 26 states and Washington, D.C., the national capital.

<span class="mw-page-title-main">Demographics of Atlanta</span> Demography and population statistics of Atlanta, Georgia

Atlanta is the capital and largest city in the state of Georgia. Atlanta ranks as the 38th-largest in the United States, and the eighth-largest city in the southeastern region. 2020 census results varied dramatically with previous Census Bureau estimates, counting 498,715 residents. Atlanta is the core city of the eighth most populous United States metropolitan area at 6,104,803, with a combined statistical area of 6,930,423. For the first time since the 1960 Census, the 2020 Census revealed Atlanta is no longer majority African American. Atlanta has strongly increased in diversity in recent decades and is projected to continue.

<span class="mw-page-title-main">Majority minority in the United States</span> Places with less than 50% non-Hispanic white population

In the United States of America, majority-minority area or minority-majority area is a term describing a U.S. state or jurisdiction whose population is composed of less than 50% non-Hispanic whites. Racial data is derived from self-identification questions on the U.S. census and on U.S. Census Bureau estimates.. The term is often used in voting rights law to designate voting districts that are designed under the Voting Rights Act to enable ethnic or language minorities "the opportunity to elect their candidate of choice." In that context, the term was first used by the Supreme Court in 1977. The Court had previously used the term in employment discrimination and labor relations cases.

<span class="mw-page-title-main">White Americans</span> People of the United States who are considered or consider themselves White

White Americans are Americans who identify as white people. This group constitutes the majority of the people in the United States. According to the 2020 census, 71%, or 235,411,507 people, were White alone or in combination, and 61.6%, or 204,277,273 people, were White alone. This represented a national white demographic decline from a 72.4% white alone share of the U.S. population in 2010.

<span class="mw-page-title-main">Race and ethnicity in the United States</span>

The United States has a racially and ethnically diverse population. At the federal level, race and ethnicity have been categorized separately. The most recent United States census recognized five racial categories, as well as people who belong to two or more of the racial categories. The United States also recognizes the broader notion of ethnicity. The 2000 census and 2010 American Community Survey inquired about the "ancestry" of residents, while the 2020 census allowed people to enter their "origins". The Census Bureau also classified respondents as either Hispanic or Latino, identifying as an ethnicity, which comprises the minority group in the nation.

<span class="mw-page-title-main">Demographics of Asian Americans</span> Demographics of Asian Americans

The demographics of Asian Americans describe a heterogeneous group of people in the United States who trace their ancestry to one or more Asian countries.

<span class="mw-page-title-main">West Indian Americans</span> Americans of West Indian (Caribbean) birth or descent

Caribbean Americans or West Indian Americans are Americans who trace their ancestry to the Caribbean. Caribbean Americans are a multi-ethnic and multi-racial group that trace their ancestry further in time mostly to Africa, as well as Asia, the Indigenous peoples of the Americas, and to Europe. As of 2016, about 13 million — about 4% of the total U.S. population — have Caribbean ancestry.

<span class="mw-page-title-main">Black flight</span> Demographic concept in the United States

Black flight is a term applied to the migration of African Americans from predominantly black or mixed inner-city areas in the United States to suburbs and newly constructed homes on the outer edges of cities. While more attention has been paid to this since the 1990s, the movement of black people to the suburbs has been underway for some time, with nine million people having migrated from 1960 to 2000. Their goals have been similar to those of the white middle class, whose out-migration was called white flight: newer housing, better schools for their children, and attractive environments. From 1990 to 2000, the percentage of African Americans who lived in the suburbs increased to a total of 39 percent, rising 5 percentage points in that decade. Most who moved to the suburbs after World War II were middle class.

The District of Columbia is a federal district with an ethnically diverse population. In 2020, the District had a population of 689,545 people, with a resident density of 11,515 people per square mile.

<span class="mw-page-title-main">Demographics of Georgia (U.S. state)</span>

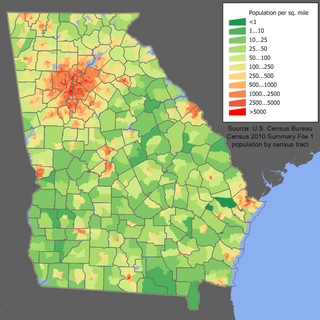
Georgia is a South Atlantic U.S. state with a population of 10,711,908 according to the 2020 United States census, or just over 3% of the U.S. population. The majority of the state's population is concentrated within Metro Atlanta, although other highly populated regions include: West Central and East Central Georgia; West, Central, and East Georgia; and Coastal Georgia; and their Athens, Columbus, Macon and Warner Robins, Augusta, Savannah, Hinesville, and Brunswick metropolitan statistical areas.

The racial and ethnic demographics of the United States have changed dramatically throughout its history.

<span class="mw-page-title-main">Black Southerners</span> African Americans living in the Southern United States

Black Southerners are African Americans living in the Southern United States, the United States region with the largest black population.

References

  1. "2020 Census". 2020 Census. United States Census Bureau. Retrieved 24 September 2021.
  2. "Glossary: Race alone". United States Census Bureau . United States Government.