List of countries by garlic production

Last updated

Countries by garlic production in 2020 Countries by garlic production in 2020.png
Countries by garlic production in 2020

This is a list of countries by garlic production from 2016 to 2020, based on data from the Food and Agriculture Organization Corporate Statistical Database. [1] The total world production for garlic in 2020 was 28,054,318 metric tonnes, up slightly from 28,042,647 tonnes in 2019. [n 1] China was by far the largest producer, accounting for nearly 80% of world production at 20,712,087 tonnes.

Contents

Production by country

>100,000 tons

RankCountry/region20202019201820172016
1Flag of the People's Republic of China.svg  China 20,712,08720,604,48020,879,16920,652,61220,281,659
2Flag of India.svg  India 2,917,0002,910,0001,611,0001,693,0001,617,000
3Flag of Bangladesh.svg  Bangladesh 485,447466,389461,970425,401381,851
4Flag of South Korea.svg  South Korea 363,432387,671331,741303,578275,549
5Flag of Egypt.svg  Egypt 333,543363,460348,700289,766272,769
6Flag of Spain.svg  Spain 269,090271,350273,480274,712209,795
7Flag of Uzbekistan.svg  Uzbekistan 223,719216,272254,857214,263200,869
8Flag of Ukraine.svg  Ukraine 211,680215,070187,020185,830187,960
9Flag of Myanmar.svg  Myanmar 211,138208,908203,432203,681212,909
10Flag of Russia.svg  Russia 189,659202,064211,981206,074202,992
11Flag of the United States.svg  United States 175,674194,497260,340232,010204,780
12Flag of Algeria.svg  Algeria 170,930223,311202,201123,475103,627
13Flag of Brazil.svg  Brazil 155,700130,900118,869120,896132,361
14Flag of Argentina.svg  Argentina 146,608146,288145,969147,814148,851
15Flag of Ethiopia.svg  Ethiopia 114,945152,595195,740178,222138,664

10,000–100,000 tonnes

RankCountry/region20202019201820172016
16Flag of Peru.svg  Peru 90,61282,991104,70394,88778,205
17Flag of Mexico.svg  Mexico 86,68882,91094,69289,84075,987
18Flag of Pakistan.svg  Pakistan 85,64275,34281,16775,00270,925
19Flag of Indonesia.svg  Indonesia 81,80588,81739,30219,51321,150
20Flag of North Korea.svg  North Korea 76,86777,12076,31277,17077,878
21Flag of Thailand.svg  Thailand 76,83984,03990,98269,18067,554
22Flag of Nepal.svg    Nepal 73,85971,90259,50056,66850,426
23Flag of Kyrgyzstan (2023).svg  Kyrgyzstan 68,35069,20155,52352,67042,666
24Flag of Iran.svg  Iran 58,94158,65458,36759,35559,169
25Flag of Kazakhstan.svg  Kazakhstan 49,22249,12544,88138,83133,481
26Flag of the Republic of China.svg  Taiwan 44,94747,46460,07543,73844,497
27Flag of Sudan.svg  Sudan 43,91843,34110,98718,10834,745
28Flag of Guatemala.svg  Guatemala 29,88230,21530,01329,41731,216
29Flag of Turkey.svg  Turkey 28,55223,35125,51926,328135,148
30Flag of Italy.svg  Italy 27,97029,27030,50029,98329,568
31Flag of Romania.svg  Romania 27,59027,70030,57055,67354,389
32Flag of Azerbaijan.svg  Azerbaijan 26,21439,11844,91421,54121,114
33Flag of Tunisia.svg  Tunisia 25,22325,10125,35225,21424,736
34Flag of Syria.svg  Syria 23,69321,98812,78014,76313,532
35Flag of Chile.svg  Chile 23,44718,50320,80320,16515,692
36Flag of France.svg  France 22,43028,14020,12020,46421,932
37Flag of Belarus.svg  Belarus 21,62619,53018,10638,66633,533
38Flag of Japan.svg  Japan 20,89320,80020,20020,70021,100
39Flag of Albania.svg  Albania 20,72215,05613,69614,54412,308
40Flag of Mali.svg  Mali 14,94514,95614,92113,1999,955
41Flag of Tajikistan.svg  Tajikistan 14,15816,45915,6435,8963,255
42Flag of Poland.svg  Poland 13,50015,10015,830N/AN/A
43Flag of Portugal.svg  Portugal 12,2504102,0402,6602,622
44Flag of Cuba.svg  Cuba 12,09414,98817,32019,46223,257
45Flag of Morocco.svg  Morocco 11,95310,31913,61113,66012,562
46Flag of Niger.svg  Niger 11,2387,4494,9374,2603,761
47Flag of Venezuela.svg  Venezuela 11,06212,11314,89514,59913,906
48Flag of Colombia.svg  Colombia 10,4299,27210,1756,71714,207

1,000–10,000 tonnes

RankCountry/region20202019201820172016
49Flag of Armenia.svg  Armenia 8,63310,08110,49012,61014,207
50Flag of Greece.svg  Greece 7,7704,3906,1307,8827,135
51Flag of Moldova.svg  Moldova 7,3827,1249,51011,52210,166
52Flag of the Philippines.svg  Philippines 6,7677,2567,5597,7517,469
53Flag of Tanzania.svg  Tanzania 6,2506,2356,0476,4686,190
54Flag of Bosnia and Herzegovina.svg  Bosnia and Herzegovina 6,1865,6415,8905,5607,259
55Flag of Hungary.svg  Hungary 5,2107,1207,9307,4307,899
56Flag of Oman.svg  Oman 5,1032,5012,4772,9152,914
57Flag of North Macedonia.svg  North Macedonia 4,9044,5154,1344,2144,221
58Flag of Libya.svg  Libya 4,6954,6584,6204,5784,578
59Flag of Iraq.svg  Iraq 4,1823,9861,8101,7252,760
60Flag of Kenya.svg  Kenya 3,8602,1751,7262,4932,372
61Flag of Yemen.svg  Yemen 3,2893,2963,2313,2923,339
62Flag of Serbia.svg  Serbia 3,1763,0923,6155,0254,803
63Flag of Turkmenistan.svg  Turkmenistan 3,1123,1023,1313,1023,072
64Flag of Lebanon.svg  Lebanon 2,8572,5424,4565,0001,086
65Flag of Georgia.svg  Georgia 2,7002,1004,6003,5002,900
66Flag of Madagascar.svg  Madagascar 2,6772,6652,7062,6592,632
67Flag of the Netherlands.svg  Netherlands 2,5402,4702,39000
68Bandera de Bolivia (Estado).svg  Bolivia 2,4762,2302,5692,7773,731
69Flag of Jordan.svg  Jordan 2,3162,5063,6892,5892,267
70Flag of the Dominican Republic.svg  Dominican Republic 2,2761,9511,5171,5242,368
71Flag of Nigeria.svg  Nigeria 2,2191,2781,8002,3002,300
72Flag of the Czech Republic.svg  Czech Republic 2,0201,6401,6901,340835
73Flag of Croatia.svg  Croatia 1,9702,8801,7301,9011,444
74Flag of New Zealand.svg  New Zealand 1,8811,8751,8891,8791,857
75Flag of Bulgaria.svg  Bulgaria 1,6002,2201,7701859
75Flag of Latvia.svg  Latvia 1,6001,3804001,884610
77Flag of Austria.svg  Austria 1,3201,2101,1201,0911,025
78Flag of Ecuador.svg  Ecuador 1,2851,2751,3081,2711,246
79Flag of Canada (Pantone).svg  Canada 1,2561,2481,4901,5631,410
80Flag of Israel.svg  Israel 1,1691,4491,3611,4862,183
81Flag of Slovenia.svg  Slovenia 1,0901,0601,0201,0031,089
82Flag of Palestine.svg  Palestine 1,0571,0751,0931,0511,098
83Flag of Malawi.svg  Malawi 1,035645521230N/A
84Flag of Lithuania.svg  Lithuania 1,0209708609701,622
85Flag of Haiti.svg  Haiti 1,0039981,0121,000983

<1,000 tonnes

RankCountry/region20202019201820172016
86Flag of Montenegro.svg  Montenegro 927923930927913
87Flag of Uruguay.svg  Uruguay 9149001,1781,000800
88Flag of Slovakia.svg  Slovakia 890590320231313
89Flag of Bhutan.svg  Bhutan 6917615507081,176
90Flag of Malta.svg  Malta 540540580358479
91Flag of Kuwait.svg  Kuwait 487623432280351
92Flag of East Timor.svg  East Timor 393395392394399
93Flag of Paraguay.svg  Paraguay 236234230230225
94Flag of Estonia.svg  Estonia 210130130356185
95Flag of Zimbabwe.svg  Zimbabwe 207206207206205
96Flag of Honduras.svg  Honduras 197196198197194
97Flag of Switzerland (Pantone).svg   Switzerland 17358514234
98Flag of Sweden.svg  Sweden 1205040N/AN/A
99Flag of Finland.svg  Finland 110701075141
100Flag of Cape Verde.svg  Cape Verde 8585838587
101Flag of Mauritius.svg  Mauritius 39487196120

Notes

  1. Sum of values for countries with available data, which may be official or FAO data based on imputation methodology

Related Research Articles

<span class="mw-page-title-main">Economy of Qatar</span>

The Economy of Qatar is one of the highest in the world based on GDP per capita, ranking generally among the top ten richest countries on world rankings for 2015 and 2016 data compiled by the World Bank, the United Nations, and the International Monetary Fund (IMF). The country's economy has grown despite sanctions by its neighbors, Saudi Arabia and the United Arab Emirates. Mainly because the country exports primarily to Japan, South Korea, India and China, making the sanctions effectively redundant as neither Saudi Arabia nor the United Arab Emirates have imposed trading penalties such as tariffs or embargoes on either of these countries for trading with Qatar, or offering incentives such as discounts for their own energy exports to reduce Qatari exports.

<span class="mw-page-title-main">World economy</span> Economy of the world

The world economy or global economy is the economy of all humans in the world, referring to the global economic system, which includes all economic activities conducted both within and between nations, including production, consumption, economic management, work in general, financial transactions and trade of goods and services. In some contexts, the two terms are distinct: the "international" or "global economy" is measured separately and distinguished from national economies, while the "world economy" is simply an aggregate of the separate countries' measurements. Beyond the minimum standard concerning value in production, use and exchange, the definitions, representations, models and valuations of the world economy vary widely. It is inseparable from the geography and ecology of planet Earth.

<span class="mw-page-title-main">Gold reserve</span> Financial concept

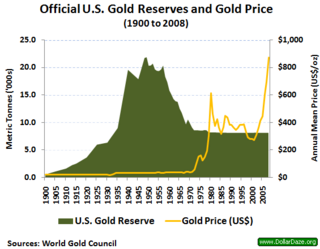
A gold reserve is the gold held by a national central bank, intended mainly as a guarantee to redeem promises to pay depositors, note holders, or trading peers, during the eras of the gold standard, and also as a store of value, or to support the value of the national currency.

<span class="mw-page-title-main">Garlic powder</span> Spice derived from dehydrated garlic

Garlic powder is a spice that is derived from dehydrated garlic and used in cooking for flavour enhancement. The process of making garlic powder includes drying and dehydrating the vegetable, then powdering it through machinery or home-based appliances depending on the scale of production. Garlic powder is a common component of spice mix. It is also a common component of seasoned salt.

<span class="mw-page-title-main">Agriculture in Argentina</span> Primary sector in Argentina

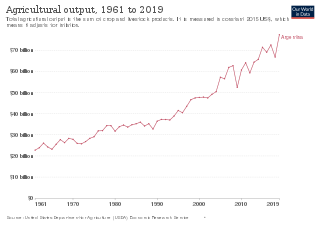
Agriculture is one of the bases of Argentina's economy.

<span class="mw-page-title-main">Greenhouse gas emissions</span> Sources and amounts of greenhouse gases emitted to the atmosphere from human activities

Greenhouse gas (GHG) emissions from human activities intensify the greenhouse effect. This contributes to climate change. Carbon dioxide, from burning fossil fuels such as coal, oil, and natural gas, is one of the most important factors in causing climate change. The largest emitters are China followed by the United States. The United States has higher emissions per capita. The main producers fueling the emissions globally are large oil and gas companies. Emissions from human activities have increased atmospheric carbon dioxide by about 50% over pre-industrial levels. The growing levels of emissions have varied, but have been consistent among all greenhouse gases. Emissions in the 2010s averaged 56 billion tons a year, higher than any decade before. Total cumulative emissions from 1870 to 2017 were 425±20 GtC from fossil fuels and industry, and 180±60 GtC from land use change. Land-use change, such as deforestation, caused about 31% of cumulative emissions over 1870–2017, coal 32%, oil 25%, and gas 10%.

<span class="mw-page-title-main">Fishing in India</span> Major industry employing 14.5 million people

Fishing in India is a major sector within the economy of India contributing 1.07% of its total GDP. The fishing sector in India supports the livelihood of over 28 million people in the country, especially within the marginalized and vulnerable communities. India is the third largest fish producing country in the world accounting for 7.96% of the global production and second largest producer of fish through aquaculture, after China. The total fish production during the FY 2020-21 is estimated at 14.73 million metric tonnes. According to the National Fisheries Development Board the Fisheries Industry generates an export earnings of Rs 334.41 billion. Centrally sponsored schemes will increase exports by Rs 1 lakh crore in FY25. 65,000 fishermen have been trained under these schemes from 2017 to 2020. Freshwater fishing consists of 55% of total fish production.

<span class="mw-page-title-main">Garlic production in China</span>

Garlic production in China is significant to the worldwide garlic industry, as China provides 80% of the total world production and is the leading exporter. Following China, other significant garlic producers include India and Bangladesh (1%). As of 2019, China produced 23 million tonnes annually.

<span class="mw-page-title-main">Sugar industry of India</span>

The first sugar mill in India was established in the year 1903 in Pratappur area of Deoria district.

<span class="mw-page-title-main">World energy supply and consumption</span> Global production and usage of energy

World energy supply and consumption refers to the global supply of energy resources and its consumption. Throughout its lifecycle, global energy supplies have multiple different stages such as initial production, refinement activities, trade of energy resources, and final consumption of the energy.

References

  1. "Crops". FAOSTAT. Retrieved 9 June 2022. Countries – Select All; Regions – World + (Total); Elements – Production Quantity; Items – Garlic; Years – 2020 + 2019 + 2018 + 2017 + 2016