List of countries by tomato production

Last updated

Countries by tomato production in 2017 Tomato production in 2017.png
Countries by tomato production in 2017

This is a list of countries by tomato production in 2016 and 2017, based on data from the Food and Agriculture Organization Corporate Statistical Database. [1] The estimated total world production for tomatoes in 2017 was 182,301,395 metric tonnes, an increase of 1.6% from 179,508,401 tonnes in 2016. [n 1] China was by far the largest producer, accounting for nearly 33% of global production. Dependent territories are shown in italics.

Contents

Production by country

>1,000,000 tonnes

RankCountry20172016
1Flag of the People's Republic of China.svg  China 59,514,77357,426,955
2Flag of India.svg  India 20,708,00017,732,000
3Flag of Turkey.svg  Turkey 12,750,00012,600,000
4Flag of the United States.svg  United States 10,910,99012,936,420
5Flag of Egypt.svg  Egypt 7,297,1087,320,714
6Flag of Iran.svg  Iran 6,177,2905,828,557
7Flag of Italy.svg  Italy 6,015,868
8Flag of Spain.svg  Spain 5,163,4665,233,542
9Flag of Mexico.svg  Mexico 4,243,0584,047,171
10Flag of Brazil.svg  Brazil 4,230,1504,167,629
11Flag of Nigeria.svg  Nigeria 4,100,0004,128,995
12Flag of Russia.svg  Russia 3,230,7182,986,209
13Flag of Uzbekistan.svg  Uzbekistan 2,455,1252,499,390
14Flag of Ukraine.svg  Ukraine 2,267,4602,229,690
15Flag of Portugal.svg  Portugal 1,747,6341,693,860
16Flag of Tunisia.svg  Tunisia 1,298,0001,333,000
17Flag of Morocco.svg  Morocco 1,293,7611,231,248
18Flag of Algeria.svg  Algeria 1,286,2861,280,570
19Flag of Cameroon.svg  Cameroon 1,279,8531,182,114

100,000–1,000,000 tonnes

RankCountry20172016
21Flag of Chile.svg  Chile 993,076910,310
22Flag of Indonesia.svg  Indonesia 962,856883,242
23Flag of the Netherlands.svg  Netherlands 910,000900,000
24Flag of Poland.svg  Poland 898,012866,980
25Flag of Greece.svg  Greece 879,0001,019,880
26Flag of Albania.svg  Albania 850,311997,552
27Flag of Jordan.svg  Jordan 787,141837,342
28Flag of Kazakhstan.svg  Kazakhstan 739,007705,550
29Flag of Japan.svg  Japan 737,200743,200
30Flag of Romania.svg  Romania 726,643627,177
31Flag of Colombia.svg  Colombia 714,314690,515
32Flag of Syria.svg  Syria 686,458715,000
33Flag of Argentina.svg  Argentina 660,753662,834
34Flag of France.svg  France 656,408640,940
35Flag of Sudan.svg  Sudan 650,001617,400
36Flag of Azerbaijan.svg  Azerbaijan 624,198502,769
37Flag of South Africa.svg  South Africa 608,306587,772
38Flag of Cuba.svg  Cuba 584,072481,470
39Flag of Tanzania.svg  Tanzania 565,441528,034
41Flag of Canada (Pantone).svg  Canada 492,394501,375
42Flag of Malawi.svg  Malawi 450,000483,740
43Flag of Turkmenistan.svg  Turkmenistan 439,039425,860
44Flag of Tajikistan.svg  Tajikistan 409,398361,531
45Flag of Bangladesh.svg  Bangladesh 388,725368,121
46Flag of Mozambique.svg  Mozambique 380,000374,000
47Flag of South Korea.svg  South Korea 374,677390,303
48Flag of Israel.svg  Israel 373,289385,550
49Flag of Ghana.svg  Ghana 371,811366,772
50Flag of Australia (converted).svg  Australia 371,578405,167
51Flag of Benin.svg  Benin 321,644335,412
52Flag of Guatemala.svg  Guatemala 308,865314,598
53Flag of Saudi Arabia.svg  Saudi Arabia 306,389305,203
54Flag of Lebanon.svg  Lebanon 291,839290,570
55Flag of Kosovo.svg  Kosovo 286,811447,552
56Flag of Kenya.svg  Kenya 283,000410,033
57Flag of Belarus.svg  Belarus 279,522282,625
58Flag of Niger.svg  Niger 263,394269,079
59Flag of Belgium (civil).svg  Belgium 255,960259,535
60Flag of Armenia.svg  Armenia 234,228298,140
61Flag of Kyrgyzstan.svg  Kyrgyzstan 228,952234,718
62Flag of Palestine.svg  Palestine 220,864220,344
63Flag of Peru.svg  Peru 220,618232,898
64Flag of the Philippines.svg  Philippines 218,793210,720
65Flag of Libya.svg  Libya 217,316216,153
66Flag of Hungary.svg  Hungary 211,068173,095
67Flag of the Dominican Republic.svg  Dominican Republic 195,410249,832
68Flag of Oman.svg  Oman 191,59789,086
69Flag of Malaysia.svg  Malaysia 188,185242,946
70Flag of Venezuela.svg  Venezuela 176,217162,140
71Flag of Mali.svg  Mali 175,577201,694
72Flag of Serbia.svg  Serbia 170,764160,456
73Flag of North Macedonia.svg  North Macedonia 159,721161,951
74Flag of Bulgaria.svg  Bulgaria 158,762141,367
75Flag of Honduras.svg  Honduras 157,472155,324
76Flag of Senegal.svg  Senegal 138,000102,000
77Flag of Iraq.svg  Iraq 123,611286,596
78Flag of Thailand.svg  Thailand 113,846107,582
79Flag of the Republic of China.svg  Taiwan 112,087118,958
80Flag of Kuwait.svg  Kuwait 104,04681,330

10,000–100,000 tonnes

RankCountry20172016
79Flag of Rwanda.svg  Rwanda 97,426118,774
80Flag of Germany.svg  Germany 96,56185,287
81Flag of the United Kingdom.svg  United Kingdom 90,62796,556
82Flag of Yemen.svg  Yemen 88,30396,768
83Flag of Sri Lanka.svg  Sri Lanka 80,83983,978
84Flag of Nicaragua.svg  Nicaragua 71,57774,269
85Flag of North Korea.svg  North Korea 66,28366,187
86Flag of Ecuador.svg  Ecuador 62,67555,550
87Flag of Moldova.svg  Moldova 62,00054,641
88Bandera de Bolivia (Estado).svg  Bolivia 59,09061,531
89Flag of Costa Rica.svg  Costa Rica 57,23857,238
90Flag of Paraguay.svg  Paraguay 55,70051,095
91Flag of Austria.svg  Austria 54,25855,068
92Flag of Georgia.svg  Georgia 49,90054,100
93Flag of the Democratic Republic of the Congo.svg  Democratic Republic of the Congo 49,35749,151
94Flag of Bosnia and Herzegovina.svg  Bosnia and Herzegovina 46,16657,070
95Flag of New Zealand.svg  New Zealand 46,04068,220
96Flag of Switzerland (Pantone).svg   Switzerland 42,53341,907
97Flag of Madagascar.svg  Madagascar 42,05841,574
98Flag of the United Arab Emirates.svg  United Arab Emirates 41,75243,791
99Flag of Ethiopia.svg  Ethiopia 41,33328,365
100Flag of Croatia.svg  Croatia 41,22330,707
101Flag of Uganda.svg  Uganda 40,12438,650
102Flag of Cote d'Ivoire.svg  Ivory Coast 40,00038,000
103Flag of Finland.svg  Finland 39,38640,621
104Flag of Uruguay.svg  Uruguay 36,00036,747
105Flag of Somalia.svg  Somalia 28,59427,321
106Flag of Guyana.svg  Guyana 28,47919,092
107Flag of Jamaica.svg  Jamaica 27,54531,427
108Flag of Zimbabwe.svg  Zimbabwe 26,61925,961
109Flag of Zambia.svg  Zambia 25,70025,693
110Flag of Slovakia.svg  Slovakia 21,96418,922
111Flag of El Salvador.svg  El Salvador 19,59118,114
112Flag of Sierra Leone.svg  Sierra Leone 18,51118,772
113Flag of Cyprus.svg  Cyprus 17,49713,364
114Flag of Cape Verde.svg  Cape Verde 16,81715,133
115Flag of Puerto Rico.svg  Puerto Rico 16,46817,858
116Flag of Angola.svg  Angola 16,34016,223
117Flag of Panama.svg  Panama 15,91615,495
118Flag of Sweden.svg  Sweden 14,45014,620
119Flag of Burkina Faso.svg  Burkina Faso 12,63512,561
120Flag of Lithuania.svg  Lithuania 11,97411,565
121Flag of Qatar.svg  Qatar 11,91912,694
122Flag of Malta.svg  Malta 10,90212,380
123Flag of Denmark.svg  Denmark 10,90010,580
124Flag of Mauritius.svg  Mauritius 10,65110,136
125Flag of Norway.svg  Norway 10,57311,141

1,000–10,000 tonnes

RankCountry20172016
126Flag of Namibia.svg  Namibia 9,5519,357
127Flag of Slovenia.svg  Slovenia 8,3968,652
128Flag of Eswatini.svg  Swaziland 5,6365,484
129Flag of Togo.svg  Togo 5,5645,584
130Flag of Botswana.svg  Botswana 5,5006,000
131Flag of France.svg  Guadeloupe 5,2425,155
132Flag of Latvia.svg  Latvia 5,0685,821
133Flag of France.svg  French Guiana 4,8614,800
134Flag of the Czech Republic.svg  Czech Republic 4,81914,350
135Flag of France.svg  Martinique 4,4764,465
136Flag of France.svg  Réunion 4,2634,493
137Flag of the Republic of the Congo.svg  Republic of the Congo 4,2504,149
138Flag of Bahrain.svg  Bahrain 4,2454,210
139Flag of the Bahamas.svg  Bahamas 4,1784,394
140Flag of Ireland.svg  Ireland 3,8004,000
141Flag of Estonia.svg  Estonia 3,5632,312
142Flag of Montenegro.svg  Montenegro 2,8754,464
143Flag of Liberia.svg  Liberia 2,8132,714
144Flag of Belize.svg  Belize 2,4522,858
145Flag of Haiti.svg  Haiti 2,3442,361
146Flag of Trinidad and Tobago.svg  Trinidad and Tobago 2,1032,280
147Flag of Djibouti.svg  Djibouti 1,7441,717
148Flag of Iceland.svg  Iceland 1,3341,436
149Flag of French Polynesia.svg  French Polynesia 1,3191,311
150Flag of Suriname.svg  Suriname 1,2391,500

<1,000 tonnes

RankCountry20172016
151Flag of Tonga.svg  Tonga 885861
152Flag of the Comoros.svg  Comoros 671665
153Flag of East Timor.svg  East Timor 587572
154Flag of Papua New Guinea.svg  Papua New Guinea 572564
155Flag of Antigua and Barbuda.svg  Antigua and Barbuda 526512
156Flag of Seychelles.svg  Seychelles 475459
157Flag of Gabon.svg  Gabon 412411
158Flag of Dominica.svg  Dominica 386376
159Flag of Bhutan.svg  Bhutan 383445
160Flag of Grenada.svg  Grenada 381364
161Flag of Fiji.svg  Fiji 374356
162Flag of Barbados.svg  Barbados 357308
163Flag of Guam.svg  Guam 320305
164Flag of Saint Lucia.svg  Saint Lucia 298295
165Flag of Maldives.svg  Maldives 294268
166Flag of the Cook Islands.svg  Cook Islands 274277
167Flag of Montserrat.svg  Montserrat 243237
168Flag of Saint Kitts and Nevis.svg  Saint Kitts and Nevis 187213
169Flag of Luxembourg.svg  Luxembourg 170170
170Flag of Brunei.svg  Brunei 146143
171Flag of Bermuda.svg  Bermuda 134134
172Flag of Singapore.svg  Singapore 8866
173Flag of American Samoa.svg  American Samoa 7071
174Flag of Hong Kong.svg  Hong Kong 4041
175Flag of the Cayman Islands.svg  Cayman Islands 55

Notes

  1. Sum of values for countries with available data, which may be official or FAO data based on imputation methodology

Related Research Articles

<span class="mw-page-title-main">Gold reserve</span> Financial concept

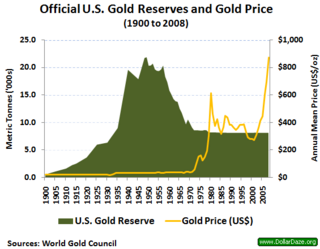
A gold reserve is the gold held by a national central bank, intended mainly as a guarantee to redeem promises to pay depositors, note holders, or trading peers, during the eras of the gold standard, and also as a store of value, or to support the value of the national currency.

<span class="mw-page-title-main">Agriculture in Argentina</span> Primary sector in Argentina

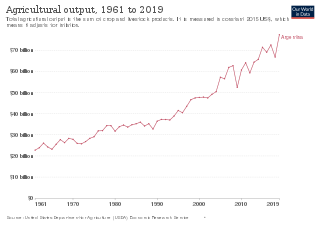
Agriculture is one of the bases of Argentina's economy.

<span class="mw-page-title-main">Gold mining in China</span> Overview of gold mining in the Peoples Republic of China

Gold mining in the People's Republic of China has made that country the world's largest gold producer. In 2022, China mined 403 tons of gold. Data indicates the marginal costs are often above the world price for gold. For the year 2007, gold output rose 12% from 2006 to 276 tonnes to become the world's largest for the first time—overtaking South Africa, which produced 272 tonnes. South Africa had until then been the largest for 101 years straight since 1905. The major reasons for this change in position had been due to South African production falling by 50% in the past decade as production costs there have risen, more stringent safety regulations have been implemented, and existing mines have become depleted.

References

  1. "Crops". FAOSTAT. Retrieved 9 August 2019. Countries – Select All; Regions – World + (Total); Elements – Production Quantity; Items – Tomatoes; Years – 2017 + 2016