Ocean color

Last updated
Blue ocean wave (Unsplash).jpg
Pilatus2006 picture 043.jpg
Baltic blooms ESA21514635.jpeg
Bahamas MODIS.jpg
NASA satellite view of Southern Ocean phytoplankton bloom.jpg
Clockwise from top left: deep blue water, blue-green water, satellite image of the Bahamas where sunlight reflects off sand and reefs in the shallows, satellite image of phytoplankton bloom in the Southern Ocean, satellite image of the Pribilof Islands showing shades of color from different phytoplankton, and satellite image of the Baltic Sea with phytoplankton blooms.

Ocean color is the branch of ocean optics that specifically studies the color of the water and information that can be gained from looking at variations in color. The color of the ocean, while mainly blue, actually varies from blue to green or even yellow, brown or red in some cases. [1] This field of study developed alongside water remote sensing, so it is focused mainly on how color is measured by instruments (like the sensors on satellites and airplanes).

Contents

Most of the ocean is blue in color, but in some places the ocean is blue-green, green, or even yellow to brown. [2] Blue ocean color is a result of several factors. First, water preferentially absorbs red light, which means that blue light remains and is reflected back out of the water. Red light is most easily absorbed and thus does not reach great depths, usually to less than 50 meters (164 ft). Blue light, in comparison, can penetrate up to 200 meters (656 ft). [3] Second, water molecules and very tiny particles in ocean water preferentially scatter blue light more than light of other colors. Blue light scattering by water and tiny particles happens even in the very clearest ocean water, [4] and is similar to blue light scattering in the sky.

The main substances that affect the color of the ocean include dissolved organic matter, living phytoplankton with chlorophyll pigments, and non-living particles like marine snow and mineral sediments. [5] Chlorophyll can be measured by satellite observations and serves as a proxy for ocean productivity (marine primary productivity) in surface waters. In long term composite satellite images, regions with high ocean productivity show up in yellow and green colors because they contain more (green) phytoplankton, whereas areas of low productivity show up in blue.

Overview

Ocean color depends on how light interacts with the materials in the water. When light enters water, it can either be absorbed (light gets used up, the water gets "darker"), [6] scattered (light gets bounced around in different directions, the water remains "bright"), [7] or a combination of both. How underwater absorption and scattering vary spectrally, or across the spectrum of visible to infrared light energy (about 400 nm to 2000 nm wavelengths) determines what "color" the water will appear to a sensor.

Water types by color

Most of the world’s oceans appear blue because the light leaving water is brightest (has the highest reflectance value) in the blue part of the visible light spectrum. Nearer to land, coastal waters often appear green. Green waters appear this way because algae and dissolved substances are absorbing light in the blue and red portions of the spectrum.

Blue oceans

A deep blue colored wave viewed from the water surface near Encinitas, California, United States. The Pacific Ocean contains some of the most deep blue colored waters in the world. Blue ocean wave (Unsplash).jpg
A deep blue colored wave viewed from the water surface near Encinitas, California, United States. The Pacific Ocean contains some of the most deep blue colored waters in the world.

The reason that open-ocean waters appear blue is that they are very clear, somewhat similar to pure water, and have few materials present or very tiny particles only. Pure water absorbs red light with depth. [8] As red light is absorbed, blue light remains. Large quantities of pure water appear blue (even in a white-bottom swimming pool or white-painted bucket [9] ). The substances that are present in blue-colored open ocean waters are often very tiny particles which scatter light, scattering light especially strongly in the blue wavelengths. [10] Light scattering in blue water is similar to the scattering in the atmosphere which makes the sky appear blue (called Rayleigh scattering). [11] Some blue-colored clear water lakes appear blue for these same reasons, like Lake Tahoe in the United States. [12]

Green oceans

Microscopic marine algae, called phytoplankton, absorb light in the blue and red wavelengths, due to their specific pigments like chlorophyll-a. Accordingly, with more and more phytoplankton in the water, the color of the water shifts toward the green part of the spectrum. [13] [14]

The most widespread light-absorbing substance in the oceans is chlorophyll pigment, which phytoplankton use to produce carbon by photosynthesis. Chlorophyll, a green pigment, makes phytoplankton preferentially absorb the red and blue portions of the light spectrum . As blue and red light are absorbed, green light remains. Ocean regions with high concentrations of phytoplankton have shades of blue-to-green water depending on the amount and type of the phytoplankton. [15] [16]

Green waters can also have a combination of phytoplankton, dissolved substances, and sediments, while still appearing green. This often happens in estuaries, coastal waters, and inland waters, which are called "optically complex" waters because multiple different substances are creating the green color seen by the sensor.

A surfer cuts through a green colored wave of ocean water at Strandhill, Ireland. It S Ireland The Water S Green (43244744).jpeg
A surfer cuts through a green colored wave of ocean water at Strandhill, Ireland.

Yellow to brown oceans

Sentinel-2 satellite image of the confluence of the Rio Negro and the Solimoes River, Brazil. The Rio Negro in the upper left part of the image is dark due to high concentrations of colored dissolved organic matter (CDOM). The Solimoes River in the lower and right part of the image is brighter because of large amounts of sediments. Negro-Amazon confluence and Manaus (Brazil) from space (cropped).jpg
Sentinel-2 satellite image of the confluence of the Rio Negro and the Solimões River, Brazil. The Rio Negro in the upper left part of the image is dark due to high concentrations of colored dissolved organic matter (CDOM). The Solimões River in the lower and right part of the image is brighter because of large amounts of sediments.

Ocean water appears yellow or brown when large amounts of dissolved substances, sediments, or both types of material are present.

Water can appear yellow or brown due to large amounts of dissolved substances. [17] [18] Dissolved matter or gelbstoff (meaning yellow substance) appears dark yet relatively transparent, much like tea. Dissolved substances absorb blue light more strongly than light of other colors. Colored dissolved organic matter (CDOM) often comes from decaying plant matter on land or in marshes, or in the open ocean from marine phytoplankton exuding dissolved substances from their cells. [19]

In coastal areas, runoff from rivers and resuspension of sand and silt from the bottom add sediments to surface waters. More sediments can make the waters appear more green, yellow, or brown because sediment particles scatter light energy at all colors. [20] In large amounts, mineral particles like sediment cause the water to turn brownish if there is a massive sediment loading event, [21] appearing bright and opaque (not transparent), much like chocolate milk.

In Lake Boomanjin, Australia, the waters are strongly colored due to tannins from nearby trees. Lake Boomanjin water.jpg
In Lake Boomanjin, Australia, the waters are strongly colored due to tannins from nearby trees.
MODIS satellite image of the Mississippi River sediment plume in the Gulf of Mexico following a series of rainstorms in February 2018 (image from March 4, 2018). Louisiana tmo 2018063.jpg
MODIS satellite image of the Mississippi River sediment plume in the Gulf of Mexico following a series of rainstorms in February 2018 (image from March 4, 2018).

Red oceans

Red tide off the Scripps Institution of Oceanography Pier, La Jolla, California, United States. La-Jolla-Red-Tide.780.jpg
Red tide off the Scripps Institution of Oceanography Pier, La Jolla, California, United States.

Ocean water can appear red if there is a bloom of a specific kind of phytoplankton causing a discoloration of the sea surface. [22] These events are called "Red tides." However, not all red tides are harmful, and they are only considered harmful algal blooms if the type of plankton involved contains hazardous toxins. [23] The red color comes from the pigments in the specific kinds of phytoplankton causing the bloom. Some examples are Karenia brevis in the Gulf of Mexico, [24] Alexandrium fundyense in the Gulf of Maine, [25] Margalefadinium polykroides and Alexandrium monilatum in the Chesapeake Bay, [26] and Mesodinium rubrum in Long Island Sound. [27]

Ocean color remote sensing

Ocean color remote sensing is also referred to as ocean color radiometry. Remote sensors on satellites, airplanes, and drones measure the spectrum of light energy coming from the water surface. The sensors used to measure light energy coming from the water are called radiometers (or spectrometers or spectroradiometers). Some radiometers are used in the field at earth’s surface on ships or directly in the water. Other radiometers are designed specifically for airplanes or earth-orbiting satellite missions. Using radiometers, scientists measure the amount of light energy coming from the water at all colors of the electromagnetic spectrum from ultraviolet to near-infrared. [28] From this reflected spectrum of light energy, or the apparent "color," researchers derive other variables to understand the physics and biology of the oceans.

Ocean color measurements can be used to infer important information such as phytoplankton biomass or concentrations of other living and non-living material. The patterns of algal blooms from satellite over time, over large regions up to the scale of the global ocean, has been instrumental in characterizing variability of marine ecosystems. Ocean color data is a key tool for research into how marine ecosystems respond to climate change and anthropogenic perturbations. [29]

One of the biggest challenges for ocean color remote sensing is atmospheric correction, or removing the color signal of the atmospheric haze and clouds to focus on the color signal of the ocean water. [30] The signal from the water itself is less than 10% of the total signal of light leaving Earth’s surface. [31] [32]

History

Scientists including biologist Ellen Weaver helped to develop the first sensors to measure ocean productivity from above, beginning with airplane-mounted sensors. Ellen Weaver, Biologist (16654493741).jpg
Scientists including biologist Ellen Weaver helped to develop the first sensors to measure ocean productivity from above, beginning with airplane-mounted sensors.

People have written about the color of the ocean over many centuries, including ancient Greek poet Homer’s famous "wine-dark sea." Scientific measurements of the color of the ocean date back to the invention of the Secchi disk in Italy in the mid-1800s to study the transparency and clarity of the sea. [33] [34]

Major accomplishments were made in the 1960s and 1970s leading up to modern ocean color remote sensing campaigns. Nils Gunnar Jerlov’s book Optical Oceanography, published in 1968, [35] was a starting point for many researchers in the next decades. In 1970, George Clarke published the first evidence that chlorophyll concentration could be estimated based on green versus blue light coming from the water, as measured from an airplane over George's Bank. [36] In the 1970s, scientist Howard Gordon and his graduate student George Maul related imagery from the first Landsat mission to ocean color. [37] [38] Around the same time, a group of researchers, including John Arvesen, Dr. Ellen Weaver, and explorer Jacques Cousteau, began developing sensors to measure ocean productivity beginning with an airborne sensor. [39] [40]

Remote sensing of ocean color from space began in 1978 with the successful launch of NASA's Coastal Zone Color Scanner (CZCS) on the Nimbus-7 satellite. Despite the fact that CZCS was an experimental mission intended to last only one year as a proof of concept, the sensor continued to generate a valuable time-series of data over selected test sites until early 1986. Ten years passed before other sources of ocean color data became available with the launch of other sensors, and in particular the Sea-viewing Wide Field-of-view sensor (SeaWiFS) in 1997 on board the NASA SeaStar satellite. [41] Subsequent sensors have included NASA's Moderate-resolution Imaging Spectroradiometer (MODIS) on board the Aqua and Terra satellites, ESA's MEdium Resolution Imaging Spectrometer (MERIS) onboard its environmental satellite Envisat. Several new ocean-colour sensors have recently been launched, including the Indian Ocean Colour Monitor (OCM-2) on-board ISRO's Oceansat-2 satellite and the Korean Geostationary Ocean Color Imager (GOCI), which is the first ocean colour sensor to be launched on a geostationary satellite, and Visible Infrared Imager Radiometer Suite (VIIRS) aboard NASA's Suomi NPP . More ocean colour sensors are planned over the next decade by various space agencies, including hyperspectral imaging. [42]

Applications

Ocean Color Radiometry and its derived products are also seen as fundamental Essential Climate Variables as defined by the Global Climate Observing System. [43] Ocean color datasets provide the only global synoptic perspective of primary production in the oceans, giving insight into the role of the world's oceans in the global carbon cycle. Ocean color data helps researchers map information relevant to society, such as water quality, hazards to human health like harmful algal blooms, bathymetry, and primary production and habitat types affecting commercially-important fisheries. [44]

Chlorophyll as a proxy for phytoplankton

Season-long composites of ocean chlorophyll concentrations. The purple and blue colors represent lower chlorophyll concentrations. The oranges and reds represent higher chlorophyll concentrations. These differences indicate areas with lesser or greater phytoplankton biomass. Season-long composites of ocean chlorophyll (8161799575).jpg
Season-long composites of ocean chlorophyll concentrations. The purple and blue colors represent lower chlorophyll concentrations. The oranges and reds represent higher chlorophyll concentrations. These differences indicate areas with lesser or greater phytoplankton biomass.
Satellite-derived chlorophyll-a concentration (mg m−3) from July 2002 to March 2017. This visualization was derived using data from the Moderate Resolution Imaging Spectroradiometer (MODIS) onboard NASA’s Aqua satellite. Chlorophyll-a concentration is a proxy for phytoplankton abundance. Darker shades of green indicate more chlorophyll and more phytoplankton, while shades of blue indicate less chlorophyll and less phytoplankton. [45]

The most widely used piece of information from ocean color remote sensing is satellite-derived chlorophyll-a concentration. Researchers calculate satellite-derived chlorophyll-a concentration from space based on the central premise that the more phytoplankton is in the water, the greener it is. [46]

Phytoplankton are microscopic algae, marine primary producers that turn sunlight into chemical energy that supports the ocean food web. Like plants on land, phytoplankton create oxygen for other life on Earth. Ocean color remote sensing ever since the launch of SeaWiFS in 1997 has allowed scientists to map phytoplankton – and thus model primary production - throughout the world’s oceans over many decades, [47] marking a major advance in knowledge of the Earth system.

Other applications

Suspended sediments can be seen in satellite imagery following events when high winds cause waves to stir up the seafloor, like in this image of the western side of the Yucatan Peninsula. Darker brown colored water shows where sediments come from land via rivers, while lighter colored water shows where sediments come from the chalky calcium carbonate sands on the seafloor. Sediment off the Yucatan Peninsula.jpg
Suspended sediments can be seen in satellite imagery following events when high winds cause waves to stir up the seafloor, like in this image of the western side of the Yucatan Peninsula. Darker brown colored water shows where sediments come from land via rivers, while lighter colored water shows where sediments come from the chalky calcium carbonate sands on the seafloor.

Beyond chlorophyll, a few examples of some of the ways that ocean color data are used include:

Harmful algal blooms

Researchers use ocean color data in conjunction with meteorological data and field sampling to forecast the development and movement of harmful algal blooms (commonly referred to as "red tides," although the two terms are not exactly the same). For example, MODIS data has been used to map Karenia brevis blooms in the Gulf of Mexico. [48]

Suspended sediments

Researchers use ocean color data to map the extent of river plumes and document wind-driven resuspension of sediments from the seafloor. For example, after hurricanes Katrina and Rita in the Gulf of Mexico, ocean color remote sensing was used to map the effects offshore. [49]

Sensors

Sensors used to measure ocean color are instruments that measure light at multiple wavelengths (multispectral) or a continuous spectrum of colors (hyperspectral), usually spectroradiometers or optical radiometers. Ocean color sensors can either be mounted on satellites or airplanes, or used at Earth’s surface.

Satellite sensors

The sensors below are earth-orbiting satellite sensors. The same sensor can be mounted on multiple satellites to give more coverage over time (aka higher temporal resolution). For example, the MODIS sensor is mounted on both Aqua and Terra satellites. Additionally, the VIIRS sensor is mounted on both Suomi National Polar-Orbiting Partnership (Suomi-NPP or SNPP) and Joint Polar Satellite System (JPSS-1, now known as NOAA-20) satellites.

Airborne sensors

The following sensors were designed to measure ocean color from airplanes for airborne remote sensing:

In situ sensors

A researcher uses a spectroradiometer to measure the light energy radiating from an ice melt pond in the Chukchi Sea in summer 2011. Melt Pond Optics (7348328794).jpg
A researcher uses a spectroradiometer to measure the light energy radiating from an ice melt pond in the Chukchi Sea in summer 2011.

At Earth’s surface, such as on research vessels, in the water using buoys, or on piers and towers, ocean color sensors take measurements that are then used to calibrate and validate satellite sensor data. Calibration and validation are two types of "ground-truthing" that are done independently. Calibration is the tuning of raw data from the sensor to match known values, such as the brightness of the moon or a known reflection value at Earth’s surface. Calibration, done throughout the lifetime of any sensor, is especially critical to the early part of any satellite mission when the sensor is developed, launched, and beginning its first raw data collection. Validation is the independent comparison of measurements made in situ with measurements made from a satellite or airborne sensor. [59] Satellite calibration and validation maintain the quality of ocean color satellite data. [60] [61] There are many kinds of in situ sensors, and the different types are often compared on dedicated field campaigns or lab experiments called "round robins." In situ data are archived in data libraries such as the SeaBASS data archive. Some examples of in situ sensors (or networks of many sensors) used to calibrate or validate satellite data are:

See also

Related Research Articles

<span class="mw-page-title-main">Bathymetry</span> Study of underwater depth of lake or ocean floors

Bathymetry is the study of underwater depth of ocean floors, lake floors, or river floors. In other words, bathymetry is the underwater equivalent to hypsometry or topography. The first recorded evidence of water depth measurements are from Ancient Egypt over 3000 years ago. Bathymetric charts, are typically produced to support safety of surface or sub-surface navigation, and usually show seafloor relief or terrain as contour lines and selected depths (soundings), and typically also provide surface navigational information. Bathymetric maps may also use a Digital Terrain Model and artificial illumination techniques to illustrate the depths being portrayed. The global bathymetry is sometimes combined with topography data to yield a global relief model. Paleobathymetry is the study of past underwater depths.

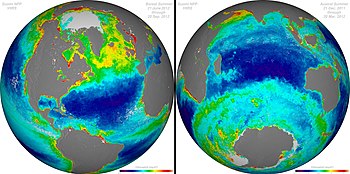
SeaWiFS was a satellite-borne sensor designed to collect global ocean biological data. Active from September 1997 to December 2010, its primary mission was to quantify chlorophyll produced by marine phytoplankton.

<span class="mw-page-title-main">Multispectral imaging</span> Capturing image data across multiple electromagnetic spectrum ranges

Multispectral imaging captures image data within specific wavelength ranges across the electromagnetic spectrum. The wavelengths may be separated by filters or detected with the use of instruments that are sensitive to particular wavelengths, including light from frequencies beyond the visible light range, i.e. infrared and ultra-violet. It can allow extraction of additional information the human eye fails to capture with its visible receptors for red, green and blue. It was originally developed for military target identification and reconnaissance. Early space-based imaging platforms incorporated multispectral imaging technology to map details of the Earth related to coastal boundaries, vegetation, and landforms. Multispectral imaging has also found use in document and painting analysis.

<span class="mw-page-title-main">Seasat</span>

Seasat was the first Earth-orbiting satellite designed for remote sensing of the Earth's oceans and had on board one of the first spaceborne synthetic-aperture radar (SAR). The mission was designed to demonstrate the feasibility of global satellite monitoring of oceanographic phenomena and to help determine the requirements for an operational ocean remote sensing satellite system. Specific objectives were to collect data on sea-surface winds, sea-surface temperatures, wave heights, internal waves, atmospheric water, sea ice features and ocean topography. Seasat was managed by NASA's Jet Propulsion Laboratory and was launched on 27 June 1978 into a nearly circular 800 km (500 mi) orbit with an inclination of 108°. Seasat operated until 10 October 1978 (UTC), when a massive short circuit in the Agena-D bus electrical system ended the mission.

<span class="mw-page-title-main">MERIS</span>

MEdium Resolution Imaging Spectrometer (MERIS) was one of the main instruments on board the European Space Agency (ESA)'s Envisat platform. The sensor was in orbit from 2002 to 2012. ESA formally announced the end of Envisat's mission on 9 May 2012.

<span class="mw-page-title-main">Coastal zone color scanner</span> Satellite device designed for detecting water on Earth

The coastal zone color scanner (CZCS) was a multi-channel scanning radiometer aboard the Nimbus 7 satellite, predominately designed for water remote sensing. Nimbus 7 was launched 24 October 1978, and CZCS became operational on 2 November 1978. It was only designed to operate for one year (as a proof-of-concept), but in fact remained in service until 22 June 1986. Its operation on board the Nimbus 7 was limited to alternate days as it shared its power with the passive microwave scanning multichannel microwave radiometer.

<span class="mw-page-title-main">Fluorometer</span>

A fluorometer, fluorimeter or fluormeter is a device used to measure parameters of visible spectrum fluorescence: its intensity and wavelength distribution of emission spectrum after excitation by a certain spectrum of light. These parameters are used to identify the presence and the amount of specific molecules in a medium. Modern fluorometers are capable of detecting fluorescent molecule concentrations as low as 1 part per trillion.

<span class="mw-page-title-main">Colored dissolved organic matter</span> Optically measurable component of the dissolved organic matter in water

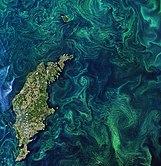
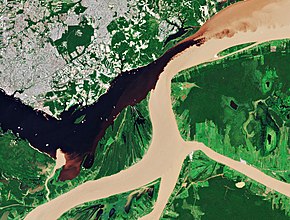
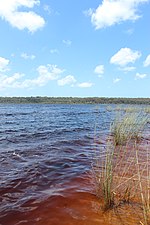
Colored dissolved organic matter (CDOM) is the optically measurable component of dissolved organic matter in water. Also known as chromophoric dissolved organic matter, yellow substance, and gelbstoff, CDOM occurs naturally in aquatic environments and is a complex mixture of many hundreds to thousands of individual, unique organic matter molecules, which are primarily leached from decaying detritus and organic matter. CDOM most strongly absorbs short wavelength light ranging from blue to ultraviolet, whereas pure water absorbs longer wavelength red light. Therefore, water with little or no CDOM, such as the open ocean, appears blue. Waters containing high amounts of CDOM can range from brown, as in many rivers, to yellow and yellow-brown in coastal waters. In general, CDOM concentrations are much higher in fresh waters and estuaries than in the open ocean, though concentrations are highly variable, as is the estimated contribution of CDOM to the total dissolved organic matter pool.

The marine optical buoy (MOBY) measures light at and very near the sea surface in a specific location over a long period of time, serving as part of an ocean color observation system. Satellites are another component of the system, providing global coverage through remote sensing; however, satellites measure light above the Earth's atmosphere, becoming subject to interference from the atmosphere itself and other light sources. The Marine Optical Buoy helps alleviate that interference and thus improve the quality of the overall ocean color observation system.

<span class="mw-page-title-main">Water remote sensing</span> System to measure the color of water by observing the spectrum of radiation leaving the water.

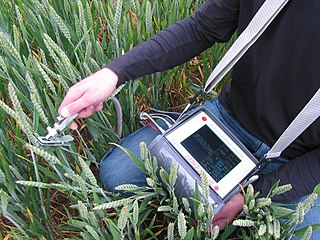
Water Remote Sensing is the observation of water bodies such as lakes, oceans, and rivers from a distance in order to describe their color, state of ecosystem health, and productivity. Water remote sensing studies the color of water through the observation of the spectrum of water leaving radiance. From the spectrum of color coming from the water, the concentration of optically active components of the upper layer of the water body can be estimated via specific algorithms. Water quality monitoring by remote sensing and close-range instruments has obtained considerable attention since the founding of EU Water Framework Directive.

Oceansat-1 or IRS-P4 was the first Indian satellite built primarily for ocean applications. It was a part of the Indian Remote Sensing Programme satellite series. The satellite carried an Ocean Colour Monitor (OCM) and a Multi-frequency Scanning Microwave Radiometer (MSMR) for oceanographic studies. Oceansat-1 thus vastly augment the IRS satellite system of Indian Space Research Organisation (ISRO) comprising four satellites, IRS-1B, IRS-1C, IRS-P3 and IRS-1D and extend remote sensing applications to several newer areas.

<span class="mw-page-title-main">Haiyang (satellite)</span> Chinese ocean observation satellite

Haiyang is a series of marine remote sensing satellites developed and operated by the People's Republic of China since 2002. As of October 2022, eight satellites have been launched with ten more planned. Built by the state-owned aerospace contractor China Academy of Space Technology (CAST), Haiyang satellites carry a variety of ocean-imaging sensor payloads and are operated by the National Satellite Ocean Application Service (NSOAS), a subordinate agency of the State Oceanic Administration (SOA). Haiyang satellites are launched from Taiyuan Satellite Launch Center (TSLC) into Sun-synchronous orbit (SSO) aboard Long March-series rockets.

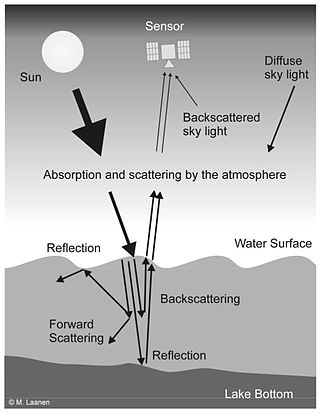
Remote sensing in oceanography is a widely used observational technique which enables researchers to acquire data of a location without physically measuring at that location. Remote sensing in oceanography mostly refers to measuring properties of the ocean surface with sensors on satellites or planes, which compose an image of captured electromagnetic radiation. A remote sensing instrument can either receive radiation from the earth’s surface (passive), whether reflected from the sun or emitted, or send out radiation to the surface and catch the reflection (active). All remote sensing instruments carry a sensor to capture the intensity of the radiation at specific wavelength windows, to retrieve a spectral signature for every location. The physical and chemical state of the surface determines the emissivity and reflectance for all bands in the electromagnetic spectrum, linking the measurements to physical properties of the surface. Unlike passive instruments, active remote sensing instruments also measure the two-way travel time of the signal; which is used to calculate the distance between the sensor and the imaged surface. Remote sensing satellites often carry other instruments which keep track of their location and measure atmospheric conditions.

<span class="mw-page-title-main">Ocean optics</span> The study of light interaction with water and submerged materials

Ocean optics is the study of how light interacts with water and the materials in water. Although research often focuses on the sea, the field broadly includes rivers, lakes, inland waters, coastal waters, and large ocean basins. How light acts in water is critical to how ecosystems function underwater. Knowledge of ocean optics is needed in aquatic remote sensing research in order to understand what information can be extracted from the color of the water as it appears from satellite sensors in space. The color of the water as seen by satellites is known as ocean color. While ocean color is a key theme of ocean optics, optics is a broader term that also includes the development of underwater sensors using optical methods to study much more than just color, including ocean chemistry, particle size, imaging of microscopic plants and animals, and more.

<span class="mw-page-title-main">Hyperspectral Imager for the Coastal Ocean</span> Observation sensor on the International Space Station

The Hyperspectral Imager for the Coastal Ocean (HICO) was a hyperspectral earth observation sensor that operated on the International Space Station (ISS) from 2009 to 2014. HICO collected hyperspectral satellite imagery of the earth's surface from the ISS.

<span class="mw-page-title-main">SeaBASS (data archive)</span> Data archive of in situ oceanographic data

The SeaWiFS Bio-optical Archive and Storage System (SeaBASS) is a data archive of in situ oceanographic data used to support satellite remote sensing research of ocean color. SeaBASS is used for developing algorithms for satellite-derived variables and for validating or “ground-truthing” satellite-derived data products. The acronym begins with “S” for SeaWiFS, because the data repository began in the 1990s around the time of the launch of the SeaWiFS satellite sensor, and the same data archive has been used ever since. Oceanography projects funded by the NASA Earth Science program are required to upload data collected on research campaigns to the SeaBASS data repository to increase the volume of open-access data available to the public. As of 2021 the data archive contained information from thousands of field campaigns uploaded by over 100 principal investigators.

Low-nutrient, low-chlorophyll (LNLC)regions are aquatic zones that are low in nutrients and consequently have low rate of primary production, as indicated by low chlorophyll concentrations. These regions can be described as oligotrophic, and about 75% of the world's oceans encompass LNLC regions. A majority of LNLC regions are associated with subtropical gyres but are also present in areas of the Mediterranean Sea, and some inland lakes. Physical processes limit nutrient availability in LNLC regions, which favors nutrient recycling in the photic zone and selects for smaller phytoplankton species. LNLC regions are generally not found near coasts, owing to the fact that coastal areas receive more nutrients from terrestrial sources and upwelling. In marine systems, seasonal and decadal variability of primary productivity in LNLC regions is driven in part by large-scale climatic regimes leading to important effects on the global carbon cycle and the oceanic carbon cycle.

Colleen Beckmann Mouw is an associate professor at the University of Rhode Island known for her work on phytoplankton ecology and increasing retention of women in oceanography.

<span class="mw-page-title-main">Water clarity</span> How deeply visible light penetrates through water

Water clarity is a descriptive term for how deeply visible light penetrates through water. In addition to light penetration, the term water clarity is also often used to describe underwater visibility. Water clarity is one way that humans measure water quality, along with oxygen concentration and the presence or absence of pollutants and algal blooms.

Shubha Platt, known professionally as Shubha Sathyendranath, is a marine scientist known for her work on marine optics and remote sensing of ocean colour. She is the 2021 recipient of the A.G. Huntsman Award for Excellence in the Marine Sciences.

References

  1. Fleming, Nic (2015). "Is the sea really blue?". BBC - Earth. Retrieved 21 August 2021.
  2. Fleming, Nic (27 May 2015). "Is the sea really blue?". BBC - Earth. BBC. Retrieved 25 August 2021.
  3. Webb, Paul (July 2020), "6.5 Light", Introduction to Oceanography, retrieved 21 July 2021
  4. Morel, Andre; Prieur, Louis (1977). "Analysis of variations in ocean color 1". Limnology and Oceanography. 22 (4): 709–722. Bibcode:1977LimOc..22..709M. doi: 10.4319/lo.1977.22.4.0709 .
  5. Coble, Paula G. (2007). "Marine Optical Biogeochemistry: The Chemistry of Ocean Color". Chemical Reviews. 107 (2): 402–418. doi:10.1021/cr050350+. PMID   17256912.
  6. Mobley, Curtis; Roesler, Collin (2020). Absorption Overview. Ocean Optics Web Book.
  7. Mobley, Curtis; Boss, Emmanuel (2020). Scattering Overview. Ocean Optics Web Book.
  8. Pope, Robin M.; Fry, Edward S. (1997). "Absorption spectrum (380-700 nm) of pure water. II. Integrating cavity measurements". Applied Optics. 36 (33): 8710–8723. Bibcode:1997ApOpt..36.8710P. doi:10.1364/AO.36.008710. PMID   18264420. S2CID   11061625.
  9. "Water Color". Overview. USGS. Retrieved 21 August 2021.
  10. Morel, Andre; Prieur, Louis (1977). "Analysis of variations in ocean color". Limnology and Oceanography. 22 (4): 709–722. Bibcode:1977LimOc..22..709M. doi: 10.4319/lo.1977.22.4.0709 .
  11. Mishchenko, Michael I; Travis, Larry D; Lacis, Andrew A (2002). Scattering, Absorption, and Emission of Light by Small Particles. Cambridge, UK: Cambridge University Press.
  12. Smith, Raymond C.; Tyler, John E.; Goldman, Charles R. (1973). "Optical properties and color of Lake Tahoe and Crater Lake". Limnology and Oceanography. 18 (2): 189–199. Bibcode:1973LimOc..18..189S. doi:10.4319/lo.1973.18.2.0189.
  13. Morel, Andre; Prieur, Louis (1977). "Analysis of variations in ocean color". Limnology and Oceanography. 22 (4): 709–722. Bibcode:1977LimOc..22..709M. doi: 10.4319/lo.1977.22.4.0709 .
  14. Vaillancourt, Robert D.; Brown, Christopher W.; Guillard, Robert R. L.; Balch, William M. (2004). "Light backscattering properties of marine phytoplankton: relationships to cell size, chemical composition and taxonomy". Journal of Plankton Research. 26 (2): 191–212. doi:10.1093/plankt/fbh012.
  15. Bidigare, Robert R.; Ondrusek, Michael E.; Morrow, John H.; Kiefer, Dale A. (1990). Spinrad, Richard W (ed.). "In-vivo absorption properties of algal pigments". Proceedings of SPIE. Ocean Optics X. 1302: 290. Bibcode:1990SPIE.1302..290B. doi:10.1117/12.21451. S2CID   94186696.
  16. Vandermeulen, Ryan A.; Mannino, Antonio; Craig, Susanne E.; Werdell, P. Jeremy (2020). "150 shades of green: Using the full spectrum of remote sensing reflectance to elucidate color shifts in the ocean". Remote Sensing of Environment. 247: 111900. Bibcode:2020RSEnv.24711900V. doi: 10.1016/j.rse.2020.111900 .
  17. Kirk, John T. O. (1994). Light and Photosynthesis in Aquatic Ecosystems (3rd ed.). Cambridge University Press.
  18. Hawes, Stephen K. (1992). Quantum fluorescence efficiencies of marine fulvic and humic acids. Thesis: University of South Florida.
  19. Fondriest Environmental, Inc. (1 August 2017). "Chromophoric Dissolved Organic Matter". Fundamentals of Environmental Measurements. Retrieved 22 August 2021.
  20. Babin, M.; Morel, A.; Fournier-Sicre, V.; Fell, F.; Stramski, D. (2003). "Light scattering properties of marine particles in coastal and open ocean waters as related to the particle mass concentration". Limnology and Oceanography. 48 (2): 843–859. Bibcode:2003LimOc..48..843B. doi:10.4319/lo.2003.48.2.0843. S2CID   13621264.
  21. Aurin, D. A.; Mannino, A.; Franz, B. (2013). "Spatially resolving ocean color and sediment dispersion in river plumes, coastal systems, and continental shelf waters". Remote Sensing of Environment. 137: 212–225. Bibcode:2013RSEnv.137..212A. doi:10.1016/j.rse.2013.06.018. hdl: 2060/20140010389 .
  22. "Ocean colour & algae". The European Space Agency. ESA. Retrieved 23 August 2021.
  23. "What is a red tide?". Ocean Facts. National Ocean Service, NOAA. Retrieved 23 August 2021.
  24. Magaña, Hugo A.; Conteras, Cindy; Villareal, Tracy A. (2003). "A historical assessment of Karenia brevis in the western Gulf of Mexico Author links open overlay panel". Harmful Algae. 2 (3): 163–171. doi:10.1016/S1568-9883(03)00026-X.
  25. Townsend, David W.; Pettigrew, Neal R.; Thomas, Andrew C. (2005). "On the nature of Alexandrium fundyense blooms in the Gulf of Maine". Deep Sea Research Part II: Topical Studies in Oceanography. 52 (19–21): 2603–2630. Bibcode:2005DSRII..52.2603T. doi:10.1016/j.dsr2.2005.06.028.
  26. "HAB Species". Virginia Institute of Marine Science. Retrieved 23 August 2021.
  27. Dierssen, Heidi; McManus, George B.; Chlus, Adam; Qiu, Dajun; Gao, Bo-Cai; Lin, Senjie (2015). "Space station image captures a red tide ciliate bloom at high spectral and spatial resolution". Proceedings of the National Academy of Sciences. 112 (48): 14783–14787. Bibcode:2015PNAS..11214783D. doi: 10.1073/pnas.1512538112 . PMC   4672822 . PMID   26627232.
  28. Mobley, Curtis. "Geometrical Radiometry. Ocean Optics Web Book" . Retrieved 23 August 2021.
  29. Dutkiewicz, Stephanie; Hickman, Anna E.; Jahn, Oliver; Henson, Stephanie; Beaulieu, Claudie; Monier, Erwan (2019). "Ocean colour signature of climate change". Nature Communications. 10 (1): 578. Bibcode:2019NatCo..10..578D. doi:10.1038/s41467-019-08457-x. PMC   6362115 . PMID   30718491.
  30. Mobley, Curtis. "The Atmospheric Correction Problem. Ocean Optics Web Book" . Retrieved 23 August 2021.
  31. Mobley, Curtis D.; Werdell, P. Jeremy; Franz, Bryan; Ahmad, Ziauddin; Bailey, Sean. "Atmospheric Correction for Satellite Ocean Color Radiometry. NASA/TM–2016-217551" (PDF).{{cite journal}}: Cite journal requires |journal= (help)
  32. Mobley, Curtis D. (2004). Light ant Water: Radiative Transfer in natural waters.
  33. Pitarch, Jamie (2020). "A Review of Secchi's Contribution to Marine Optics and the Foundation of Secchi Disk Science". Oceanography. 33 (3). doi: 10.5670/oceanog.2020.301 .
  34. Secchi, A.; Cialdi, C. A. (1866). Sul moto ondoso del mare e sulle correnti de esso specialmente auqelle littorali (2nd ed.). Cited ONI Translation A-655, p. 1. Hydrographic Office, 1955.
  35. Jerlov, Nils Gunnar (1968). Optical Oceanography. Amsterdam, the Netherlands: Elsevier Publishing Company.
  36. Clarke, George L.; Ewing, Gifford C.; Lorenzen, Carl J. (20 February 1970). "Spectra of Backscattered Light from the Sea Obtained from Aircraft as a Measure of Chlorophyll Concentration". Science. American Association for the Advancement of Science (AAAS). 167 (3921): 1119–1121. Bibcode:1970Sci...167.1119C. doi:10.1126/science.167.3921.1119. ISSN   0036-8075. PMID   17829405. S2CID   41680167.
  37. Gordon, Howard R. (2010). "Chapter 17: Some Reflections on Thirty-Five Years of Ocean Color Remote Sensing". In Alberotanza, L.; Gower, J. F. R. (eds.). Oceanography form Space. Springer. ISBN   9789048186815.
  38. Maul, George A.; Gordon, Howard R. (1975). "On the Use of the Earth Resources Technology Satellite ( LANDSAT-1 ) in Optical Oceanography". Remote Sensing of Environment. 4: 95–128. Bibcode:1975RSEnv...4...95M. doi:10.1016/0034-4257(75)90008-5.
  39. Macomber, Frank (20 March 1973). "Cousteau, NASA seek ocean food". Star-News. Retrieved 23 August 2021.
  40. McKinnon, Mika (1 November 2015). "Here's How we Started Measuring the Oceans from Space". Gizmodo. Retrieved 23 August 2021.
  41. Mobley, Curtis (27 May 2021). "Ocean Color. Ocean Optics Web Book" . Retrieved 23 August 2021.
  42. Dierssen, Heidi M.; Ackleson, Stephen G.; Joyce, Karen E.; Hestir, Erin L.; Castagna, Alexandre; Lavender, Samantha; McManus, Margaret A. (2021). "Living up to the Hype of Hyperspectral Aquatic Remote Sensing: Science, Resources and Outlook". Frontiers in Environmental Science. 9. doi: 10.3389/fenvs.2021.649528 .
  43. "Essential Variables". Earthdata. 20 August 2021. Retrieved 23 August 2021.
  44. Platt, Trevor; Hoepffner, Nicolas; Stuart, Venetia; Brown, Christopher, eds. (2008). "Why Ocean Colour? The Societal Benefits of Ocean Colour Technology. IOCCG Report Number 7" (PDF). Reports and Monographs of the International Ocean-Colour Coordinating Group. Dartmouth, Canada.
  45. Ocean Color Time Series NASA Hyperwall, 17 March 2016. PD-icon.svg This article incorporates text from this source, which is in the public domain .
  46. "Chlorophyll a (chlor_a)". NASA Ocean Color. Algorithm Descriptions. Ocean Biology Processing Group (OBPG). Retrieved 23 August 2021.
  47. Siegel, David A.; et al. (2013). "Regional to global assessments of phytoplankton dynamics from the SeaWiFS mission". Remote Sensing of Environment. 135: 77–91. Bibcode:2013RSEnv.135...77S. doi:10.1016/j.rse.2013.03.025. hdl: 20.500.11937/34412 .
  48. Hu, Chuanmin; Cannizzaro, Jennifer; Carder, Kendall L.; Lee, Zhongping; Muller-Karger, Frank E.; Soto, Inia (2011). "Case Study 7: Red Tide Detection in the Eastern Gulf of Mexico Using MODIS Imagery" (PDF). Handbook of Satellite Remote Sensing Image Interpretation: Marine Applications. IOCCG. pp. 95–110. Retrieved 23 August 2021.
  49. Lohrenz, Stephen E.; Cai, Wei-Jun; Chen, Xiaogang; Tuel, Merritt (2008). "Satellite Assessment of Bio-Optical Properties of Northern Gulf of Mexico Coastal Waters Following Hurricanes Katrina and Rita". Sensors. 8 (7): 4135–415–. Bibcode:2008Senso...8.4135L. doi: 10.3390/s8074135 . PMC   3697166 . PMID   27879927.
  50. "HICO". Ocean-Colour Sensors. IOCCG. 2021. Retrieved 23 August 2021.
  51. "HICO". NASA Ocean Color. Retrieved 23 August 2021.
  52. "SeaHawk/HawkEye". NASA Ocean Color. Retrieved 23 August 2021.
  53. "AVIRIS - Airborne Visible / Infrared Imaging Spectrometer". aviris.jpl.nasa.gov. Retrieved 2022-03-30.
  54. Drdla, Katja (16 April 2020). "Airborne Ocean Color Imager". NASA Airborne Science. Retrieved 23 August 2021.
  55. "CORAL-PRISM Browser". CORAL EVS-2 PRISM Data. NASA Ocean Color. Retrieved 23 August 2021.
  56. "PRISM Website: Home". NASA Jet Propulsion Laboratory. 6 May 2021. Retrieved 23 August 2021.
  57. Guild, Liane S.; Kudela, Raphael M.; Hooker, Stanford B.; Palacios, Sherry L.; Housekeeper, Henry F. (2020). "Airborne Radiometry for Calibration, Validation, and Research in Oceanic, Coastal, and Inland Waters". Frontiers in Environmental Science. 8. doi: 10.3389/fenvs.2020.585529 .
  58. Harding, L.W.; Miller, W.D.; Swift, R.N.; Wright, C.W. (2001), "Aircraft Remote Sensing", Encyclopedia of Ocean Sciences, Elsevier, pp. 138–146, doi:10.1016/b978-012374473-9.00425-2, ISBN   978-0-12-374473-9 , retrieved 2022-03-30
  59. Mueller, James L.; Fargion, Giulietta S.; McClain, Charles R., eds. (2003). "Ocean Optics Protocols For Satellite Ocean Color Sensor Validation, Revision 4, Volume III: Radiometric Measurements and Data Analysis Protocols. NASA/TM-2003-21621/Rev-Vol III" (PDF). Goddard Space Flight Center, Greenbelt, Maryland.{{cite journal}}: Cite journal requires |journal= (help)
  60. Bailey, Sean W.; Werdell, P. Jeremy (2006). "A multi-sensor approach for the on-orbit validation of ocean color satellite data products". Remote Sensing of Environment. 102 (1–2): 12–23. Bibcode:2006RSEnv.102...12B. doi:10.1016/j.rse.2006.01.015.
  61. Werdell, P. Jeremy; et al. (2003). "Unique data repository facilitates ocean color satellite validation". Eos. 84 (38): 377–392. Bibcode:2003EOSTr..84..377W. doi:10.1029/2003EO380001.
  62. Vansteenwegen, Dieter; Ruddick, Kevin; Cattrijsse, Andre; Vanhellemont, Quinten; Beck, Matthew (2019). "The Pan-and-Tilt Hyperspectral Radiometer System (PANTHYR) for Autonomous Satellite Validation Measurements—Prototype Design and Testing". Remote Sensing. 11 (11): 1360. Bibcode:2019RemS...11.1360V. doi: 10.3390/rs11111360 .
  63. "RAMSES - TriOS Mess- und Datentechnik". TriOS Optical Sensors. Retrieved 23 August 2021.
  64. "C-OPS: Compact Optical Profiling System" (PDF). Biospherical Instruments Inc. Retrieved 23 August 2021.
  65. "Hyperspectral Surface Acquisition System". Sea-Bird Scientific. Retrieved 23 August 2021.