
An antibody (Ab) is the secreted form of the B cell receptor; the term immunoglobulin refers to either the membrane-bound form or the secreted form of the B cell receptor, but they are, broadly speaking, the same protein, and so the terms are often treated as synonymous. Antibodies belong to the immunoglobulin superfamily. They are large, Y-shaped protein used by the immune system to identify and neutralize foreign objects such as bacteria and viruses, including those that cause disease. Antibodies, however, can be generated to recognize virtually any molecule in existence. The thing recognized by an antibody called an antigen. This term literally means "antibody generator." It is the presence of an antigen that drives the formation of antigen-specific antibody. Each tip of the "Y" of an antibody contains a paratope that is specific for one particular epitope on an antigen, allowing these two structures to bind together with precision. Using this binding mechanism, an antibody can tag a microbe or an infected cell for attack by other parts of the immune system, or can neutralize it directly.

Immunology is a branch of biology and medicine that covers the study of immune systems in all organisms.

The enzyme-linked immunosorbent assay (ELISA) is a commonly used analytical biochemistry assay, first described by Eva Engvall and Peter Perlmann in 1971. The assay is a solid-phase type of enzyme immunoassay (EIA) to detect the presence of a ligand in a liquid sample using antibodies directed against the protein to be measured. ELISA has been used as a diagnostic tool in medicine, plant pathology, and biotechnology, as well as a quality control check in various industries.

Immunoglobulin A is an antibody that plays a role in the immune function of mucous membranes. The amount of IgA produced in association with mucosal membranes is greater than all other types of antibody combined. In absolute terms, between three and five grams are secreted into the intestinal lumen each day. This represents up to 15% of total immunoglobulins produced throughout the body.

In immunology, seroconversion is the development of specific antibodies in the blood serum as a result of infection or immunization, including vaccination. During infection or immunization, antigens enter the blood, and the immune system begins to produce antibodies in response. Before seroconversion, the antigen itself may or may not be detectable, but the antibody is absent. During seroconversion, the antibody is present but not yet detectable. After seroconversion, the antibody is detectable by standard techniques and remains detectable unless the individual seroreverts, in a phenomenon called seroreversion, or loss of antibody detectability, which can occur due to weakening of the immune system or decreasing antibody concentrations over time. Seroconversion refers the production of specific antibodies against specific antigens, meaning that a single infection could cause multiple waves of seroconversion against different antigens. Similarly, a single antigen could cause multiple waves of seroconversion with different classes of antibodies. For example, most antigens prompt seroconversion for the IgM class of antibodies first, and subsequently the IgG class.
Serology is the scientific study of serum and other body fluids. In practice, the term usually refers to the diagnostic identification of antibodies in the serum. Such antibodies are typically formed in response to an infection, against other foreign proteins, or to one's own proteins. In either case, the procedure is simple.

A radioimmunoassay (RIA) is an immunoassay that uses radiolabeled molecules in a stepwise formation of immune complexes. A RIA is a very sensitive in vitro assay technique used to measure concentrations of substances, usually measuring antigen concentrations by use of antibodies.
The direct and indirect Coombs tests, also known as antiglobulin test (AGT), are blood tests used in immunohematology. The direct Coombs test detects antibodies that are stuck to the surface of the red blood cells. Since these antibodies sometimes destroy red blood cells they can cause anemia; this test can help clarify the condition. The indirect Coombs test detects antibodies that are floating freely in the blood. These antibodies could act against certain red blood cells; the test can be carried out to diagnose reactions to a blood transfusion.

In immunology, epitope mapping is the process of experimentally identifying the binding site, or epitope, of an antibody on its target antigen. Identification and characterization of antibody binding sites aid in the discovery and development of new therapeutics, vaccines, and diagnostics. Epitope characterization can also help elucidate the binding mechanism of an antibody and can strengthen intellectual property (patent) protection. Experimental epitope mapping data can be incorporated into robust algorithms to facilitate in silico prediction of B-cell epitopes based on sequence and/or structural data.

Hypersensitivity pneumonitis (HP) or extrinsic allergic alveolitis (EAA) is a syndrome caused by the repetitive inhalation of antigens from the environment in susceptible or sensitized people. Common antigens include molds, bacteria, bird droppings, bird feathers, agricultural dusts, bioaerosols and chemicals from paints or plastics. People affected by this type of lung inflammation (pneumonitis) are commonly exposed to the antigens by their occupations, hobbies, the environment and animals. The inhaled antigens produce a hypersensitivity immune reaction causing inflammation of the airspaces (alveoli) and small airways (bronchioles) within the lung. Hypersensitivity pneumonitis may eventually lead to interstitial lung disease.

Immunoelectrophoresis is a general name for a number of biochemical methods for separation and characterization of proteins based on electrophoresis and reaction with antibodies. All variants of immunoelectrophoresis require immunoglobulins, also known as antibodies, reacting with the proteins to be separated or characterized. The methods were developed and used extensively during the second half of the 20th century. In somewhat chronological order: Immunoelectrophoretic analysis, crossed immunoelectrophoresis, rocket-immunoelectrophoresis, fused rocket immunoelectrophoresis ad modum Svendsen and Harboe, affinity immunoelectrophoresis ad modum Bøg-Hansen.
Heterophile antibodies are antibodies induced by external antigens.

Ouchterlony double immunodiffusion is an immunological technique used in the detection, identification and quantification of antibodies and antigens, such as immunoglobulins and extractable nuclear antigens. The technique is named after Örjan Ouchterlony, the Swedish physician who developed the test in 1948 to evaluate the production of diphtheria toxins from isolated bacteria.
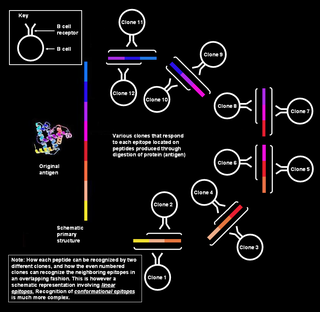
Polyclonal B cell response is a natural mode of immune response exhibited by the adaptive immune system of mammals. It ensures that a single antigen is recognized and attacked through its overlapping parts, called epitopes, by multiple clones of B cell.
Nephelometry is a technique used in immunology to determine the levels of several blood plasma proteins. For example the total levels of antibodies isotypes or classes: Immunoglobulin M, Immunoglobulin G, and Immunoglobulin A. It is important in quantification of free light chains in diseases such as multiple myeloma. Quantification is important for disease classification and for disease monitoring once a patient has been treated.

Immunofixation permits the detection and typing of monoclonal antibodies or immunoglobulins in serum or urine. It is of great importance for the diagnosis and monitoring of certain blood related diseases such as myeloma.
Örjan Thomas Ouchterlony was a Swedish bacteriologist and immunologist who is credited with the creation of the Ouchterlony double immuno diffusion test in the 1940s. He was trained at Karolinska Institute, where his received his medical doctorate. He worked at Sweden's State Bacteriology Laboratory from 1935 to 1952. Ouchterlony was a professor of bacteriology at the Medical Faculty of Gothenburg University from 1952 to 1980 and was elected a member of the Royal Swedish Academy of Sciences in 1968. In addition to his laboratory work, he did research in field epidemiology of infectious diseases and worked and lectured in Africa and the United States, as well as in several countries in Europe. Upon his retirement in 1980, the successor to his professorial chair was Jan Holmgren.
The Ouchterlony plate is one of the more frequently used techniques for the identification of antigens and antibodies, by measurement of diffusion gradients in gel. Among its many applications has been the search for tumor-specific antigens. The technique was introduced by Örjan Ouchterlony of Sweden, in 1948, initially for the in vitro testing of the toxin-producing capacity of diphtheria bacteria. The technique was proved well suited to the analysis of complex serological systems, including analysis that helped to elucidate the structural heterogeneity of immunoglobulins. Ouchterlony reviewed the history of the developments, which extends back to the late Nineteenth Century.
Immunodiffusion is a diagnostic test which involves diffusion through a substance such as agar which is generally soft gel agar (2%) or agarose (2%), used for the detection of antibodies or antigen.
Virus quantification is counting or calculating the number of virus particles (virions) in a sample to determine the virus concentration. It is used in both research and development (R&D) in academic and commercial laboratories as well as in production situations where the quantity of virus at various steps is an important variable that must be monitored. For example, the production of virus-based vaccines, recombinant proteins using viral vectors, and viral antigens all require virus quantification to continually monitor and/or modify the process in order to optimize product quality and production yields and to respond to ever changing demands and applications. Other examples of specific instances where viruses need to be quantified include clone screening, multiplicity of infection (MOI) optimization, and adaptation of methods to cell culture.
Antigen-antibody interaction, or antigen-antibody reaction, is a specific chemical interaction between antibodies produced by B cells of the white blood cells and antigens during immune reaction. The antigens and antibodies combine by a process called agglutination. It is the fundamental reaction in the body by which the body is protected from complex foreign molecules, such as pathogens and their chemical toxins. In the blood, the antigens are specifically and with high affinity bound by antibodies to form an antigen-antibody complex. The immune complex is then transported to cellular systems where it can be destroyed or deactivated.

