Renewable energy in the Netherlands

Last updated
Netherlands electricity generation by source Netherlands electricity generation by source.png
Netherlands electricity generation by source

Despite the historic usage of wind power to drain water and grind grain, the Netherlands today lags 21 of the 26 other member states of the European Union in the consumption of energy from renewable sources. In 2022, the Netherlands consumed just 15% of its total energy from renewables. [1] According to statistics published by Eurostat, it was the last among the EU countries in the shift away from global warming-inducing energy sources. [2] The leading renewable sources in the country are biomass, wind, solar and both geothermal and aerothermal power (mostly from ground source and air source heat pumps). In 2018 decisions were made to replace natural gas as the main energy source in the Netherlands with increased electrification being a major part of this process. [3]

Contents

Total energy production by source in petajoules [4]
  Coal  Oil  Gas  Renewable  Other sources

The low take up of renewable energy may be partially explained by the flat and often sub-sea level landscape and subsequent limits to hydropower resources, although hydro poor resource countries such as Denmark have still managed to make renewables the focus of their energy needs. In 2022, Dutch wind turbines had a total nameplate capacity of 8,831 MW, [5] accounting for 4,20% of final energy consumption. As of 2022, a number of large offshore windfarms have either come online (Gemini wind farm) are planned or have been granted authorisation (145,628 GWh). The total average capacity of the current offshore windfarms is 10,169 GWh. [6] [ circular reference ] Most of the tiny contribution made to electricity generation by hydroelectricity came from three power plants.

A large part of the renewable electricity sold in the Netherlands comes from Norway, a country which generates almost all its electricity from hydropower plants. In the Netherlands, household consumers can choose to buy renewable electricity. The relative amount of renewable energy used by household users has been steadily increasing, rising from 38% in 2008 [7] to 80% in 2020. [8]

One area in which the Netherlands is a relative leader is in the adoption of electric plug in vehicles. In 2022 plug-in electric vehicles in the Netherlands represented 10,7% of cars owned, [9] making it the world's second highest share after Norway. Electric vehicles are able to run on renewable electricity with lower emissions and have the potential to provide grid power storage facilities. [10]

Early development in overall renewable energy

Total renewable energy use was just 1.1% of overall energy use in 1990. This increased to 7.4% in 2018. The electricity sector first overtook the heating and cooling sector in 2005 in terms of total renewable energy use.

Renewable energy in the Netherlands (by use, in TWh) [11]
199019952000200520062007200820092010
Electricity0.811.42.867.447.867.339.2210.811.7
Heat5.005.255.286.867.568.088.679.369.61
Transport0000.030.503.613.334.332.67
Total5.816.698.1714.315.919.021.224.524.0
Renewable percent of
total use
1.1%1.2%1.4%2.3%2.6%3.1%3.4%4.1%3.7%
Note: Rounding errors may be present due to conversion from original source reported in PJ

All EU countries along with Iceland and Norway submitted National Renewable Energy Action Plans (NREAPs) [12] to outline the steps taken, and projected progress by each country between 2010 and 2020 to meet the Renewable Energy Directive targets for each country. Each plan contains a detailed breakdown of each country's current renewable energy usage and plans for future developments. According to projections by the Dutch submission in 2020 the gross final energy consumption in the Netherlands by sector breaks down as follows:

Projected energy use by sector in 2020 [12] ktoeRE 2020 target
Heating and cooling24,9898.7%
Electricity11,68137.0%
Transport10,63410.3%
Gross final energy consumption*52,08814.5%

*After adjustments.

Using the unadjusted NREAP data approximately half of energy consumption (52.8%) is used in the heating and cooling sector. The heating and cooling sector (also known as the thermal sector) includes domestic heating and air conditioning, industrial processes such as furnaces and any use of heat generally. The next largest share is the electricity sector at 24.7%, followed by the transport sector at 22.5%. Total annual energy consumption before adjustments for aviation is projected to be 52,088 ktoe (52.million tonnes of oil equivalent) by 2020.

The Netherlands has a minimum target of 14% of renewable energy use by 2020. The sectoral targets for 2020 break down into national targets of 8.7% in the heating and cooling sector, 37% in the electricity sector and 10.3% in the transport sector although these figures may be slightly different from those implied by the minimum trajectory path. [13] The following table shows the actual results recorded of renewable energy use by sector:

Renewable energy by sector 2009-2021 [14]
2009201020112012201320142015201620172018201920202021
Heating and cooling sector3.4%3.1%3.7%3.9%4.1%5.2%5.5%5.5%5.9%6.1%7.2%8.1%7.7%
Electricity sector9.1%9.6%9.8%10.4%10.0%10.0%11.1%12.5%13.8%15.1%18.2%26.4%30.4%
Transport sector4.5%3.3%4.8%4.9%5.1%6.2%5.3%4.6%5.9%9.6%12.3%12.6%9.0%
Total consumption4.3%3.9%4.5%4.7%4.8%5.5%5.8%6.0%6.6%7.4%8.9%11.4%12.3%
Total consumption including statistical transfers from other EU members [lower-alpha 1] 4.3%3.9%4.5%4.7%4.8%5.5%5.8%6.0%6.6%7.4%8.9%14.0%12.3%

Actual overall renewable energy use grew from 4.3% in 2009 to 5.5% by 2014. The minimum trajectory planned for 2013-2014 was 5.9% and for 2015-2016 7.6% of total energy use. The Netherlands is regarded as amongst the most likely countries to miss 2020 national renewable energy targets as outlined by the Renewable Energy Directive.

Energy consumption by sector

Projected total gross final energy consumption by sector in 2020.

  Heating and cooling (52.8%)
  Electricity (24.7%)
  Transport (22.5%)

Electricity

Total electricity production by source: [15]
  Gas  Oil and other fossil fuels  Coal  Renewable  Nuclear and other sources
Percentage of electricity generated from renewables: [16]
  Biomass  Solar  Offshore wind  Onshore wind

In 2022, around 40 percent of the electricity consumed in the Netherlands came from renewable sources. Renewable electricity production was up 20 percent compared to the year before. Production from fossil sources fell by 11 percent. Most of the growth in renewable energy production came from solar. [17]

Biomass has historically been the biggest source of renewable electricity, but wind and solar power have increased rapidly in recent years.

Renewable energy sources

Installed wind power in the Netherlands [18]
YearCumulative capacity (in MW)
2001
481
2002
682
2003
908
2004
1,078
2005
1,224
2006
1,561
2007
1,749
2008
2,149
2009
2,225
2010
2,218
2011
2,272
2012
2,391
2013
2,713
2014
2,865
2015
3,431
2016
4,328
2017
4,341
2018
4,393
2019
4,484
2020
6,619
2021
7,800

Wind power

2016 was a record year for new wind turbine installations totalling 887 MW bringing the totalled installed capacity to 4,328 MW by year end. 691 MW of the new installations were offshore. [19] The Dutch government has a target of 6,000 MW of onshore wind power by 2020 and 4,450 MW of offshore wind power by 2023. [20]

In 2017, the Netherlands had 2294 wind turbines. The wind capacity installed at end 2017 will, in a normal wind year, produced 9% of electricity, when the equivalent value for Germany was 16.1% [19] and Portugal 14%. [21]

In 2022 the Netherlands announced it increased its offshore wind target to 21 GW by 2030. That would meet approximately 75% of the countries electricity needs. With this, offshore wind energy makes an important contribution to achieving the increased climate target of 55% less CO2-emissions. [22]

Solar power

By 2017 year end cumulative installed capacity of solar PV power reached a preliminary estimate of 2,749 MW with 700 MW added in that year alone. [23] Whilst the Netherlands saw its capacity grow by the fourth highest in Europe during 2017 its installed capacity per inhabitant remained relatively low at 160.9 Watts per inhabitant compared to the European average of 208.3 Watts per inhabitant. [23]

Biomass

Sources of biomass in the Netherlands include the biogenic fraction of waste that is burned in waste incineration plants. Waste wood is also collected for use in the Netherlands and other EU countries. Manure is used to produce biogas and wood pellets are co-fired in electricity plants. 590 kton of pellets were imported, mostly from the United States of America and around 140 kton from Dutch sources contributing 12 to 13 PJ of primary energy to co-firing in energy plants in 2013–2014. Biofuels are produced in the Netherlands for both domestic and export markets. [24]

Rapeseed and maize crops were hardly used in 2014 to produce biofuels in Holland with reasons cited being the high price of corn and resistance to using food crops for fuel production. Rapeseed is used for well over 1% of the imported biofuels (biodiesel) while corn is used for 11% (bioethanol). Germany was the largest supplier of rape seed in 2014 (53%), followed by Romania (13%). For maize the largest supplier in 2014 was Ukraine (39%), followed by France (24%). Some maize fodder is fermented for biofuel production in Holland. [24]

Biomass gross final consumption (TJ) by energy sector, 2013. (Data extract). [24]
ElectricityHeatTransportTotal
Waste incineration plants7 47311 05318 526
Co-firing of biomass in power stations6 5314176 948
Decentralised electricity production from solid biomass and bioliquid3 9041 4365 340
Total biomass boilers for heating in businesses5 4745 474
- Wood-fired boilers for heating in businesses4 0384 038
- Non-wood-fired boilers for heating in businesses1 4361 436
Total biomass in domestic use17 91017 910
- Wood-burning stoves for domestic use17 64017 640
- Charcoal for domestic consumption270270
Total biogas3 7415 79419 535
- Biogas from landfills2222330455
- Biogas from wastewater treatment plants6991 341-2 040
- Biogas, co-firing of manure1 8911 798-3 689
- Other biogas9292 42213 351
Total liquid biofuels for transport*80212 12212 924
- Bioethanol5 2105 210
- Biodiesel*8026 9127 714
Total biomass21 64942 88612 12376 657
-

*The consumption of biofuels for mobile vehicles in the construction and farming sectors are assigned to the heat sector due to statistical definitions.

Biomass produced 76,657 TJ of energy for final consumption in 2013. The largest share was destined for the heat sector at 42,886TJ followed by the electricity sector at 21, 649T J and then the transport sector with 12,123TJ.

Hydroelectricity

Due to its flat landscape the Netherlands has only very limited hydroelectric resources. In 2014 hydroelectricity produced just 112 Gwh of power out of a total electricity production from all sources of 103,418 GWh. [25]

Heat Pumps

− An interesting source of heat recovery used in the Netherlands is sourced from freshly milked milk, or warm milk. However at 0.3% of total renewable energy production [11] (2010 figures) this source is not likely to accelerate energy transition in the country. Warm milk is still not mentioned in the EU Renewable Energy Directive, nor in international energy statistics and so is not included is gross final consumption figures. It does however provide Dutch farmers with plenty of hot water.

− In 2010, 740,000 dairy cows (about half of the country's total) provided 277 TJ of heat energy avoiding 18,000 tons of CO2 emissions. [11] According to industry sources for every litre of milk cooled, 0.7 litres of warm water is produced. Water pumped through the plate heat exchanger reaches 50 °C to 55 °C. The energy recovered from 1000 litres of milk per day over a year generates heat equal to: 13,100 kWh of electrical energy, 1,900 litres of oil, 1,650 m³ of natural gas or 950 kg of propane gas. [26]

Climate change

In 2008 Prime Minister Jan Peter Balkenende claimed that the Netherlands annually uses €1–1.5 billion (0.3% of national income) to protect against the risks of the sea level rise. Many areas are under sea level in the Netherlands and are protected by dam and dikes. [27] In 2010 the Netherlands supported raising the European Union emission restrictions from 20% to 30%; however, the Netherlands has only committed to reaching the minimum 14% goal for itself. [11]

See also

Notes

  1. A statistical transfer is the administrative purchase by one European member state of a quantity of renewable energy from another member state that has achieved its target and has a surplus. Such a transfer does not involve any physical flow of renewable energy

Related Research Articles

<span class="mw-page-title-main">Renewable energy in the European Union</span>

Renewable energy progress in the European Union (EU) is driven by the European Commission's 2023 revision of the Renewable Energy Directive, which raises the EU's binding renewable energy target for 2030 to at least 42.5%, up from the previous target of 32%. Effective since November 20, 2023, across all EU countries, this directive aligns with broader climate objectives, including reducing greenhouse gas emissions by at least 55% by 2030 and achieving climate neutrality by 2050. Additionally, the Energy 2020 strategy exceeded its goals, with the EU achieving a 22.1% share of renewable energy in 2020, surpassing the 20% target.

<span class="mw-page-title-main">Energy in the United Kingdom</span> Overview of the energy use of the United Kingdom

Energy in the United Kingdom came mostly from fossil fuels in 2021. Total energy consumption in the United Kingdom was 142.0 million tonnes of oil equivalent in 2019. In 2014, the UK had an energy consumption per capita of 2.78 tonnes of oil equivalent compared to a world average of 1.92 tonnes of oil equivalent. Demand for electricity in 2014 was 34.42 GW on average coming from a total electricity generation of 335.0 TWh.

<span class="mw-page-title-main">Renewable energy in Germany</span>

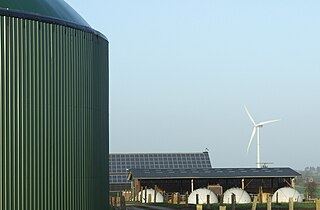
Renewable energy in Germany is mainly based on wind and biomass, plus solar and hydro. Germany had the world's largest photovoltaic installed capacity until 2014, and as of 2023 it has over 82 GW. It is also the world's third country by installed total wind power capacity, 64 GW in 2021 and second for offshore wind, with over 7 GW. Germany has been called "the world's first major renewable energy economy".

<span class="mw-page-title-main">Energy in Denmark</span> Energy and electricity production, consumption, import and export in Denmark

Denmark has considerable sources of oil and natural gas in the North Sea and ranked as number 32 in the world among net exporters of crude oil in 2008. Denmark expects to be self-sufficient with oil until 2050. However, gas resources are expected to decline, and production may decline below consumption in 2020, making imports necessary. Denmark imports around 12% of its energy.

<span class="mw-page-title-main">Energy in Iceland</span> Energy sources in the country of Iceland

Iceland is a world leader in renewable energy. 100% of Iceland's electricity grid is produced from renewable resources. In terms of total energy supply, 85% of the total primary energy supply in Iceland is derived from domestically produced renewable energy sources. Geothermal energy provided about 65% of primary energy in 2016, the share of hydropower was 20%, and the share of fossil fuels was 15%.

<span class="mw-page-title-main">Renewable energy in the United Kingdom</span> Overview of renewable energy in the United Kingdom

Renewable energy in the United Kingdom contributes to production for electricity, heat, and transport.

<span class="mw-page-title-main">Renewable energy in Finland</span> Overview of renewable energy in Finland

Renewable energy in Finland increased from 34% of the total final energy consumption (TFEC) in 2011 to 48% by the end of 2021, primarily driven by bioenergy (38%), hydroelectric power (6.1%), and wind energy (3.3%). In 2021, renewables covered 53% of heating and cooling, 39% of electricity generation, and 20% of the transport sector. By 2020, this growth positioned Finland as having the third highest share of renewables in TFEC among International Energy Agency (IEA) member countries.

<span class="mw-page-title-main">Renewable energy in Spain</span> Overview of renewable energy in Spain

Renewable energy in Spain, comprising bioenergy, wind, solar, and hydro sources, accounted for 15.0% of the Total Energy Supply (TES) in 2019. Oil was the largest contributor at 42.4% of the TES, followed by gas, which made up 25.4%.

<span class="mw-page-title-main">Energy in Finland</span> Overview of the production, consumption, import and export of energy and electricity in Finland

Energy in Finland describes energy and electricity production, consumption and import in Finland. Energy policy of Finland describes the politics of Finland related to energy. Electricity sector in Finland is the main article regarding electricity in Finland.

<span class="mw-page-title-main">Wind power in Italy</span> Overview of wind power in Italy

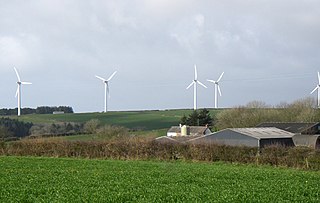
Wind power in Italy, at the end of 2015, consisted of more than 1,847 wind turbines with a total installed capacity of 8,958 megawatts. Wind power contributed 5.4% of Italy electricity generation in 2015 (14,589 GWh). Italy is ranked as the world's tenth producer of wind power as of the end of 2016. Prospects for Italian wind energy beyond 2020 were positive, with several projects planned to go live before 2030.

<span class="mw-page-title-main">Renewable energy in Canada</span> Use of renewable resources in Canada

Renewable energy in Canada represented 17.3% of the Total Energy Supply (TES) in 2020, following natural gas at 39.1% and oil at 32.7% of the TES.

<span class="mw-page-title-main">Energy in Belgium</span>

Energy in Belgium describes energy and electricity production, consumption and import in Belgium.

<span class="mw-page-title-main">Energy in Malta</span> Energy production, consumption and import in Malta

Energy in Malta describes energy production, consumption and import in Malta. Malta has no domestic resource of fossil fuels and no gas distribution network, and relies overwhelmingly on imports of fossil fuels and electricity to cover its energy needs. Since 2015, the Malta–Sicily interconnector allows Malta to be connected to the European power grid and import a significant share of its electricity.

<span class="mw-page-title-main">Energy in the Netherlands</span>

Energy in the Netherlands describes energy and electricity production, consumption and import in the Netherlands. Electricity sector in the Netherlands is the main article of electricity in the Netherlands.

<span class="mw-page-title-main">Renewable energy in Italy</span>

Renewable energy has developed rapidly in Italy over the past decade and provided the country a means of diversifying from its historical dependency on imported fuels. Solar power accounted for around 8% of the total electric production in the country in 2014, making Italy the country with the highest contribution from solar energy in the world that year. Rapid growth in the deployment of solar, wind and bio energy in recent years lead to Italy producing over 40% of its electricity from renewable sources in 2014.

Under its commitment to the EU renewable energy directive of 2009, France has a target of producing 23% of its total energy needs from renewable energy by 2020. This figure breaks down to renewable energy providing 33% of energy used in the heating and cooling sector, 27% of the electricity sector and 10.5% in the transport sector. By the end of 2014, 14.3% of France's total energy requirements came from renewable energy, a rise from 9.6% in 2005.

<span class="mw-page-title-main">Renewable energy in the Republic of Ireland</span>

Under the original 2009 Renewable Energy Directive Ireland had set a target of producing 16% of all its energy needs from renewable energy sources by 2020 but that has been updated by a second Renewable Energy Directive whose targets are 32% by 2030. Between 2005 and 2014 the percentage of energy from renewable energy sources grew from just 3.1% to 8.6% of total final consumption. By 2020 the overall renewable energy share was 13.5%, short of its Renewable Energy Drive target of 16%. Renewable electricity accounted for 69% of all renewable energy used in 2020, up from two thirds (66.8%) in 2019.

Denmark is a leading country in renewable energy production and usage. Renewable energy sources collectively produced 75% of Denmark's electricity generation in 2022, and are expected to provide 100% of national electric power production from 2030. Including energy use in the heating/cooling and transport sectors, Denmark is expected to reach 100% renewable energy in 2050, up from the 34% recorded in 2021.

Biofuels play a major part in the renewable energy strategy of Denmark. Denmark is using biofuel to achieve its target of using 100% renewable energy for all energy uses by 2050. Biofuels provide a large share of energy sources in Denmark when considering all sectors of energy demand. In conjunction with Denmark's highly developed renewable energy resources in other areas, biofuels are helping Denmark meet its ambitious renewable energy targets.

<span class="mw-page-title-main">Renewable energy in Austria</span>

By the end of 2016 Austria already fulfilled their EU Renewables Directive goal for the year 2020. By 2016 renewable energies accounted to 33.5% of the final energy consumption in all sectors. The renewable energy sector is also accountable for hosting 41,591 jobs and creating a revenue of 7,219 million euros in 2016.

References

  1. "Aandeel hernieuwbare energie in 2022 toegenomen naar 15 procen". CBS. 2023-06-02. Retrieved 2023-09-04.
  2. Renewable energy statistics European Commission, januari 2020
  3. "PHOTOVOLTAIC POWER SYSTEMS PROGRAMME ANNUAL REPORT 2018, p91".
  4. "CBS Statline". opendata.cbs.nl (in Dutch). Retrieved 2022-02-13.
  5. Statistiek, Centraal Bureau voor de (2023-06-02). "Hernieuwbare elektriciteit; productie en vermogen". Centraal Bureau voor de Statistiek (in Dutch). Retrieved 2023-09-04.
  6. "Operationele windparken". 2023-09-04. Retrieved 2023-09-04.
  7. "Autoriteit Consument & Markt" (PDF).
  8. "Groene stroom" . Retrieved 2020-10-05.
  9. "Hoeveel personenauto's zijn er in Nederland?". Netherlands Statistics Bureau. Retrieved 4 September 2023.
  10. "Goedkoopste energie? Kies de goedkoopste energieleverancier. Gratis!". Energievergelijking.nl (in Dutch). Retrieved 2 November 2016.
  11. 1 2 3 4 Renewable Energy in the Netherlands 2010, Statistics Netherlands, 2010
  12. 1 2 "National Renewable Energy Action Plans, Directive 2009/28/EC". 29 June 2023.
  13. "The Netherlands, National Renewable Energy Action Plan. pg. 27". 29 June 2023.
  14. "Eurostat - Energy from renewable sources".
  15. "CBS Statline". opendata.cbs.nl (in Dutch). Retrieved 2022-02-13.
  16. "CBS Statline". opendata.cbs.nl (in Dutch). Retrieved 2022-02-13.
  17. Netherlands, Statistics (6 March 2023). "Renewable electricity share up by 20 percent in 2022". Statistics Netherlands. Retrieved 2023-03-06.
  18. GWEC Global Wind Report 2017
  19. 1 2 "GLOBAL WIND REPORT 2016 | GWEC". www.gwec.net. Retrieved 2018-08-21.
  20. "GLOBAL WIND REPORT 2015 | GWEC". www.gwec.net. Retrieved 2016-08-11.
  21. Wind in power 2010 European statistics Archived 2011-04-07 at the Wayback Machine EWEA February 2011 page 11
  22. "New Offshore Wind Energy Roadmap | RVO.nl".
  23. 1 2 "Photovoltaic Barometer 2018". 28 April 2018.
  24. 1 2 3 "2015 Progress Report, Dutch Ministry of Economic Affairs". 29 June 2023.
  25. "International Energy Agency/Statistics/Netherlands/Electricity and Heat for 2014".
  26. "DeLaval.com".
  27. Alankomaissa sata miljardia euroa kuluu merenpinnan nousun estämiseen yle 03.09.2008