Renewable energy in the Republic of Ireland

Last updated

Wind turbines on County Leitrim's Corrie Mountain Corrie Mountain Windfarm 4818 edit.jpg
Wind turbines on County Leitrim's Corrie Mountain
Ireland renewable electricity production by source Ireland renewable electricity production.svg
Ireland renewable electricity production by source

Under the original 2009 Renewable Energy Directive Ireland had set a target of producing 16% of all its energy needs from renewable energy sources by 2020 but that has been updated by a second Renewable Energy Directive whose targets are 32% by 2030. Between 2005 and 2014 the percentage of energy from renewable energy sources grew from just 3.1% to 8.6% of total final consumption. By 2020 the overall renewable energy share was 13.5%, short of its Renewable Energy Drive target of 16%. [1] Renewable electricity accounted for 69% of all renewable energy used in 2020, up from two thirds (66.8%) in 2019. [1]

Contents

The country has a large and growing installed wind power capacity at 4,405 MW by the end of 2021 producing 31% of all its electricity needs in that year. [2] By February 2024, there was 1GW of solar PV capacity connected to the grid. [3] By April 2024, the grid had 1GW of storage capacity with almost 750MW of that capacity in the form of battery storage [4] the rest supplied by Turlough Hill.

Energy consumption by sector

Projected total gross final energy consumption by sector in 2020.

  Heating and cooling (36.6%)
  Electricity (20.9%)
  Transport (42.6%)

According to the Irish National Renewable Energy Action Plan (NREAP), [5] as submitted by all member states as part of the EU Renewable Energy Directive, in 2020 the gross final energy consumption in Ireland by sector is projected to break down as follows:

*Projected energy use by sector in 2020 [5] ktoeRE 2020 target
Heating and cooling4,93112.0%
Electricity2,81342.5%
Transport5,74710.0%
Gross final energy consumption*14,14216.0%

*All figures calculated as per Directive 2009/28/EC

In 2020 the transport sector is expected to comprise 42.6% of final energy consumption. The heating and cooling sector (also known as the thermal sector) includes domestic heating and air conditioning and industrial heat processes is expected to account for 36.6% of final energy consumption The electricity sector is projected to account for 20.9% of consumption.

Total annual energy consumption (after adjustments) is projected to be 14,142 ktoe (14.142 million tonnes of oil equivalent) by 2020. To meet Ireland's overall target of16% use of renewable energy in gross final energy consumption by 2020 (it was just 3.1% in 2005) targets have been set for each sector. By 2020 renewable energy use is targeted to be 12% in the heating and cooling sector, 42.5% in the electricity sector and 10% in the transport sector.

Sources

Wind power

Installed wind power capacity
YearCumulative Capacity (in MW)
2008
1,027
2009
1,260
2010
1,392
2011
1,631
2012
1,749
2013
2,037
2014
2,262
2015
2,486
2016
2,830
2017
3,127
2018
3,564
2019
4,155
2020
4,351
2021
4,405
2022
4,685
Installed windpower capacity (MW) [6] [7] [8] [9] [10] [11] [12] [2] [13]
200820092010201120122013201420152016201720182019202020212022
1,0271,2601,3921,6311,7492,0372,2622,4862,8303,1273,5644,1554,3514,4054,685

Wind power has been growing steadily in the Republic of Ireland by around 200 MW per year rising from 1,027 MW in 2008 to 4,351 MW by year end 2020. The grids of the Republic and Northern Ireland are integrated, and the combined wind power capacity is 5,030 MW. [14] During the year 2020 wind power provided 36.3% of the country's electricity [15] [16] On 5 February 2022 at 17:45, an all-time record was broken in Ireland, with wind generating 3,603 MW. [17]

As of 2022 almost all wind power generation in Ireland is onshore. However, the Irish government plans to have 5 GW of offshore wind capacity built by 2030, with a goal of 35 GW by 2050. [18]

Solar PV

Installed solar PV capacity (MW) [19] [20] [21] [22] [23]
20082009201020112012201320142015201620172018201920202021
0.40.60.60.70.71.01.12.15.115.729.036.092.8136

Solar PV installed capacity in Ireland is amongst the lowest in Europe, it was just over 2MW in 2015. In the same year the corresponding figure for the United Kingdom was 8,915 MW [24] and for Denmark 790 MW. [25] In 2015 the country had the lowest capacity per inhabitant of all EU countries, only Latvia had a lower absolute capacity. [26] Predictions for future growth in installed capacity vary widely from 500 MW by 2021 to 3,700 MW by 2030 with government support. [27]

Solar radiation and photovoltaic electricity potential in Ireland using optimally inclined photovoltaic modules Pvgis solar optimum IE.png
Solar radiation and photovoltaic electricity potential in Ireland using optimally inclined photovoltaic modules

Biomass

Solid biomass and biogas

Biomass use by sector 2014 [28]
Electricity sector Gwh/ ktoeHeating and cooling sector ktoe
Solid biomass330/28222
Biogas206/188.1
Total536/46230.1

*Converted using IEA unit converter.

Solid biomass was used mostly in the heating and cooling sector providing 222 ktoe of energy, it was also used to generate some electricity at 28 ktoe of energy. Biogas was used mostly in the production of electricity contributing 18 ktoe.

Biofuels

Biofuel use in transport (ktoe) [28]
20132014
Bioethanol/ bio-ETBE2927
Of which Biofuels__
Of which imported2924
Biodiesel7490
Of which Biofuels7377
Of which imported5067

In 2014 Biodiesel provided 90 ktoe to the transport sector whilst Bioethanol/Bio-ETBE provided 27 ktoe.

Targets and Progress

Targets

Renewable energy targets and projected consumption (%) 2005–2020, NREAP. [5]
200520102011201220132014201520162017201820192020
RES- Heating and Cooling (%)3.50%4.30%4.90%6.10%6.90%7.70%8.90%9.70%10.10%10.50%11.20%12.00%
RES-Electricity(%)6.90%20.40%24.60%25.30%30.50%31.00%32.40%32.20%33.80%37.50%37.30%42.50%
RES-Transport(%)0.00%3.00%3.90%4.60%5.10%5.50%5.90%6.60%7.40%8.10%8.80%10.00%
Overall RES(%)3.10%6.60%8.10%9.00%10.50%11.00%11.80%12.20%12.90%14.00%14.40%16.00%

Overall renewable energy sources show a target trajectory of 6.6% share in 2010 rising to 14% by 2020. The electricity sector shows the most ambitious trajectory with a rise from 6.9% of total supply in 2005 to 42.5% by 2020.

Progress

Renewable energy results and actual consumption (%) 2013,2014. [28]
20132014
RES- Heating and Cooling (%)5.50%6.60%
RES- Electricity (%)20.80%22.70%
RES- Transport (%)4.90%5.20%
Overall RES share (%)7.60%8.60%

According to Ireland's third progress report, by 2014 the country had achieved an 8.6% share of overall energy use from renewable energy sources. This was below the targeted 11% share planned for that year. Renewable energy use in the electricity sector was the furthest from its target of just over 8 percentage points below its target for the year.

In 2020 Ireland reached its renewable electricity target averaging at 40% renewable through the year (mostly from wind). [15] Heating and cooling and transport targets were not reached.

See also

Related Research Articles

<span class="mw-page-title-main">Renewable energy in the European Union</span>

Renewable energy progress in the European Union (EU) is driven by the European Commission's 2023 revision of the Renewable Energy Directive, which raises the EU's binding renewable energy target for 2030 to at least 42.5%, up from the previous target of 32%. Effective since November 20, 2023, across all EU countries, this directive aligns with broader climate objectives, including reducing greenhouse gas emissions by at least 55% by 2030 and achieving climate neutrality by 2050. Additionally, the Energy 2020 strategy exceeded its goals, with the EU achieving a 22.1% share of renewable energy in 2020, surpassing the 20% target.

<span class="mw-page-title-main">Renewable energy in Spain</span> Overview of renewable energy in Spain

Renewable energy in Spain, comprising bioenergy, wind, solar, and hydro sources, accounted for 15.0% of the Total Energy Supply (TES) in 2019. Oil was the largest contributor at 42.4% of the TES, followed by gas, which made up 25.4%.

<span class="mw-page-title-main">Solar power in the European Union</span>

Solar power consists of photovoltaics (PV) and solar thermal energy in the European Union (EU).

<span class="mw-page-title-main">Solar power in Romania</span> Electricity production in Romania via solar energy

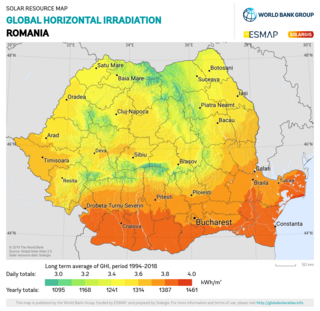
Solar power in Romania had an installed capacity of 1,374 megawatt (MW) as of the end of 2017. The country had in 2007 an installed capacity of 0.30 MW, which increased to 3.5 MW by the end of 2011, and to 6.5 MW by the end of 2012. However, the record year of 2013 was an exception, and new installation fell back from 1,100 MW to a moderate level of 69 MW in 2014.

<span class="mw-page-title-main">Energy in Belgium</span>

Energy in Belgium describes energy and electricity production, consumption and import in Belgium.

<span class="mw-page-title-main">Solar power in Greece</span>

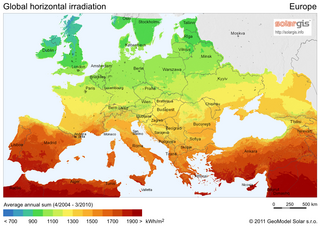
Solar power in Greece has been driven by a combination of government incentives and equipment cost reductions. The installation boom started in the late 2000s with feed-in tariffs has evolved into a market featuring auctions, power purchase agreements, and self-generation. The country's relatively high level of solar insolation is an advantage boosting the effectiveness of solar panels; within Europe, Greece receives 50% more solar irradiation than Germany.

<span class="mw-page-title-main">Energy in Malta</span> Energy production, consumption and import in Malta

Energy in Malta describes energy production, consumption and import in Malta. Malta has no domestic resource of fossil fuels and no gas distribution network, and relies overwhelmingly on imports of fossil fuels and electricity to cover its energy needs. Since 2015, the Malta–Sicily interconnector allows Malta to be connected to the European power grid and import a significant share of its electricity.

The Polish energy sector is the fifth largest in Europe. In 2023, the country consumed 167.52 TWh of electricity, a 3.44% year–on–year decrease from 2022. Out of this, 76.61 TWh came from hard coal, 34.57 TWh from lignite, 22 TWh from wind energy, and 13.65 TWh from gas, with the remainder coming from other sources, such as solar, biomass, and hydropower.

<span class="mw-page-title-main">Poland National Renewable Energy Action Plan</span>

The Poland National Renewable Energy Action Plan is the National Renewable Energy Action Plan (NREAP) for Poland. The plan was commissioned by the Directive 2009/28/EC which required Member States of the European Union to notify the European Commission with a road map. The report describes how Poland planned to achieve its legally binding target of a 15% share of energy from renewable sources in gross final consumption of energy by 2020.

Electricity in Cyprus is managed by the Electricity Authority of Cyprus. Power is primarily generated at three fuel oil-burning stations but the use of distributed renewable energy is expanding.

<span class="mw-page-title-main">Renewable energy in Italy</span>

Renewable energy has developed rapidly in Italy over the past decade and provided the country a means of diversifying from its historical dependency on imported fuels. Solar power accounted for around 8% of the total electric production in the country in 2014, making Italy the country with the highest contribution from solar energy in the world that year. Rapid growth in the deployment of solar, wind and bio energy in recent years lead to Italy producing over 40% of its electricity from renewable sources in 2014.

<span class="mw-page-title-main">Renewable energy in the Netherlands</span>

Despite the historic usage of wind power to drain water and grind grain, the Netherlands today lags 21 of the 26 other member states of the European Union in the consumption of energy from renewable sources. In 2022, the Netherlands consumed just 15% of its total energy from renewables. According to statistics published by Eurostat, it was the last among the EU countries in the shift away from global warming-inducing energy sources. The leading renewable sources in the country are biomass, wind, solar and both geothermal and aerothermal power. In 2018 decisions were made to replace natural gas as the main energy source in the Netherlands with increased electrification being a major part of this process.

Renewable energy in the Czech Republic describes the renewable energy related development in the Energy in the Czech Republic.

<span class="mw-page-title-main">Solar power in Austria</span>

As of the end of 2022, solar power in Austria amounted to nearly 3.8 gigawatt (GW) of cumulative photovoltaic (PV) capacity, with the energy source producing 4.2% of the nation's electricity.

Solar power in France including overseas territories reached an installed capacity figure of 11.2 GW in 2020, and rose further to 17.1 GW at the end of 2022. Government plans announced in 2022 foresee solar PV capacity in France rising to 100 GW by 2050.

<span class="mw-page-title-main">Solar power in Belgium</span> Overview of solar power in Belgium

Solar power in Belgium reached an installed capacity of 9.9 GW at the end of 2023, an increase of 1.8 GW from 2022.

<span class="mw-page-title-main">Solar power in Cyprus</span>

Solar power in Cyprus benefits from over 3,300 hours of sunlight annually, giving it the highest potential in the European Union (EU).

Under its commitment to the EU renewable energy directive of 2009, France has a target of producing 23% of its total energy needs from renewable energy by 2020. This figure breaks down to renewable energy providing 33% of energy used in the heating and cooling sector, 27% of the electricity sector and 10.5% in the transport sector. By the end of 2014, 14.3% of France's total energy requirements came from renewable energy, a rise from 9.6% in 2005.

<span class="mw-page-title-main">Solar power in Poland</span>

Solar energy in Poland includes the production of solar thermal energy and solar photovoltaics. By the end of 2021, there were around 3,000,000 square metres (32,000,000 sq ft) of installed solar thermal collectors which in Poland are primarily used for heating up household water.

Renewable energy in Greece accounted for 29 percent of its electricity from renewable sources in 2021. By 2030, renewables are expected to have a capacity of 28GW, and exceed 61 percent of Greece's electricity consumption. This is a significant increase from 8% of the country's total energy consumption in 2008. By 2022, Greece occasionally reached 100% renewables for a few hours. The target for 2050 is a capacity of 65GW.

References

  1. 1 2 "Renewables". Sustainable Energy Authority Of Ireland. Retrieved 11 January 2022.
  2. 1 2 "Wind energy in Europe: 2021 Statistics and the outlook for 2022-2026". WindEurope. Retrieved 1 May 2022.
  3. "One Giga Watt of solar capacity now connected to electricity grid". RTE. 17 February 2024. Retrieved 18 May 2024.
  4. Ottilie Von Henning (25 April 2024). "ESB reaches 1GW of energy storage on Irish network". CURRENT+-. Retrieved 18 May 2024.
  5. 1 2 3 "European Commission, National action plans".
  6. "Global Wind Energy Council, Global Wind Reports, 2009,2011,2013,2015".
  7. "Wind Statistics". www.iwea.com. 20 April 2017. Retrieved 18 September 2017.
  8. "Global Wind Report 2016" (PDF). files.gwec.net. Retrieved 24 September 2017.
  9. "Wind in power 2017" (PDF). Wind Europe. Retrieved 1 June 2020.
  10. "Wind energy in Europe in 2018" (PDF). Wind Europe. Retrieved 1 June 2020.
  11. "Wind energy in Europe in 2019" (PDF). Wind Europe. Archived (PDF) from the original on 21 February 2021. Retrieved 1 June 2020.
  12. "Wind energy in Europe in 2020 - Trends and statistics". WindEurope. Retrieved 25 February 2021.
  13. "Wind energy in Europe: 2022 Statistics and the outlook for 2023-2027".
  14. "Facts & Stats". www.iwea.com. Archived from the original on 1 June 2020. Retrieved 1 June 2020.
  15. 1 2 "Wind Energy Powers Ireland to Renewable Energy Target". windenergyireland.com. Retrieved 31 January 2021.
  16. "IWEA rebrands as Wind Energy Ireland". 25 January 2021.
  17. "EirGrid Group". EirGrid Group. Retrieved 6 March 2022.
  18. "Ireland's offshore ambitions are starting to take off". windeurope.org. 15 October 2021. Retrieved 25 January 2022.
  19. "EurObserv'ER, Photovoltaic Barometer 2016,2015,2014,2013,2012,2011,2010,2009".
  20. "Photovoltaic barometer 2017 | EurObserv'ER". www.eurobserv-er.org. Retrieved 24 September 2017.
  21. "All Photovoltaic barometers | EurObserv'ER" . Retrieved 29 August 2019.
  22. webmaster. "Photovoltaic barometer 2020 | EurObserv'ER" . Retrieved 1 June 2020.
  23. webmaster (25 February 2022). "20th annual overview barometer". EurObserv'ER. Retrieved 6 March 2022.
  24. "p53 Energy Trends 2016, Department of Energy and Climate Change".
  25. "Ingenoren".
  26. "EurObserv'ER, Photovoltaic-Barometer-2016".
  27. "Newsbase, 14th April 2016".
  28. 1 2 3 "2015 Member State progress report translated into English".