
Renewable energy plays an important and growing role in the energy system of the European Union. The share of energy from renewable sources in gross final consumption of energy was 18% in 2018. This is double the share in 2004 with 8.5%. The Europe 2020 strategy includes a target of reaching 20% of gross final energy consumption from renewable sources by 2020, and at least 32% by 2030. These figures are based on energy use in all its forms across all three main sectors, the heating and cooling sector, the electricity sector and the transport sector.

As of December 2017, installed capacity of wind power in the European Union totaled 169.3 gigawatts (GW). In 2017, a total of 15,680 MW of wind power was installed, representing 55% of all new power capacity, and the wind power generated 336 TWh of electricity, enough to supply 11.6% of the EU's electricity consumption.
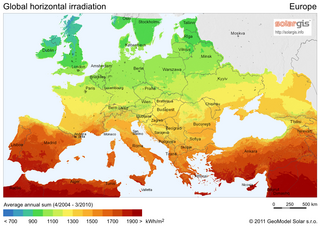
Solar energy in the European Union consists of photovoltaics (PV) and solar thermal energy.

Solar power in Romania had an installed capacity of 1,374 megawatt (MW) as of the end of 2017. The country had in 2007 an installed capacity of 0.30 MW, which increased to 3.5 MW by the end of 2011, and to 6.5 MW by the end of 2012. However, the record year of 2013 was an exception, and new installation fell back from 1,100 MW to a moderate level of 69 MW in 2014.

In 2009, Poland was the world's 9th largest hard coal producer. The country is also the second largest coal consumer in Europe, behind Germany.
Electricity in Cyprus is managed by the Electricity Authority of Cyprus. Power is primarily generated at three fuel oil-burning stations but the use of distributed renewable energy is expanding.

As of the end of 2014, solar power in Austria amounted to 766 megawatt (MW) of cumulative photovoltaic (PV) capacity, of which more than three quarters were installed within the last four years. Solar PV generated 766 gigawatt-hours, or about 1.4% of the country's final electricity consumption. As with most other European countries, 99.5 percent of all solar power systems are connected to the electrical grid. The nation's installed PV capacity by inhabitant stood at 91 watts, still below the European Union's 2014-average of 172 watts.

The Czech Republic had almost two gigawatts (GW) of photovoltaic capacity at the end of 2010, but installed less than 10 megawatts (MW) in 2011 due to the feed-in tariff being reduced by 25%, after installing almost 1,500 MW the year before. Installations increased to 109 MW in 2012. In 2014, no new installations were reported.

Solar power in France including overseas territories reached an installed capacity figure of 9,466 MW by the end of 2018 generating 10,196 GWh of power.

In 2016 Renewable energy in Lithuania constituted 27.9% of the country's overall electricity generation. Previously, the Lithuanian government aimed to generate 23% of total power from renewable resources by 2020, a goal was achieved in 2014 (23.9).

Solar power in Bulgaria has expanded by 100 megawatts (MW) in 2011. A 16.2 MW solar power plant in Zdravetz, Bulgaria was expected to be completed in June 2012, with power being sold for $0.30/kWh in a fixed rate 20 year power purchase agreement.

Solar power in Belgium reached an installed capacity of 4,254 MW of power generating 3,563 GWh of electricity in 2018. In 2015 PV solar power accounted for around 4% of Belgium's total electricity demand, the 4th highest penetration figure in the world, although the country is some way behind the leaders Germany, Italy and Greece at between 7% and 8% of electricity demand.

Solar power in Cyprus is more available than in almost all of the rest of the Europe. The Cypriot target of solar power including both photovoltaics and concentrated solar power is a combined 7% of electricity by 2020, which will be one of the top ones in the European Union markets. Respective targets are Spain 8%, Germany 7%, Greece 5%, Portugal 4% and Malta 1%.

Solar power in the Netherlands has an installed capacity of around 4,300 megawatt (MW) of photovoltaics as of the end of 2018. Around 1,397 MW of new capacity was installed during 2018, the second highest figure in Europe for that year.
Under its commitment to the EU renewable energy directive of 2009, France has a target of producing 23% of its total energy needs from renewable energy by 2020. This figure breaks down to renewable energy providing 33% of energy used in the heating and cooling sector, 27% of the electricity sector and 10.5% in the transport sector. By the end of 2014, 14.3% of France's total energy requirements came from renewable energy, a rise from 9.6% in 2005.

EurObserv'ER is a consortium dedicated to the monitoring of the development of the various sectors of renewable energies in the European Union.

Solar energy in Poland includes the production of solar thermal energy and solar photovoltaics. Solar thermal, used for heating water, used 1,700,000 square metres (18,000,000 sq ft) of installed solar thermal collectors at the end of 2014. This corresponds to about 1,200 MWth capacity. Solar collectors are the second largest source of renewable heat in Poland, after biomass heating plants. In 2014, Poland was ranked fourth in sales of solar collector installations among European countries.
Renewable energy in Greece accounted for 8% of the country's total energy consumption in 2008. 12% of Greece's electricity comes from hydroelectric power plants. In 2015, renewable energy counted for more than 20% of the energy produced in Greece; this excludes energy produced by hydroelectric means, which accounts for more than 8%

Under the Renewable Energy Directive Ireland has set a target of producing 16% of all its energy needs from renewable energy sources by 2020. Between 2005 and 2014 the percentage of energy from renewable energy sources grew from just 3.1% to 8.6% of total final consumption.
The history of photovoltaic growth includes previous forecast and annual deployment figures by country.
