Energy mix

Last updated
World energy mix, 1965 to 2020 World energy mix.svg
World energy mix, 1965 to 2020

The energy mix is a group of different primary energy sources from which secondary energy for direct use - such as electricity - is produced. [1] Energy mix refers to all direct uses of energy, such as transportation and housing, and should not be confused with power generation mix, which refers only to generation of electricity, [2] as electricity only accounts for 20 % of the world's final energy consumption. [3]

Contents

Energy Mixes

World

Primary Energy Consumption, Primary Energy Mix and Power generation Mix in 2022 [4] [5]
Energy SourceEnergy Consumption (TWh)Primary Energy MixElectricity production (TWh)Power Generation Mix
Oil52,96929.6 %9043.15 %
Coal44,85425.1 %10,21235.6 %
Gas39,41322.0 %6,44422.5 %
Hydropower11,3006.32 %4,28915.0 %
Traditional biomass and biofuels12,3106.89 %6752.36 %
Nuclear6,7023.75 %2,6329.18 %
Wind5,4883.07 %2,0987.32 %
Solar3,4481.93 %1,3104.57 %
Other renewables2,4131.53 %96.80.34 %
Total178,897100 %28,661100 %

Overall primary energy consumption in the United States in 2015 relied most on petroleum (35 quadrillion British thermal units (3.7×10¹⁶ kJ)), natural gas (29×10^15 BTU (3.1×10¹⁶ kJ)) and coal (16×10^15 BTU (1.7×10¹⁶ kJ)). Renewables contributed 9×10^15 BTU (9.5×10¹⁵ kJ) and nuclear power 8×10^15 BTU (8.4×10¹⁵ kJ). [6] In the same year, about 4 million GWh of electricity were generated in the United States, 67% of which was generated from fossil fuels (coal, natural gas, and <1% petroleum), 20% from nuclear power, 6% hydropower and 7% other renewables. [7]

World energy consumption 1970 - 2020 World energy consumption.svg
World energy consumption 1970 - 2020

In 2018, the global primary energy source was about 80% fossil fuels: (33.6% oil, 27.2% coal, 23.9% natural gas), 6.8% hydro, 4.4% nuclear, and 4% other renewables, such as wind, thermal, bioenergies, solar, and waste. Energy consumption worldwide rose 2.9%, which is the largest increase since 2010. Europe used less oil than the global percentage, and more nuclear and renewable resources, with France using less gas and more nuclear. North America had the highest consumption per resident, with Russia in second, and Europe and the Middle East following. While North America used 240 gigajoules per capita, Africa used only 15 gigajoules per capita. [8] [9]

Sustainability

Percentages of primary energy sources used to produce electricity worldwide, with forecast Electricity percentage worldwide by source-semilog.png
Percentages of primary energy sources used to produce electricity worldwide, with forecast

As energy consumption rises, attention has turned to more environmentally sustainable practices. 2018 saw the largest increase in worldwide energy consumption since 2010, with 27.2% of that energy coming from coal. The carbon dioxide released when coal is burned to produce energy accounts for 44% of the world's carbon emissions. Petroleum use accounts for nearly 1/3 of the world's carbon emissions. These factors contribute to the global temperature increase. [9]

Many countries, such as Pakistan [10] and Malaysia [11] have begun developing options for more sustainable energy practices. Some of these options include wind, for small to medium-sized projects; solar power; and biomass, which is energy produced from waste products such as rice husks, animal waste, and crop residue. [12]

The IEA has developed a plan, called the Sustainable Development Scenario (SDS), which would lead to an 800 Mtoe decrease in global energy consumption by utilizing changes in the sectors of residential and transport energy. Following this scenario, fossil fuel usage would drop significantly, but it would require a dramatic increase of use of renewable resources, particularly in Asia. [13]

Economic Aspects

Even in the energy mix, there can be monostructures [ clarification needed ]. [14] While renewable energy is almost exclusively produced in Germany (99.2%), there is a high and risky dependence on imports for fossil energy in some instances. [15] To reduce or avoid these monostructures, diversification must change the energy mix so that one-sided import and export dependencies with individual countries are entirely or partially eliminated. Furthermore, the range of fossil energy sources must be taken into account.

The continuous monitoring of dependencies and ranges are the essential tasks of energy policy. For example, if a country primarily exports its goods or services to a single other country, a maximum monostructure exists. This carries the risk that economic crises (for instance, the other country suffers from a lack of foreign currency and can no longer afford the imports) or political conflicts (boycotts, embargoes) could lead to the importing country defaulting. Conversely, the same risk exists with monostructural imports, and it must be minimized by the importing state. The risk to the importing state can be classified as performance risk, and for the exporting state as payment risk. From this perspective, the Nord Stream 2 project contradicts the rules of a diversified energy mix. [16]

The war in Ukraine in 2022 has brought the risks of the German energy mix into focus. The high dependence on imports of energy sources from Russia carries the risk that a conceivable Russian economic sanctions could affect German energy security. As reported by Economics Minister Robert Habeck in March 2022, short-term contracts are intended to reduce dependence on Russian natural gas (from 55% to 30%), crude oil (from 35% to 25%), and coal (from 50% to 25%). [17]

The international energy transition, like the energy transition in Germany, is expected to have huge impacts on the energy mix. Since such energy transitions are carried out through state regulatory intervention, divestments in the extensive fixed assets of operators (closure of mines, decommissioning of nuclear facilities) and investments in future markets (renewable energies) are associated with long-term adjustment measures in the energy industry. Very long service lives could therefore not be realized. [18] For many technical installations that are to be shut down prematurely, the payback period (amortization) had not yet been completed, so that a premature closure subsequently represents a Malinvestment.

See also

Related Research Articles

<span class="mw-page-title-main">Energy development</span> Methods bringing energy into production

Energy development is the field of activities focused on obtaining sources of energy from natural resources. These activities include the production of renewable, nuclear, and fossil fuel derived sources of energy, and for the recovery and reuse of energy that would otherwise be wasted. Energy conservation and efficiency measures reduce the demand for energy development, and can have benefits to society with improvements to environmental issues.

<span class="mw-page-title-main">Energy in Japan</span> Overview of the production, consumption, import and export of energy and electricity in Japan

Japan is a major consumer of energy, ranking fifth in the world by primary energy use. Fossil fuels accounted for 88% of Japan's primary energy in 2019. Japan imports most of its energy due to scarce domestic resources. As of 2022, the country imports 97% of its oil and is the larger LNG importer globally.

<span class="mw-page-title-main">Energy industry</span> Industries involved in the production and sale of energy

The energy industry is the totality of all of the industries involved in the production and sale of energy, including fuel extraction, manufacturing, refining and distribution. Modern society consumes large amounts of fuel, and the energy industry is a crucial part of the infrastructure and maintenance of society in almost all countries.

<span class="mw-page-title-main">Energy in the United States</span>

Energy in the United States is obtained from a diverse portfolio of sources, although the majority came from fossil fuels in 2021, as 36% of the nation's energy originated from petroleum, 32% from natural gas, and 11% from coal. Electricity from nuclear power supplied 8% and renewable energy supplied 12%, which includes biomass, wind, hydro, solar and geothermal.

The energy policy of India is to increase the locally produced energy in India and reduce energy poverty, with more focus on developing alternative sources of energy, particularly nuclear, solar and wind energy. Net energy import dependency was 40.9% in 2021-22.

Energy planning has a number of different meanings, but the most common meaning of the term is the process of developing long-range policies to help guide the future of a local, national, regional or even the global energy system. Energy planning is often conducted within governmental organizations but may also be carried out by large energy companies such as electric utilities or oil and gas producers. These oil and gas producers release greenhouse gas emissions. Energy planning may be carried out with input from different stakeholders drawn from government agencies, local utilities, academia and other interest groups.

<span class="mw-page-title-main">Energy security</span> National security considerations of energy availability

Energy security is the association between national security and the availability of natural resources for energy consumption. Access to cheaper energy has become essential to the functioning of modern economies. However, the uneven distribution of energy supplies among countries has led to significant vulnerabilities. International energy relations have contributed to the globalization of the world leading to energy security and energy vulnerability at the same time.

<span class="mw-page-title-main">Energy policy of China</span> Energy sources used and produced by China

China is both the world's largest energy consumer and the largest industrial country, and ensuring adequate energy supply to sustain economic growth has been a core concern of the Chinese Government since the founding of the People's Republic of China in 1949. Since the country's industrialization in the 1960s, China is currently the world's largest emitter of greenhouse gases, and coal in China is a major cause of global warming. However, from 2010 to 2015 China reduced energy consumption per unit of GDP by 18%, and CO2 emissions per unit of GDP by 20%. On a per-capita basis, China was only the world's 51st largest emitter of greenhouse gases in 2016. China is also the world's largest renewable energy producer, and the largest producer of hydroelectricity, solar power and wind power in the world. The energy policy of China is connected to its industrial policy, where the goals of China's industrial production dictate its energy demand managements.  

<span class="mw-page-title-main">Fossil fuel phase-out</span> Gradual reduction of the use and production of fossil fuels

Fossil fuel phase-out is the gradual reduction of the use and production of fossil fuels to zero, to reduce deaths and illness from air pollution, limit climate change, and strengthen energy independence. It is part of the ongoing renewable energy transition, but is being hindered by fossil fuel subsidies.

<span class="mw-page-title-main">Energy in New Zealand</span>

Despite abundant natural resources and a relatively small population, New Zealand is a net importer of energy, in the form of petroleum products. The ratio of non-renewable and renewable energy sources was fairly consistent from 1975 to 2008, with about 70 per cent of primary energy supply coming from hydrocarbon fuels. This ratio decreased to about 60 per cent in 2018. The proportion of non-renewable energy varies annually, depending on water flows into hydro-electricity lakes and demand for energy. In 2018, approximately 60% of primary energy was from non-renewable hydrocarbon fuels and 40% was from renewable sources. In 2007 energy consumption per capita was 120 gigajoules. Per capita energy consumption had increased 8 per cent since 1998. New Zealand uses more energy per capita than 17 of 30 OECD countries. New Zealand is one of 13 OECD countries that does not operate nuclear power stations.

<span class="mw-page-title-main">Energy in Germany</span>

Energy in Germany is obtained for the vast majority from fossil sources, accounting for 77.6% of total energy consumption in 2023, followed by renewables at 19.6%, and 0.7% nuclear power. As of 2023, German primary energy consumption amounted to 10,791 Petajoule, making it the ninth largest global primary energy consumer. The total consumption has been steadily declining from its peak of 14,845 Petajoule in 2006. In 2023 Germany's gross electricity production reached 508.1 TWh, down from 569.2 TWh in 2022, and 631.4 TWh in 2013.

An energy market is a type of commodity market on which electricity, heat, and fuel products are traded. Natural gas and electricity are examples of products traded on an energy market. Other energy commodities include: oil, coal, carbon emissions, nuclear power, solar energy and wind energy. Due to the difficulty in storing and transporting energy, current and future prices in energy are rarely linked. This is because energy purchased at a current price is difficult to store and then sell at a later date. There are two types of market schemes : spot market and forward market.

<span class="mw-page-title-main">Energy in Finland</span> Overview of the production, consumption, import and export of energy and electricity in Finland

Energy in Finland describes energy and electricity production, consumption and import in Finland. Energy policy of Finland describes the politics of Finland related to energy. Electricity sector in Finland is the main article regarding electricity in Finland.

<span class="mw-page-title-main">Environmental impact of the energy industry</span>

The environmental impact of the energy industry is significant, as energy and natural resource consumption are closely related. Producing, transporting, or consuming energy all have an environmental impact. Energy has been harnessed by human beings for millennia. Initially it was with the use of fire for light, heat, cooking and for safety, and its use can be traced back at least 1.9 million years. In recent years there has been a trend towards the increased commercialization of various renewable energy sources. Scientific consensus on some of the main human activities that contribute to global warming are considered to be increasing concentrations of greenhouse gases, causing a warming effect, global changes to land surface, such as deforestation, for a warming effect, increasing concentrations of aerosols, mainly for a cooling effect.

<span class="mw-page-title-main">Energy in Italy</span> Overview of the production, consumption, import and export of energy and electricity in Italy

Energy in Italy comes mostly from fossil fuels. Among the most used resources are petroleum, natural gas, coal and renewables. Italy has few energy resources, and most supplies are imported.

<span class="mw-page-title-main">Energy in Turkey</span> Energy used and produced in Turkey

Energy consumption per person in Turkey is similar to the world average, and over 85 per cent is from fossil fuels. From 1990 to 2017 annual primary energy supply tripled, but then remained constant to 2019. In 2019, Turkey's primary energy supply included around 30 per cent oil, 30 per cent coal, and 25 per cent gas. These fossil fuels contribute to Turkey's air pollution and its above average greenhouse gas emissions. Turkey mines its own lignite but imports three-quarters of its energy, including half the coal and almost all the oil and gas it requires, and its energy policy prioritises reducing imports.

<span class="mw-page-title-main">Energy in Ireland</span> Overview of energy in Ireland

Ireland is a net energy importer. Ireland's import dependency decreased to 85% in 2014. The cost of all energy imports to Ireland was approximately €5.7 billion, down from €6.5 billion (revised) in 2013 due mainly to falling oil and, to a lesser extent, gas import prices. Consumption of all fuels fell in 2014 with the exception of peat, renewables and non-renewable wastes.

<span class="mw-page-title-main">Energy in Slovenia</span> Overview of the production, consumption, import and export of energy and electricity in Slovenia

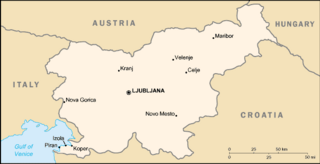
Total primary energy supply (TPES) in Slovenia was 6.80 Mtoe in 2019. In the same year, electricity production was 16.1 TWh, consumption was 14.9 TWh.

<i>Energiewende</i> Ongoing energy transition in Germany

The Energiewende is the ongoing energy transition by Germany to a low carbon, environmentally sound, reliable, and affordable energy supply. The new system intends to rely heavily on renewable energy, energy efficiency, and energy demand management.

<span class="mw-page-title-main">World energy supply and consumption</span> Global production and usage of energy

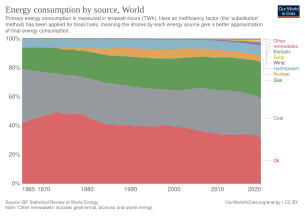
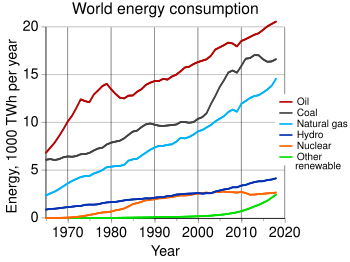
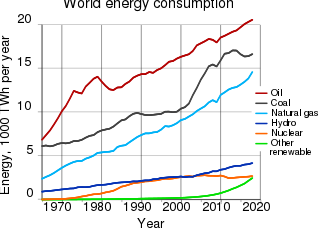
World energy supply and consumption refers to the global supply of energy resources and its consumption. The system of global energy supply consists of the energy development, refinement, and trade of energy. Energy supplies may exist in various forms such as raw resources or more processed and refined forms of energy. The raw energy resources include for example coal, unprocessed oil & gas, uranium. In comparison, the refined forms of energy include for example refined oil that becomes fuel and electricity. Energy resources may be used in various different ways, depending on the specific resource, and intended end use. Energy production and consumption play a significant role in the global economy. It is needed in industry and global transportation. The total energy supply chain, from production to final consumption, involves many activities that cause a loss of useful energy.

References

  1. "About the Energy Mix".
  2. "What is the Power Generation Mix?" . Retrieved 2020-09-16.
  3. "Electricity - Energy System". IEA. Retrieved 2024-02-16.
  4. "Global primary energy consumption by source". Our World in Data. Retrieved 2024-02-16.
  5. "Electricity production by source". Our World in Data. Retrieved 2024-02-16.
  6. "Changing U.S. energy mix reflects growing use of natural gas, petroleum, and renewables". July 21, 2016. Retrieved 2016-08-15.
  7. "FAQ: What is U.S. electricity generation by energy source?". U.S. Energy Information Administration (EIA). Retrieved 2016-08-15.
  8. "Primary Energy Consumption in 2018". Archived from the original on 2020-12-01. Retrieved 2020-09-16.
  9. 1 2 Nunez, Christina (2019-04-02). "Fossil fuels, explained". National Geographic . Archived from the original on August 27, 2019.
  10. "Life cycle sustainability assessment of electricity generation in Pakistan: Policy regime for a sustainable energy mix" (PDF). Archived from the original (PDF) on 2022-11-25. Retrieved 2020-09-16.
  11. "Renewable energy for continuous energy sustainability in Malaysia" (PDF). Archived from the original (PDF) on 2022-04-08. Retrieved 2020-09-16.
  12. "Sustainable energy options for Pakistan" . Retrieved 2020-09-16.
  13. "The World's Projected Energy Mix, 2018-2040". 3 February 2020. Retrieved 2020-09-16.
  14. Fränkische Geographische Gesellschaft (Hrsg.), Mitteilungen der Fränkischen Geographischen Gesellschaft, Band 49, 2002, S. 107
  15. "Ukrainekrise: So abhängig ist Deutschland von russischem Öl und Gas". CHEMIE TECHNIK (in German). Retrieved 2024-03-24.
  16. Götz Grothus, Fünf nach Zwölf: Eine Momentaufnahme, 2021, S. 72
  17. tagesschau.de. "Weltwirtschaft - aktuelle Nachrichten". tagesschau.de (in German). Retrieved 2024-03-24.
  18. Holstenkamp, Lars; Radtke, Jörg (2017-10-03). Handbuch Energiewende und Partizipation (in German). Springer-Verlag. ISBN   978-3-658-09416-4.