
Many countries and territories have installed significant solar power capacity into their electrical grids to supplement or provide an alternative to conventional energy sources. Solar power plants use one of two technologies:

Spain is one of the first countries to deploy large-scale solar photovoltaics, and is the world leader in concentrated solar power (CSP) production.

Solar power accounted for an estimated 8.2 per cent of electricity in Germany in 2019, which was almost exclusively from photovoltaics (PV). About 1.5 million photovoltaic systems were installed around the country in 2014, ranging from small rooftop systems, to medium commercial and large utility-scale solar parks. Germany's largest solar farms are located in Meuro, Neuhardenberg, and Templin with capacities over 100 MW.

Solar power is a growing source in the Portuguese energy mix. At the end of 2020, solar power installed capacity totalled 1.03 GW and represented 3.6% of total power generation in 2020.

China is the largest market in the world for both photovoltaics and solar thermal energy. China's photovoltaic industry began by making panels for satellites, and transitioned to the manufacture of domestic panels in the late 1990s. After substantial government incentives were introduced in 2011, China's solar power market grew dramatically: the country became the world's leading installer of photovoltaics in 2013. China surpassed Germany as the world's largest producer of photovoltaic energy in 2015, and became the first country to have over 100 GW of total installed photovoltaic capacity in 2017.

Historically, the main applications of solar energy technologies in Canada have been non-electric active solar system applications for space heating, water heating and drying crops and lumber. In 2001, there were more than 12,000 residential solar water heating systems and 300 commercial/ industrial solar hot water systems in use. These systems presently comprise a small fraction of Canada's energy use, but some government studies suggest they could make up as much as five percent of the country's energy needs by the year 2025.

Solar power in Japan has been expanding since the late 1990s. The country is a major manufacturer and exporter of photovoltaics (PV) and a large installer of domestic PV systems, with most of them grid connected.
Between 1992 and 2022, the worldwide usage of photovoltaics (PV) increased exponentially. During this period, it evolved from a niche market of small-scale applications to a mainstream electricity source. From 2016-2022 it has seen an annual capacity and production growth rate of around 26%- doubling approximately every three years.
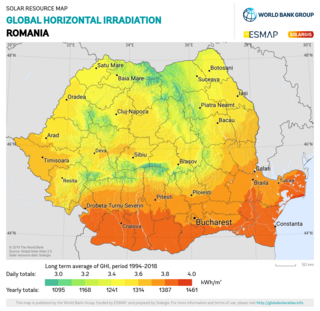
Solar power in Romania had an installed capacity of 1,374 megawatt (MW) as of the end of 2017. The country had in 2007 an installed capacity of 0.30 MW, which increased to 3.5 MW by the end of 2011, and to 6.5 MW by the end of 2012. However, the record year of 2013 was an exception, and new installation fell back from 1,100 MW to a moderate level of 69 MW in 2014.

Energy in Austria describes energy and electricity production, consumption and import in Austria. Austria is very reliant on hydro as an energy source, supported by imported oil and natural gas supplies. It is planned by 2030 to become 100% electricity supplied by renewable sources, primarily hydro, wind and solar.
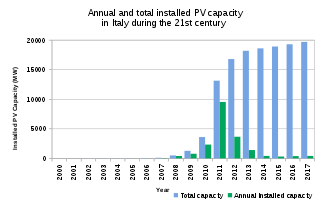
Solar power is an important contributor to electricity generation in Italy, accounting for 8% of the total in 2017. As of 2022, the country has a total installed capacity of 22.56 GW. In 2019, Italy set a national goal of reaching 50 GW by 2030.
Solar power in France including overseas territories reached an installed capacity figure of 11.2 GW in 2020, and rose further to 17.1 GW at the end of 2022. Government plans announced in 2022 foresee solar PV capacity in France rising to 100 GW by 2050.

Solar power in Mexico has the potential to produce vast amounts of energy. 70% of the country has an insolation of greater than 4.5 kWh/m2/day. Using 15% efficient photovoltaics, a square 25 km (16 mi) on each side in the state of Chihuahua or the Sonoran Desert could supply all of Mexico's electricity.

Solar power in South Africa includes photovoltaics (PV) as well as concentrated solar power (CSP). In 2016, South Africa had 1,329 MW of installed solar power capacity. Installed capacity is expected to reach 8,400 MW by 2030.

Solar power in Thailand is targeted to reach 6,000 MW by 2036. In 2013 installed photovoltaic capacity nearly doubled and reached 704 MW by the end of the year. At the end of 2015, with a total capacity of 2,500-2,800 MW, Thailand has more solar power capacity than all the rest of Southeast Asia combined.

Solar power generated 12% of Bulgaria’s electricity in 2023.

Solar power in Belgium reached an installed capacity of 4,254 MW of power generating 3,563 GWh of electricity in 2018. In 2015 PV solar power accounted for around 4% of Belgium's total electricity demand, the 4th highest penetration figure in the world, although the country is some way behind the leaders Germany, Italy and Greece at between 7% and 8% of electricity demand.
Under its commitment to the EU renewable energy directive of 2009, France has a target of producing 23% of its total energy needs from renewable energy by 2020. This figure breaks down to renewable energy providing 33% of energy used in the heating and cooling sector, 27% of the electricity sector and 10.5% in the transport sector. By the end of 2014, 14.3% of France's total energy requirements came from renewable energy, a rise from 9.6% in 2005.

Solar power in Switzerland has been growing rapidly in recent years due to declining system costs and a feed-in tariff instituted by the Swiss government. In 2013, cumulative capacity increased by 69% to 730 megawatts (MW) and contributed 544 GWh or 0.8% of the countries net-electricity production.
The history of photovoltaic growth includes previous forecast and annual deployment figures by country.

