Solar power in Belgium

Last updated

Solar potential in Belgium Belgium GHI Solar-resource-map GlobalSolarAtlas World-Bank-Esmap-Solargis.png
Solar potential in Belgium

Solar power in Belgium reached an installed capacity of 9.9 GW at the end of 2023, an increase of 1.8 GW from 2022. [1]

Contents

Belgium had 4,254 MW of solar power generating 3,563 GWh of electricity in 2018. [2] In 2015 PV solar power accounted for around 4% of Belgium's total electricity demand, the 4th highest penetration figure in the world, although the country is some way behind the leaders Germany, Italy and Greece at between 7% and 8% of electricity demand. [3] Installed capacity grew at an outstanding pace from 2008 until 2012, but growth then slowed to a steady pace before the large increases in 2022. Almost all of solar power in Belgium is grid connected. [3]

Timeline

Belgium Growth of PV Capacity
in megawatts since 2005
Source: EPIA and IEA-PVPS [4] [5] [6] [1]
1,000
2,000
3,000
4,000
2005
2007
2009
2011
2013
2015
2017
YearPhotovoltaics [7] [8] [9] [10] [11]
MWpGWhRef
200871n.a
2009574488
2010787560
20112,0511,170
20122,7682,115
20132,9832,352
20143,1402,883 [3]
20153,2523,045 [12]
20163,5613,086 [13]
20173,8463,149 [13]
20184,2543,563 [2]
20193,528 [14]
20204,259 [14]
20214,678 [14]
20226,413 [14]
20239,9007,193 [1] [14]
Source: Photovoltaic Barometer

2007

Installed capacity of solar power increased drastically after 2007. [15] During 2009 the amount of solar installations quadrupled from 16,000 to 65,000. Residential and small installations had a combined power of about 220 MWp. [16]

2009

In December 2009, there were 35,500 solar power installations in the Flemish region, 17,000 in Wallonia and 7,000 in the Brussels Capital Region. [17] The number of installations in the Flemish region in particular was expanding rapidly at that time due to a favourable support measure expiring at the end of the year. [18]

2011

At the end of 2011 the bulk of photovoltaic capacity was installed in the Flemish Region (88%), the remaining 12% was found mostly in Wallonia. The smaller Brussels-Capital Region had an installed capacity of 7 MWp. . [19]

2013

In 2013, Belgium's watt per capita distribution, the total installed photovoltaic capacity per inhabitant, amounted to 267 watts. This was the third highest per-capita figure in the European Union—and therefore also in the world at that time—just behind Germany (447 watts) and Italy (295 watts). [20] In terms of the overall installed capacity of 2,983 MW, Belgium ranked tenth and belonged to the Top 10 leading photovoltaic countries in the world. [21] [22]

2014

In the afternoon of 20 March 2014, a new record of peak electricity generation had been achieved. According to the power supplier Eneco Energie, more than two gigawatt of electric power, corresponding to two full-sized nuclear power plants, were generated by solar PV and supplied more than 20 percent of the overall electricity consumption at the time. [23]

2015

In 2015 Solar PV per capita amounted to 287 Watts, the third highest in the world after Germany and Italy, providing around 4% of Belgium's total electricity demand. [3]

2016

Solar PV per capita grew to 302.8 Watts, remaining the third highest in the EU. [12]

2022

OVAM, the public waste agency of the Flemish-speaking macro-region of Flanders, has created an online map of the region's 2,500 landfills. They cover a total surface area of more than 100 square kilometers.

The agency said most of the sites are currently inactive. Only 2% of the region's waste is being brought to such locations. [24]

Solar PV market by segment

Installed Capacity in Belgium by class size 2017 [25]
<10 kW62.89%
10-100 kW17.71%
>250 kW19.39%

Nearly 63% of solar power installed in Belgium in 2017 was for small systems of less than 10 kW, mostly residential rooftop Solar PV. Larger systems over 250 kW accounted for almost 20% of the total.

Residential Solar PV Capacity

According to a report on behalf of the European Commission in 2015 Belgium Flanders had an estimated 1,301 MW (666 MW) of residential solar PV capacity with 336,000 (232,000) residential solar PV prosumers in the country representing 7.1% (3.7%) of households. [26] The average size of residential solar PV systems is estimated to be 3.87 kW moving to 2030. [26] The technical potential for residential solar PV in Belgium Flanders is estimated at 7,327 MW and Belgium Wallonia at 3,753 MW . [26] The payback time for residential Solar PV in Belgium Flanders was 14.7 years whilst in Belgium Wallonia it was 6.9 years as of 2015. [26] Some of the advantages of small scale residential Solar include eliminating the need for extra land, keeping cost saving advantages in local communities and empowering households to become prosumers of renewable electricity and thus raising awareness of wasteful consumption habits and environmental issues through direct experience.

Flanders

As of July 2012 there are 42,644 photovoltaic installations in the Flemish region that receive green certificates. [27]

Installed capacity (MWp) by the end of the year [28]
Year Antwerp Limburg East Flanders Flemish Brabant West Flanders Total
20061.10.90.81.10.74.5
20073.83.73.63.34.218.5
200818.512.117.311.416.475.6
200991.447.0102.454.889.3384.9
2010156.594.5186.097.6167.1701.7
2011357.6329.8340.1185.9362.81576.1
2012464.9421.3429.9234.4449.11999.7
2013477.7427.4465.8243.1464.82078.9
2014490.3436.7477.1249.5472.92126.5
2015513.9455.4491.0258.0485.82204.2
2016543.4479.6524.5276.7512.22336.5
2017589.9512.0576.4304.9556.72539.9
2018643.2545.8639.6343.2610.82782.6
2019718.3657.1734.5390.8692.73193.3
2020884.4801.8914.4502.0877.53980.2
2021985.0849.91004.0562.9958.74360.4
20221144.3956.71164.4663.61093.95023.0
20231407.21104.91425.1817.81316.46171.3

Subsidies

Towards 2011, it became clear that Flemish subsidies for solar panels had a significant impact on the cost of electricity of households without a photovoltaic installation. An added cost of up to 148 EUR is charged annually. Flemish minister for Energy Freya van den Bossche admitted that subsidies were too high, especially for large-scale installations. [29] The guaranteed minimum price for electricity produced was reduced. For small photovoltaic installations(less than 1 MW) it was reduced from 330 EUR per MWh to 250 EUR per MWh by January 2012 with the goal of reaching renewable energy targets at a reasonable cost. [30] This resulted in a rally which caused the number of installations to almost double from 20,514 to 37,355 in 2011. [27] The minimum price will be lowered further to 93 EUR per MWh from 2013 onwards.

Notable installations

A solar park of 100MW is set to be built near the town of Lommel, in the Flemish province of Limburg. Construction will start in September 2018 and will be completed mid-2019. It will produce 83 GWh per year equivalent of the consumption of 24000 households. [31]

In 2011 a 3-kilometre (2-mile) above ground "tunnel", built to avoid having to fell trees for a new high-speed railroad, was covered with solar panels. [32] [33]

Photovoltaic power station in Belgium Solar panels in Belgium back view.jpg
Photovoltaic power station in Belgium

In December 2009, Katoen Natie announced that they will install 800,000 m² of solar panels in various places, including Antwerp. It is expected that the installed solar power in the Flemish Region will be increased by 25%, when finished. That will be the largest installation in Europe. The installation produces about 35 GWh yearly. [34] The total cost will be 166 million euros. [35]

In October 2009, the city of Antwerp announced that they want to install 2,500 m² of solar panels on roofs of public buildings, that will generate 265 MWh per annum. [36]

In 2009, the city of Leuven installed 1,810 solar panels on public buildings. [37]


Wallonia

Installed capacity (MWp) [38]
YearTotal capacity
200814
200963
2010112
2011266
2012556
2013745
2014806
2015843
2016902
2017986
20181095
20191233
20201340
20211502
20221655

See also

Related Research Articles

<span class="mw-page-title-main">Solar power by country</span>

Many countries and territories have installed significant solar power capacity into their electrical grids to supplement or provide an alternative to conventional energy sources. Solar power plants use one of two technologies:

<span class="mw-page-title-main">Solar power in Spain</span>

Spain is one of the first countries to deploy large-scale solar photovoltaics, and is the world leader in concentrated solar power (CSP) production.

<span class="mw-page-title-main">Solar power in Germany</span>

Solar power accounted for an estimated 10.7% electricity in Germany in 2022, up from 1.9% in 2010 and less than 0.1% in 2000.

<span class="mw-page-title-main">Solar power in the United Kingdom</span>

Solar power has a small role in electricity production in the United Kingdom.

<span class="mw-page-title-main">Solar power in Portugal</span>

Solar power is a growing source in the Portuguese energy mix. At the end of 2020, solar power installed capacity totalled 1.03 GW and represented 3.6% of total power generation in 2020.

<span class="mw-page-title-main">Solar power in the European Union</span>

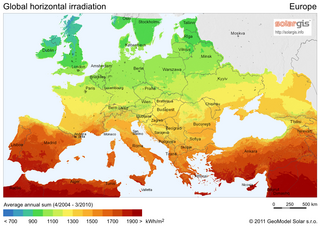
Solar power consists of photovoltaics (PV) and solar thermal energy in the European Union (EU).

<span class="mw-page-title-main">Solar power in Romania</span> Electricity production in Romania via solar energy

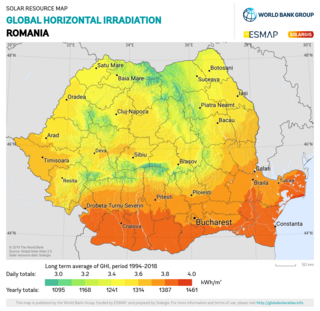
Solar power in Romania had an installed capacity of 1,374 megawatt (MW) as of the end of 2017. The country had in 2007 an installed capacity of 0.30 MW, which increased to 3.5 MW by the end of 2011, and to 6.5 MW by the end of 2012. However, the record year of 2013 was an exception, and new installation fell back from 1,100 MW to a moderate level of 69 MW in 2014.

<span class="mw-page-title-main">Energy in Belgium</span>

Energy in Belgium describes energy and electricity production, consumption and import in Belgium.

<span class="mw-page-title-main">Solar power in Greece</span>

Solar power in Greece has been driven by a combination of government incentives and equipment cost reductions. The installation boom started in the late 2000s with feed-in tariffs has evolved into a market featuring auctions, power purchase agreements, and self-generation. The country's relatively high level of solar insolation is an advantage boosting the effectiveness of solar panels; within Europe, Greece receives 50% more solar irradiation than Germany.

<span class="mw-page-title-main">Solar power in Italy</span>

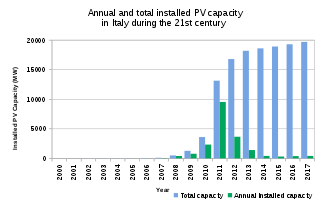
Solar power is an important contributor to electricity generation in Italy, accounting for 8% of the total in 2017. As of 2022, the country has a total installed capacity of 22.56 GW. In 2019, Italy set a national goal of reaching 50 GW by 2030.

<span class="mw-page-title-main">Solar power in Austria</span>

As of the end of 2022, solar power in Austria amounted to nearly 3.8 gigawatt (GW) of cumulative photovoltaic (PV) capacity, with the energy source producing 4.2% of the nation's electricity.

<span class="mw-page-title-main">Solar power in the Czech Republic</span>

The Czech Republic had almost two gigawatts (GW) of photovoltaic capacity at the end of 2010, but installed less than 10 megawatts (MW) in 2011 due to the feed-in tariff being reduced by 25%, after installing almost 1,500 MW the year before. Installations increased to 109 MW in 2012. In 2014, no new installations were reported.

Solar power in France including overseas territories reached an installed capacity figure of 11.2 GW in 2020, and rose further to 17.1 GW at the end of 2022. Government plans announced in 2022 foresee solar PV capacity in France rising to 100 GW by 2050.

<span class="mw-page-title-main">Solar power in Mexico</span> Overview of solar power in Mexico

Solar power in Mexico has the potential to produce vast amounts of energy. 70% of the country has an insolation of greater than 4.5 kWh/m2/day. Using 15% efficient photovoltaics, a square 25 km (16 mi) on each side in the state of Chihuahua or the Sonoran Desert could supply all of Mexico's electricity.

<span class="mw-page-title-main">Solar power in South Africa</span> Overview of the use of solar power in South Africa

Solar power in South Africa includes photovoltaics (PV) as well as concentrated solar power (CSP). As of 2023, South Africa had over 2700 MW of installed PV solar power capacity in its grid, in addition to 500 MW of CSP. Installed capacity is expected to reach 8,400 MW by 2030.

<span class="mw-page-title-main">Solar power in Bulgaria</span>

Solar power generated 12% of Bulgaria’s electricity in 2023.

<span class="mw-page-title-main">Solar power in the Netherlands</span>

Solar power in the Netherlands has an installed capacity of around 23,904 megawatt (MW) of photovoltaics as of the end of 2023. Around 4,304 MW of new capacity was installed during 2023.

Under its commitment to the EU renewable energy directive of 2009, France has a target of producing 23% of its total energy needs from renewable energy by 2020. This figure breaks down to renewable energy providing 33% of energy used in the heating and cooling sector, 27% of the electricity sector and 10.5% in the transport sector. By the end of 2014, 14.3% of France's total energy requirements came from renewable energy, a rise from 9.6% in 2005.

<span class="mw-page-title-main">Solar power in Poland</span>

Solar energy in Poland includes the production of solar thermal energy and solar photovoltaics. By the end of 2021, there were around 3,000,000 square metres (32,000,000 sq ft) of installed solar thermal collectors which in Poland are primarily used for heating up household water.

<span class="mw-page-title-main">Renewable energy in the Republic of Ireland</span>

Under the original 2009 Renewable Energy Directive Ireland had set a target of producing 16% of all its energy needs from renewable energy sources by 2020 but that has been updated by a second Renewable Energy Directive whose targets are 32% by 2030. Between 2005 and 2014 the percentage of energy from renewable energy sources grew from just 3.1% to 8.6% of total final consumption. By 2020 the overall renewable energy share was 13.5%, short of its Renewable Energy Drive target of 16%. Renewable electricity accounted for 69% of all renewable energy used in 2020, up from two thirds (66.8%) in 2019.

References

  1. 1 2 3 Casey, J. P. (19 March 2024). "PV Data: Belgium breaks solar records in 2023, but questions remain in 2024". PV Tech.
  2. 1 2 "2019". EurObserv'ER . Retrieved 29 August 2019.
  3. 1 2 3 4 "Photovoltaic Barometer 2016". 28 November 2015.
  4. "Global Market Outlook for Photovoltaics 2014–2018" (PDF). epia.org. EPIA – European Photovoltaic Industry Association. p. 34. Archived from the original (PDF) on 25 June 2014. Retrieved 12 June 2014.
  5. collected historical data from article growth of photovoltaics
  6. "Snapshot of Global PV 1992–2014" (PDF). iea-pvps.org/index.php?id=32. International Energy Agency – Photovoltaic Power Systems Programme. 30 March 2015. Archived from the original on 7 April 2015.
  7. Photovoltaic Barometer 2012
  8. Photovoltaic Barometer 2010
  9. Photovoltaic Barometer 2011
  10. Photovoltaic Barometer
  11. EUROBSER'VER. "Photovoltaic Barometer – installations 2012 and 2013" (PDF). energies-renouvelables.org. pp. 5, 6. Archived (PDF) from the original on 13 May 2014. Retrieved 21 June 2014.
  12. 1 2 "Photovoltaic barometer 2017 | EurObserv'ER". www.eurobserv-er.org. 28 November 2016. Retrieved 3 December 2017.
  13. 1 2 "Photovoltaic barometer 2018". 28 April 2018.
  14. 1 2 3 4 5 "Bijna 10 procent stroom in België afkomstig van zonnepanelen". Solar Magazine (in Dutch). Retrieved 9 January 2024.
  15. Market growth of solar power in Flanders
  16. Feiten en tendenzen 2009
  17. Le nombre de panneaux solaires explose
  18. 50.000 Vlaamse gezinnen hebben zonnepanelen eind 2009
  19. "Het geïnstalleerde PV-vermogen in Vlaanderen, Wallonië en Brussel" (in Dutch). architectura.be. 15 February 2012. Retrieved 30 November 2012.
  20. EUROBSER'VER. "Photovoltaic Barometer – installations 2012 and 2013" (PDF). energies-renouvelables.org. pp. 5, 6. Archived (PDF) from the original on 13 May 2014. Retrieved 21 June 2014.
  21. Snapshot of Global PV 1992–2013 (PDF) (2nd ed.). International Energy Agency – Photovoltaic Power Systems Programme. 2014. p. 11. ISBN   978-3-906042-19-0. Archived (PDF) from the original on 7 April 2014.
  22. provisional IEA-PVPS data later revised, see article growth of photovoltaics for additional sources.
  23. "Nooit zoveel zonne-energie geproduceerd in België". Het Laatste Nieuws . 20 March 2014. Retrieved 9 April 2014.
  24. "Belgium's Flanders region mapping PV potential of landfill sites" . Retrieved 18 December 2022.
  25. "EXISTING AND FUTURE PV PROSUMER CONCEPTS , pg. 18" (PDF).
  26. 1 2 3 4 "Study on "Residential Prosumers in the European Energy Union"" (PDF).
  27. 1 2 Energy regulator's bi-yearly statistics on installations receiving green certificates: mid2016 2015 2014 2013 2012 2011 2010 2009 2008 2007 2006
  28. "Energiekaart". www.vlaanderen.be (in Dutch). Retrieved 8 January 2024.
  29. Dossier zonnepanelen, nieuwsblad.be]
  30. "Vlaamse regering past steun voor groene stroom aan" (in Dutch). freyavandenbossche.be. 12 October 2010.
  31. Haveux, Christophe (9 January 2018). "Le plus grand parc solaire du Benelux". Renouvelle. Retrieved 26 February 2022.
  32. High-speed Euro train gets green boost from two miles of solar panels
  33. Belgium launches Europe’s first solar train
  34. Katoen Natie heeft grootste installatie zonnepanelen in Europa
  35. België heeft grootste installatie zonnepanelen van Europa
  36. Antwerpen wil 2.500 m² zonnepanelen plaatsen op stadsgebouwen
  37. Leuven plaatst zonnepanelen op 4 stadsgebouwen
  38. "Observatoire Photovoltaïque". Energie Commune (in French). Retrieved 8 January 2024.

Commons-logo.svg Media related to Solar energy in Belgium at Wikimedia Commons