1968 United States presidential election in North Carolina

Last updated

1968 United States presidential election in North Carolina
Flag of North Carolina (1885-1991).svg
  1964 November 5, 1968 1972  
  Nixon 30-0316a (cropped).jpg George Wallace (D-AL) (3x4).jpg Senator Hubert Humphrey at the Capitol (cropped).jpg
Nominee Richard M. Nixon George Wallace Hubert Humphrey
Party Republican American Independent Democratic
Home state New York [lower-alpha 1] Alabama Minnesota
Running mate Spiro T. Agnew Curtis LeMay Edmund Muskie
Electoral vote1210
Popular vote627,192496,188464,113
Percentage39.51%31.26%29.24%

North Carolina Presidential Election Results 1968.svg
1968 United States presidential election in North Carolina results map by congressional district.svg

President before election

Lyndon B. Johnson
Democratic

Elected President

Richard Nixon
Republican

The 1968 United States presidential election in North Carolina took place on November 5, 1968, and was part of the 1968 United States presidential election. Voters chose 13 representatives, or electors to the Electoral College, who voted for president and vice president.

Contents

Whereas in the Deep South, Black Belt whites had deserted the national Democratic Party in 1948, in North Carolina, where they had historically been an economically liberalizing influence on the state Democratic Party, [1] the white landowners of the Black Belt had stayed exceedingly loyal to the party until after the Voting Rights Act. This allowed North Carolina to be alongside Arkansas the only state to vote for Democrats in all four presidential elections between 1952 and 1964. Indeed, the state had not voted Republican since anti-Catholic fervor lead it to support Herbert Hoover over Al Smith in 1928; and other than that the state had not voted Republican once in the century since the Reconstruction era election of 1872. Nonetheless, in 1964 Republican Barry Goldwater may have won a small majority of white voters, [lower-alpha 2] [3] although he was beaten by virtually universal support for incumbent President Lyndon Johnson by a black vote estimated at 175 thousand. However, with the Voting Rights Act's passage, a reaction set in amongst these, and indeed amongst almost all Southern poor whites outside the unionized coalfields of Appalachia. [4] Former Alabama Governor George Wallace, running in North Carolina under the moniker of the “American Party”, appealed very strongly to most white voters in the eastern half of the state who had become extremely critical of black protesters, student radicals, and rising crime rates. [5]

In early polls it was thought that Wallace would carry the state, [6] but a major swing against him and toward Republican nominee Richard Nixon during October and November saw Nixon win the state, with 39.5 percent of the vote, whilst Wallace's 31.3 percent still pushed Democratic nominee and incumbent Vice-President Hubert Humphrey into third on 29.2 percent. The Alabama segregationist carried almost all of the Piedmont and Outer Banks, and some Black Belt areas where black voter registration was still limited – the very areas that had allowed John F. Kennedy and Adlai Stevenson II to carry North Carolina when other Outer South states went Republican. In these previously loyal regions whites felt President Johnson had moved much too far on civil rights issues, and consequent support for highly segregationist candidates in Democratic primary elections [7] led them naturally to Wallace. [8] Humphrey had very limited support outside of black voters, who were estimated to comprise well over half his total vote in the state, [9] with his share of the white vote totalling less than 20 percent [2] and coming mainly from some traditionally Democratic mountain counties and the university communities of Orange and Durham counties.

48% of white voters supported Nixon, 41% supported Wallace, and 12% supported Humphrey. [10] [11] [12]

Results

1968 United States presidential election in North Carolina [13]
PartyCandidateVotesPercentageElectoral votes
Republican Richard Nixon 627,19239.51%12
American George Wallace 496,18831.26%1
Democratic Hubert Humphrey 464,11329.24%0
Totals1,587,493100.0%13
Voter turnout

Results by county

County [14] Richard Nixon
Republican
George Wallace
American Independent
Hubert Humphrey
Democratic
MarginTotal
# %# %# %# %
Alamance 12,31036.54%13,13939.00%8,24124.46%-829-2.46%33,690
Alexander 4,37952.03%2,20326.18%1,83421.79%2,17625.85%8,416
Alleghany 1,69545.80%90424.43%1,10229.78%593 [lower-alpha 3] 16.02%3,701
Anson 1,47418.39%3,57144.56%2,96937.05%-602 [lower-alpha 4] -7.51%8,014
Ashe 4,89453.15%8889.64%3,42637.21%1,468 [lower-alpha 3] 15.94%9,208
Avery 3,19770.76%69015.27%63113.97%2,50755.49%4,518
Beaufort 2,66923.03%5,68649.07%3,23227.89%-2,454 [lower-alpha 4] -21.18%11,587
Bertie 81111.38%3,10843.61%3,20745.00%99 [lower-alpha 4] 1.39%7,126
Bladen 1,74620.79%3,89746.41%2,75432.80%-1,143 [lower-alpha 4] -13.61%8,397
Brunswick 2,40427.52%3,35838.45%2,97234.03%-386 [lower-alpha 4] -4.42%8,734
Buncombe 21,03144.23%11,88925.01%14,62430.76%6,407 [lower-alpha 3] 13.47%47,544
Burke 11,06848.84%5,89226.00%5,70425.17%5,17622.84%22,664
Cabarrus 13,22652.35%6,53825.88%5,50121.77%6,68826.47%25,265
Caldwell 10,43351.46%5,09525.13%4,74623.41%5,33826.33%20,274
Camden 1809.06%1,10055.36%70735.58%-393 [lower-alpha 4] -19.78%1,987
Carteret 4,59340.23%3,06126.81%3,76232.95%831 [lower-alpha 3] 7.28%11,416
Caswell 1,03617.20%2,85147.33%2,13735.47%-714 [lower-alpha 4] -11.86%6,024
Catawba 18,39356.33%7,28522.31%6,97421.36%11,10834.02%32,652
Chatham 3,84536.22%3,23930.51%3,53233.27%313 [lower-alpha 3] 2.95%10,616
Cherokee 3,76853.18%91512.91%2,40233.90%1,366 [lower-alpha 3] 19.28%7,085
Chowan 79821.60%1,69645.90%1,20132.50%-495 [lower-alpha 4] -13.40%3,695
Clay 1,39054.94%29311.58%84733.48%543 [lower-alpha 3] 21.46%2,530
Cleveland 7,29832.28%9,64942.68%5,66125.04%-2,351-10.40%22,608
Columbus 3,88126.19%6,69345.17%4,24328.64%-2,450 [lower-alpha 4] -16.53%14,817
Craven 2,99121.77%6,50947.37%4,24030.86%-2,269 [lower-alpha 4] -16.51%13,740
Cumberland 9,14331.95%9,53933.33%9,93834.72%399 [lower-alpha 4] 1.39%28,620
Currituck 36314.11%1,47157.19%73828.69%-733 [lower-alpha 4] -28.50%2,572
Dare 1,03540.13%84432.73%70027.14%1917.40%2,579
Davidson 16,67846.57%11,54432.23%7,59421.20%5,13414.34%35,816
Davie 3,86649.04%2,51531.90%1,50219.05%1,35117.14%7,883
Duplin 2,72422.22%6,08249.62%3,45128.16%-2,631 [lower-alpha 4] -21.46%12,257
Durham 12,70529.68%13,54231.63%16,56338.69%3,021 [lower-alpha 4] 7.06%42,810
Edgecombe 3,19822.36%5,86140.98%5,24336.66%-618 [lower-alpha 4] -4.32%14,302
Forsyth 31,62346.79%15,68123.20%20,28130.01%11,342 [lower-alpha 3] 16.79%67,585
Franklin 1,37514.10%5,52556.64%2,85529.27%-2,670 [lower-alpha 4] -27.37%9,755
Gaston 18,74143.77%13,97332.64%10,10023.59%4,76811.13%42,814
Gates 40614.58%1,22744.07%1,15141.34%-76 [lower-alpha 4] -2.73%2,784
Graham 1,57052.44%36312.12%1,06135.44%509 [lower-alpha 3] 17.00%2,994
Granville 1,83721.50%4,07147.64%2,63830.87%-1,433 [lower-alpha 4] -16.77%8,546
Greene 65012.71%2,90656.80%1,56030.49%-1,346 [lower-alpha 4] -26.31%5,116
Guilford 38,99646.23%19,75123.42%25,60430.35%13,392 [lower-alpha 3] 15.88%84,351
Halifax 3,14820.72%7,11646.84%4,92732.43%-2,189 [lower-alpha 4] -14.41%15,191
Harnett 5,18432.97%6,53141.54%4,00725.49%-1,347-8.57%15,722
Haywood 6,20539.26%3,89824.66%5,70336.08%502 [lower-alpha 3] 3.18%15,806
Henderson 9,33457.45%3,86123.76%3,05318.79%5,47333.69%16,248
Hertford 1,12517.04%2,20333.36%3,27549.60%1,072 [lower-alpha 4] 16.24%6,603
Hoke 81217.88%1,54534.02%2,18548.11%640 [lower-alpha 4] 14.09%4,542
Hyde 40120.02%83341.59%76938.39%-64 [lower-alpha 4] -3.20%2,003
Iredell 10,55743.17%9,02136.89%4,87819.95%1,5366.28%24,456
Jackson 3,74748.14%1,08013.88%2,95637.98%791 [lower-alpha 3] 10.16%7,783
Johnston 6,76433.05%9,21245.01%4,49221.95%-2,448-11.96%20,468
Jones 36110.72%1,78052.88%1,22536.39%-555 [lower-alpha 4] -16.49%3,366
Lee 2,58629.32%3,71142.07%2,52428.61%-1,125-12.75%8,821
Lenoir 3,84424.43%8,03651.08%3,85324.49%-4,183 [lower-alpha 4] -26.59%15,733
Lincoln 6,18846.20%3,16123.60%4,04430.19%2,144 [lower-alpha 3] 16.01%13,393
Macon 3,29550.48%1,16217.80%2,07031.71%1,225 [lower-alpha 3] 18.77%6,527
Madison 3,13049.18%1,03416.25%2,20134.58%929 [lower-alpha 3] 14.60%6,365
Martin 1,22114.97%3,81846.81%3,11838.22%-700 [lower-alpha 4] -8.59%8,157
McDowell 4,74046.01%3,01829.30%2,54324.69%1,72216.71%10,301
Mecklenburg 56,32552.40%20,07018.67%31,10228.93%25,223 [lower-alpha 3] 23.47%107,497
Mitchell 3,77872.65%60311.60%81915.75%2,959 [lower-alpha 3] 56.90%5,200
Montgomery 3,07039.67%2,25929.19%2,41031.14%660 [lower-alpha 3] 8.53%7,739
Moore 5,32243.74%3,26326.82%3,58329.45%1,739 [lower-alpha 3] 14.29%12,168
Nash 4,60224.08%9,23048.29%5,28327.64%-3,947 [lower-alpha 4] -20.65%19,115
New Hanover 10,02037.03%9,29134.33%7,75028.64%7292.70%27,061
Northampton 86010.86%2,98637.71%4,07251.43%1,086 [lower-alpha 4] 13.72%7,918
Onslow 3,44428.08%5,54245.18%3,28126.75%-2,098-17.10%12,267
Orange 6,09733.30%3,84521.00%8,36645.70%-2,269 [lower-alpha 3] -12.40%18,308
Pamlico 74521.46%1,44741.68%1,28036.87%-167 [lower-alpha 4] -4.81%3,472
Pasquotank 1,43018.84%3,59747.39%2,56433.78%-1,033 [lower-alpha 4] -13.61%7,591
Pender 1,00717.76%2,72047.98%1,94234.26%-778 [lower-alpha 4] -13.72%5,669
Perquimans 46815.37%1,55451.03%1,02333.60%-531 [lower-alpha 4] -17.43%3,045
Person 2,13824.17%4,06545.95%2,64429.89%-1,421 [lower-alpha 4] -16.06%8,847
Pitt 5,74525.41%9,16740.55%7,69634.04%-1,471 [lower-alpha 4] -6.51%22,608
Polk 2,55045.89%1,48426.71%1,52327.41%1,027 [lower-alpha 3] 18.48%5,557
Randolph 13,45052.35%6,89226.82%5,35120.83%6,55825.53%25,693
Richmond 2,86522.78%5,45743.38%4,25733.84%-1,200 [lower-alpha 4] -9.54%12,579
Robeson 4,52623.55%6,44133.52%8,24842.92%1,807 [lower-alpha 4] 9.40%19,215
Rockingham 8,09533.46%9,32438.54%6,77428.00%-1,229-5.08%24,193
Rowan 15,20746.79%9,22028.37%8,07424.84%5,98718.42%32,501
Rutherford 7,78546.11%4,47626.51%4,62227.38%3,163 [lower-alpha 3] 18.73%16,883
Sampson 6,59741.44%4,52728.43%4,79730.13%1,800 [lower-alpha 3] 11.31%15,921
Scotland 1,71728.69%2,01633.68%2,25237.63%236 [lower-alpha 4] 3.95%5,985
Stanly 9,42851.43%4,70625.67%4,19922.90%4,72225.76%18,333
Stokes 4,78145.25%3,41032.28%2,37422.47%1,37112.97%10,565
Surry 9,63851.19%4,10321.79%5,08827.02%4,550 [lower-alpha 3] 24.17%18,829
Swain 1,49445.86%53716.48%1,22737.66%267 [lower-alpha 3] 8.20%3,258
Transylvania 4,03346.85%2,36527.47%2,21025.67%1,66819.38%8,608
Tyrrell 29122.61%41532.25%58145.14%166 [lower-alpha 4] 12.89%1,287
Union 5,29038.67%4,76134.80%3,63026.53%5293.87%13,681
Vance 2,25219.84%5,24446.21%3,85233.94%-1,392 [lower-alpha 4] -12.27%11,348
Wake 28,92843.08%17,25025.69%20,97931.24%7,949 [lower-alpha 3] 11.84%67,157
Warren 79614.79%2,29442.62%2,29342.60%-1 [lower-alpha 4] -0.02%5,383
Washington 1,01621.26%1,86639.04%1,89839.71%32 [lower-alpha 4] 0.67%4,780
Watauga 5,08155.88%1,06011.66%2,95232.46%2,129 [lower-alpha 3] 23.42%9,093
Wayne 5,67828.79%8,70944.15%5,33827.06%-3,031-15.36%19,725
Wilkes 11,19560.29%2,87615.49%4,49724.22%6,698 [lower-alpha 3] 36.07%18,568
Wilson 4,05325.13%7,90349.00%4,17325.87%-3,730 [lower-alpha 4] -23.13%16,129
Yadkin 5,88560.51%2,39724.65%1,44314.84%3,48835.86%9,725
Yancey 2,44845.21%75213.89%2,21540.90%233 [lower-alpha 3] 4.31%5,415
Totals627,19239.51%496,18831.26%464,11329.24%131,0048.25%1,587,493

Counties that flipped from Democratic to Republican

Counties that flipped from Democratic to American Independent

Analysis

Nixon won twelve of the state's electoral votes, while one faithless elector that had been pledged to Nixon voted instead for Wallace. As of the 2020 presidential election , this is the last election in which Wayne County and Lenoir County did not vote for the Republican presidential candidate. [15]

Notes

  1. Although he was born in California and he served as a U.S. Senator from California, in 1968 Richard Nixon's official state of residence was New York, because he moved there to practice law after his defeat in the 1962 California gubernatorial election. During his first term as president, Nixon re-established his residency in California. Consequently, most reliable reference books list Nixon's home state as New York in the 1968 election and his home state as California in the 1972 (and 1960) election.
  2. Other election scholars have doubted Goldwater won the white vote in the state, which undoubtedly was extremely close. [2]
  3. 1 2 3 4 5 6 7 8 9 10 11 12 13 14 15 16 17 18 19 20 21 22 23 24 25 26 27 28 29 In this county where Wallace did run third behind both Nixon and Humphrey, margin given is Nixon vote minus Humphrey vote and percentage margin Nixon percentage minus Humphrey percentage.
  4. 1 2 3 4 5 6 7 8 9 10 11 12 13 14 15 16 17 18 19 20 21 22 23 24 25 26 27 28 29 30 31 32 33 34 35 36 37 38 39 40 41 42 In this county where Nixon ran third behind both Wallace and Humphrey, margin given is Humphrey vote minus Wallace vote and percentage margin Humphrey percentage minus Wallace percentage.

Related Research Articles

<span class="mw-page-title-main">1968 United States presidential election in New Mexico</span> Election in New Mexico

The 1968 United States presidential election in New Mexico took place on November 5, 1968. All fifty states and The District of Columbia, were part of the 1968 United States presidential election. State voters chose four electors to represent them in the Electoral College, who voted for president and vice president.

<span class="mw-page-title-main">1968 United States presidential election in New York</span>

The 1968 United States presidential election in New York took place on November 5, 1968. All 50 states and the District of Columbia, were part of the 1968 United States presidential election. Voters chose 43 electors to the Electoral College, which selected the president and vice president.

<span class="mw-page-title-main">1968 United States presidential election in Alabama</span> Election in Alabama

The 1968 United States presidential election in Alabama was held on November 5, 1968. In Alabama, voters voted for electors individually instead of as a slate, as in the other 49 states.

<span class="mw-page-title-main">1968 United States presidential election in Virginia</span> Election in Virginia

The 1968 United States presidential election in Virginia took place on November 5, 1968. All 50 states and the District of Columbia were part of the 1968 United States presidential election. Virginia voters chose twelve electors to the Electoral College, which selected the president and vice president of the United States.

<span class="mw-page-title-main">1968 United States presidential election in Texas</span> Election in Texas

The 1968 United States presidential election in Texas was held on November 5, 1968. All 50 states and the District of Columbia, were part of the 1968 United States presidential election. The state chose 25 electors to represent them in the Electoral College, who voted for president and vice president.

<span class="mw-page-title-main">1972 United States presidential election in Florida</span> Election in Florida

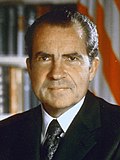
The 1972 United States presidential election in Florida was held on November 7, 1972, as part of the concurrent United States presidential election. Florida voters chose seventeen electors, or representatives to the Electoral College, who voted for president and vice president. Incumbent Republican President Richard Nixon won the state over the Democratic nominee, South Dakota Senator George McGovern, by a landslide margin of 44.11% and over one million votes.

<span class="mw-page-title-main">1968 United States presidential election in South Carolina</span> Election in South Carolina

The 1968 United States presidential election in South Carolina took place on November 5, 1968. All 50 states and the District of Columbia were part of the 1968 United States presidential election. South Carolina voters chose 8 electors to the Electoral College, who voted for president and vice president.

<span class="mw-page-title-main">1948 United States presidential election in Mississippi</span> Election in Mississippi

The 1948 United States presidential election in Mississippi took place on November 2, 1948, in Mississippi as part of the wider United States presidential election of 1948.

<span class="mw-page-title-main">1948 United States presidential election in Alabama</span> Election in Alabama

The 1948 United States presidential election in Alabama was held on November 2, 1948. Alabama voters sent eleven electors to the Electoral College who voted for President and Vice-President. In Alabama, voters voted for electors individually instead of as a slate.

<span class="mw-page-title-main">1968 United States presidential election in Mississippi</span> Election in Mississippi

The 1968 United States presidential election in Mississippi was held on November 5, 1968. Mississippi voters chose seven electors, or representatives to the Electoral College, who voted for President and Vice-President. During the 1960s, the Civil Rights Movement dictated Mississippi's politics, with effectively the entire white population vehemently opposed to federal policies of racial desegregation and black voting rights. In 1960, the state had been narrowly captured by a slate of unpledged Democratic electors, but in 1964 universal white opposition to the Civil Rights Act and negligible black voter registration meant that white Mississippians turned almost unanimously to Republican Barry Goldwater. Goldwater's support for "constitutional government and local self-rule" meant that the absence from the ballot of "states' rights" parties or unpledged electors was unimportant. The Arizona Senator was one of only six Republicans to vote against the Civil Rights Act, and so the small electorate of Mississippi supported him almost unanimously.

<span class="mw-page-title-main">1968 United States presidential election in Florida</span> Election in Florida

The 1968 United States presidential election in Florida was held on November 5, 1968. Florida voters chose fourteen electors, or representatives to the Electoral College, who voted for president and vice president.

<span class="mw-page-title-main">1968 United States presidential election in Tennessee</span> Election in Tennessee

The 1968 United States presidential election in Tennessee took place on November 5, 1968. All 50 states and the District of Columbia were part of the 1968 United States presidential election. Tennessee voters chose 11 electors to the Electoral College, who voted for president and vice president.

<span class="mw-page-title-main">1968 United States presidential election in Louisiana</span> Election in Louisiana

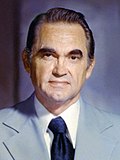
The 1968 United States presidential election in Louisiana was held on November 5, 1968, as part of the 1968 United States presidential election. Along with four other contiguous southern states, former and future Alabama Governor George Wallace won the state for the American Party by a large margin against Democrat Hubert Humphrey and Republican Richard Nixon. As of the 2020 presidential election, this is the last election in which Jefferson Parish, St. Tammany Parish, Lafayette Parish, Ouachita Parish, Bossier Parish, Union Parish, and LaSalle Parish did not vote for the Republican presidential candidate.

<span class="mw-page-title-main">1968 United States presidential election in Kentucky</span> Election in Kentucky

The 1968 United States presidential election in Kentucky took place on November 5, 1968. All 50 states and the District of Columbia were part of the 1968 United States presidential election. Kentucky voters chose 9 electors to the Electoral College, which selected the president and vice president of the United States.

<span class="mw-page-title-main">1968 United States presidential election in Missouri</span> Election in Missouri

The 1968 United States presidential election in Missouri took place on November 5, 1968. All 50 states and the District of Columbia were part of the 1968 United States presidential election. Voters chose 12 electors to the Electoral College, which selected the president and vice president.

<span class="mw-page-title-main">1956 United States presidential election in South Carolina</span> Election in South Carolina

The 1956 United States presidential election in South Carolina took place on November 6, 1956, as part of the 1956 United States presidential election. South Carolina voters chose eight representatives, or electors, to the Electoral College, who voted for president and vice president.

<span class="mw-page-title-main">1944 United States presidential election in South Carolina</span> Election in South Carolina

The 1944 United States presidential election in South Carolina took place on November 7, 1944, as part of the 1944 United States presidential election. State voters chose 8 electors to the Electoral College, which selected the president and vice president.

<span class="mw-page-title-main">1948 United States presidential election in South Carolina</span> Election in South Carolina

The 1948 United States presidential election in South Carolina took place on November 2, 1948, as part of the 1948 United States presidential election. State voters chose eight electors to the Electoral College, which selected the president and vice president.

<span class="mw-page-title-main">1912 United States presidential election in North Carolina</span>

The 1912 United States presidential election in North Carolina took place on November 5, 1912, as part of the 1912 United States presidential election. North Carolina voters chose 12 representatives, or electors, to the Electoral College, who voted for president and vice president. Like all former Confederate states, North Carolina would during its “Redemption” develop a politics based upon Jim Crow laws, disfranchisement of its African-American population and dominance of the Democratic Party. However, unlike the Deep South, the Republican Party possessed sufficient historic Unionist white support from the mountains and northwestern Piedmont to gain a stable one-third of the statewide vote total in general elections even after blacks lost the right to vote.

<span class="mw-page-title-main">1916 United States presidential election in Alabama</span> Election in Alabama

The 1916 United States presidential election in Alabama took place on November 7, 1916, as part of the nationwide presidential election. State voters chose twelve representatives, or electors, to the Electoral College, who voted for president and vice president.

References

  1. Phillips, Kevin P. The Emerging Republican Majority. pp. 219, 303. ISBN   978-0-691-16324-6.
  2. 1 2 Black, Earl (2021). "Competing Responses to the New Southern Politics: Republican and Democratic Southern Strategies, 1964-76". In Reed, John Shelton; Black, Merle (eds.). Perspectives on the American South: An Annual Review of Society, Politics, and Culture. ISBN   9781136764882.
  3. See Etsy, Amos (January 2005). "North Carolina Republicans and the Conservative Revolution, 1964-1968". The North Carolina Historical Review. 82 (1): 1–32.
  4. Phillips. The Emerging Republican Majority, p. 226
  5. Eamon, Tom. The Making of a Southern Democracy: North Carolina Politics from Kerr Scott to Pat McCrory . p. 123. ISBN   9781469606972.
  6. Lehnen, Robert G. (June 1970). "Stability of Presidential Choice in 1968: The Case of Two Southern States". Social Science Quarterly. 51 (1): 138–147.
  7. Black, Earl (June 1973). "The Militant Segregationist Vote in the Post-Brown South: A Comparative Analysis". Social Science Quarterly. 54 (1): 66–84.
  8. Schönberger, Robert A.; Segal, David R. (August 1971). "The Ecology of Dissent: The Southern Wallace Vote in 1968". Midwest Journal of Political Science. 15 (3): 583–586.
  9. Phillips; The Emerging Republican Majority, p. 280
  10. Black & Black 1992, p. 147.
  11. Black & Black 1992, p. 295.
  12. Black & Black 1992, p. 335.
  13. Leip, Dave (2005). "1968 Presidential General Election Results – North Carolina". US Election Atlas. Retrieved July 22, 2011.
  14. "NC US President Race, November 03, 1968". Our Campaigns.
  15. Sullivan, Robert David (June 29, 2016). "How the Red and Blue Map Evolved Over the Past Century". The National Catholic Review (America Magazine ed.).

Works cited