| |||||||||||||||||||||||||||||||||||||||||||||
All 40 Welsh seats to the House of Commons | |||||||||||||||||||||||||||||||||||||||||||||
---|---|---|---|---|---|---|---|---|---|---|---|---|---|---|---|---|---|---|---|---|---|---|---|---|---|---|---|---|---|---|---|---|---|---|---|---|---|---|---|---|---|---|---|---|---|
| |||||||||||||||||||||||||||||||||||||||||||||
†Notional 1992 results if held on the 1997 boundaries *Indicates boundary change - so this is a notional figure. |
These are the results of the 1997 United Kingdom general election in Wales. The election was held on 1 May 1997 and all 40 seats in Wales were contested. The Labour Party won a landslide majority of Welsh MPs, gaining seven seats for a total of 34 out of 40. The Liberal Democrats gained one seat, whilst Plaid Cymru retained their four MPs. [1]
The Conservatives lost all of their Welsh MPs, leaving them without representation in Wales for the first time since the 1906 general election. [2] [3] [4] They would not gain another MP until the 2005 general election. [5]
Below is a table summarising the results of the 1997 general election in Wales. [1]
Party [6] | Seats | Votes | |||||||
---|---|---|---|---|---|---|---|---|---|
Total | Gains | Losses | Net +/- | % seats | Total votes | % votes | Change | ||
Labour | 34 | 7 | 0 | 7 | 85.0 | 885,935 | 54.7 | 5.2 | |
Conservative | 0 | 0 | 8 | 8 | — | 317,127 | 19.6 | 9.0 | |
Liberal Democrats | 2 | 1 | 0 | 1 | 5.0 | 200,020 | 12.4 | 0.1 | |
Plaid Cymru | 4 | 0 | 0 | 10.0 | 161,030 | 10.0 | 1.1 | ||
Referendum | 0 | 0 | 0 | — | 38,245 | 2.4 | New | ||
Socialist Labour | 0 | 0 | 0 | — | 6,203 | 0.4 | New | ||
Independent Labour | 0 | 0 | 0 | — | 4,633 | 0.3 | New | ||
Independent | 0 | 0 | 0 | — | 2,258 | 0.2 | N/A | ||
Green | 0 | 0 | 0 | — | 1,718 | 0.1 | 0.3 | ||
Other parties | 0 | 0 | 0 | — | 3,087 | 0.2 | N/A | ||
The following is the results by constituency by Senedd electoral region:
Mid and West Wales elected 8 Members of Parliament.
Constituency | Candidates | Incumbent | ||||||||||||
---|---|---|---|---|---|---|---|---|---|---|---|---|---|---|
Labour | Conservative | Liberal Democrat | Plaid Cymru | Referendum | Other | |||||||||
Brecon and Radnorshire [7] | Christopher Mann 11,424 (26.6%) | Jonathan Evans 12,419 (29.0%) | Richard Livsey 17,516 (40.8%) | Steven Cornelius 622 (1.5%) | Elizabeth Phillips 900 (2.1%) | Bill Walker | ||||||||
Carmarthen East and Dinefwr [8] | Alan Williams 17,907 (42.9%) | Edmund Hayward 5,022 (12.0%) | Juliana Hughes 3,150 (7.5%) | Rhodri Glyn Thomas 14,457 (34.6%) | Ian Humphreys-Evans 1,196 (2.9%) | Alan Williams‡ | ||||||||
Carmarthen West and South Pembrokeshire [9] | Nick Ainger 20,956 (49.1%) | Owen Williams 11,335 (26.6%) | Keith Evans 3,516 (8.2%) | Roy Llewellyn 5,402 (12.7%) | Joy Poirrier 1,432 (3.4%) | Nick Ainger‡ | ||||||||
Ceredigion [10] | Robert (Hag) Harris 9,767 (24.3%) | Felix Aubel 5,983 (14.9%) | Dai Davies 6,616 (16.5%) | Cynog Dafis 16,728 (41.6%) | John Leaney 1,092 (2.7%) | Cynog Dafis‡ | ||||||||
Llanelli [11] | Denzil Davies 23,851 (57.9%) | Andrew Hayes 5,003 (12.1%) | Nick Burree 3,788 (9.2%) | Marc Phillips 7,812 (19.0%) | John Willock (SLP) 757 (1.8%) | Denzil Davies | ||||||||
Meirionnydd Nant Conwy [12] | Hefin E. Rees 5,660 (23.0%) | Jeremy Quin 3,922 (16.0%) | Robina L. Feeley 1,719 (7.0%) | Elfyn Llwyd 12,465 (50.7%) | Phillip H. Hodge 809 (3.3%) | Elfyn Llwyd | ||||||||
Montgomeryshire [13] | Angharad Davies 6,109 (19.1%) | Glyn Davies 8,344 (26.1%) | Lembit Öpik 14,647 (45.9%) | Helen Mary Jones 1,608 (5.0%) | John Bufton 879 (2.8%) | Susan Walker (Green) 338 (1.1%) | Alex Carlile† | |||||||
Preseli Pembrokeshire [14] | Jackie Lawrence 20,477 (48.3%) | Robert Buckland 11,741 (27.7%) | Jeffrey Clarke 5,527 (13.0%) | Alun Jones 2,683 (6.3%) | David Berry 1,574 (3.7%) | Molly Scott Cato (Green) 401 (0.9%) | Nick Ainger‡ |
North Wales elected 9 Members of Parliament.
Constituency | Candidates | Incumbent | ||||||||||||||
---|---|---|---|---|---|---|---|---|---|---|---|---|---|---|---|---|
Labour | Conservative | Liberal Democrat | Plaid Cymru | Referendum | Other | |||||||||||
Alyn and Deeside [15] | Barry Jones 25,955 (61.9%) | Timothy P. Roberts 9,552 (22.8%) | Eleanor Burnham 4,076 (9.7%) | Siw Hills 738 (1.8%) | Malcolm J. D. Jones 1,627 (3.9%) | Barry Jones | ||||||||||
Caernarfon [16] | Eifion Wyn Williams 10,167 (29.5%) | Elwyn Williams 4,230 (12.3%) | Mary Macqueen 1,686 (4.9%) | Dafydd Wigley 17,616 (51.0%) | Clive Collins 811 (2.4%) | Dafydd Wigley | ||||||||||
Conwy [17] | Betty Williams 14,561 (35.0%) | David Jones 10,085 (24.3%) | Roger Roberts 12,965 (31.2%) | Rhodri Davies 2,844 (6.8%) | Allan Barham 760 (1.8%) |
| Wyn Roberts† | |||||||||
Clwyd South [18] | Martyn Jones 22,901 (58.1%) | Boris Johnson 9,091 (23.1%) | Andrew Chadwick 3,684 (9.4%) | Gareth Williams 2,500 (6.3%) | Alex Lewis 1,207 (3.1%) | Martyn Jones‡ | ||||||||||
Clwyd West [19] | Gareth Thomas 14,918 (37.1%) | Rod Richards 13,070 (32.5%) | Gwyn Williams 5,151 (12.8%) | Eryl W. Williams 5,421 (12.8%) | Heather Bennett-Collins 1,114 (2.8%) | David K. Neal (Conservatory) 583 (1.3%) | Rod Richards‡ | |||||||||
Delyn [20] | David Hanson 23,300 (57.2%) | Karen Lumley 10,607 (26.0%) | David Lloyd 4,160 (10.2%) | Ashley J. Drake 1,558 (3.8%) | Elizabeth H. Soutter 1,117 (2.7%) | David Hanson | ||||||||||
Vale of Clwyd [21] | Chris Ruane 20,617 (52.7%) | David Edwards 11,662 (29.8%) | Daniel Munford 3,425 (8.8%) | Gwyneth Kensler 2,301 (5.9%) | Simon Vickers 834 (2.1%) | Scott Cooke (UKIP) 293 (0.7%) | New constituency | |||||||||
Wrexham [22] | John Marek 20,450 (56.1%) | Stuart Andrew 8,688 (23.9%) | Andrew Thomas 4,833 (13.3%) | Kevin Plant 1,170 (3.2%) | John Cronk 1,195 (3.3%) | Nicholas Low (NLP) 86 (0.2%) | John Marek | |||||||||
Ynys Môn [23] | Owen Edwards 13,275 (33.2%) | Gwilym Owen 8,569 (21.5%) | Deric Burnham 1,537 (3.8%) | Ieuan Wyn Jones 15,756 (39.5%) | Hugh Gray-Morris 793 (2.0%) | Ieuan Wyn Jones |
South Central Wales elected 8 Members of Parliament.
Constituency | Candidates | Incumbent | |||||||||||||||
---|---|---|---|---|---|---|---|---|---|---|---|---|---|---|---|---|---|
Labour | Conservative | Liberal Democrat | Plaid Cymru | Referendum | Other | ||||||||||||
Cardiff Central [24] | Jon Owen Jones 18,464 (43.7%) | David Melding 8,470 (20.0%) | Jenny Randerson 10,541 (24.9%) | Wayne Vernon 1,504 (3.6%) | Nick Lloyd 760 (1.8%) |
| Jon Owen Jones | ||||||||||
Cardiff North [25] | Julie Morgan 24,460 (50.4%) | Gwilym Jones 16,334 (33.7%) | Robyn Rowland 5,294 (10.9%) | Colin Palfrey 1,201 (2.5%) | Edward J. Litchfield 1,199 (2.5%) | Gwilym Jones | |||||||||||
Cardiff South and Penarth [26] | Alun Michael 22,647 (53.4%) | Caroline E. Roberts 8,786 (20.7%) | Simon J. Wakefield 3,964 (9.3%) | David B. L. Haswell 1,356 (3.2%) | Phillip S. E. Morgan 1,211 (2.9%) |
| Alun Michael | ||||||||||
Cardiff West [27] | Rhodri Morgan 24,297 (60.3%) | Simon Hoare 8,669 (21.5%) | Jacqui Gasson 4,366 (10.8%) | Gwenllian Carr 1,949 (4.8%) | Trefor Johns 996 (2.5%) | Rhodri Morgan | |||||||||||
Cynon Valley [28] | Ann Clwyd 23,307 (69.7%) | Andrew Smith 2,260 (6.8%) | Huw Price 3,459 (10.3%) | Alun Davies 3,552 (10.6%) | Gwyn John 844 (2.5%) | Ann Clwyd | |||||||||||
Pontypridd [29] | Kim Howells 29,290 (63.9%) | Jonathan M. Cowen 5,910 (12.9%) | Nigel Howells 6,161 (13.4%) | Owain Llewelyn 2,977 (6.5%) | John Wood 874 (1.9%) |
| Kim Howells | ||||||||||
Rhondda [30] | Allan Rogers 30,381 (74.5%) | Steven Whiting 1,551 (3.8%) | Rodney Berman 2,307 (5.7%) | Leanne Wood 5,450 (13.4%) | Stephen Gardiner 658 (1.6%) | Kevin Jakeway (Green) 460 (1.1%) | Allan Rogers | ||||||||||
Vale of Glamorgan [31] | John Smith 29,054 (53.9%) | Walter Sweeney 18,522 (34.4%) | Suzanne Campbell 4,945 (9.2%) | Melanie Corp 1,393 (2.6%) | Walter Sweeney |
South East Wales elected 8 Members of Parliament.
Constituency | Candidates | Incumbent | ||||||||||||
---|---|---|---|---|---|---|---|---|---|---|---|---|---|---|
Labour | Conservative | Liberal Democrat | Plaid Cymru | Referendum | Other | |||||||||
Blaenau Gwent [32] | Llew Smith 31,493 (79.5%) | Margrit A. Williams 2,607 (6.6%) | Geraldine Layton 3,458 (8.7%) | Jim B. Criddle 2,072 (5.2%) | Llew Smith | |||||||||
Caerphilly [33] | Ron Davies 30,697 (67.3%) | Rhodri Harris 4,858 (10.7%) | Tony D. Ferguson 3,724 (8.2%) | Lindsay Whittle 4,383 (9.7%) | Mark E. Morgan 1,337 (3.0%) | Catherine Williams (PLA) 270 (0.6%) | Ron Davies | |||||||
Islwyn [34] | Don Touhig 26,995 (74.2%) | David Walters 2,864 (7.9%) | Christopher Worker 3,064 (8.4%) | Darren Jones 2,272 (6.2%) | Susan Monaghan 1,209 (3.3%) | Don Touhig | ||||||||
Merthyr Tydfil and Rhymney [35] | Ted Rowlands 30,012 (76.7%) | Jonathan Morgan 2,508 (6.4%) | Duncan Anstey 2,926 (7.5%) | Alun Cox 2,344 (6.0%) | Ronald Hutchings 660 (1.7%) | Alan Cowdell (Ind. Lab.) 691 (1.8%) | Ted Rowlands | |||||||
Monmouth [36] | Huw Edwards 23,404 (47.7%) | Roger Evans 19,226 (39.2%) | Mark Williams 4,689 (9.6%) | Alan Cotton 516 (1.1%) | Timothy Warry 1,190 (2.4%) | Roger Evans | ||||||||
Newport East [37] | Alan Howarth 21,481 (57.7%) | David Evans 7,958 (21.4%) | Alistair Cameron 3,880 (10.4%) | Christopher Holland 721 (1.9%) | Edward Chaney-Davis 1,267 (3.4%) | Arthur Scargill (SLP) 1,951 (5.2%) | Roy Hughes† | |||||||
Newport West [38] | Paul Flynn 24,331 (60.5%) | Peter Clarke 9,794 (24.4%) | Stanley Wilson 3,907 (9.7%) | Huw Jackson 648 (1.6%) | Andrew Thompsett 1,199 (3.0%) | Hugh Hughes (UKIP) 323 (0.3%) | Paul Flynn | |||||||
Torfaen [39] | Paul Murphy 29,863 (69.1%) | Neil Parish 5,327 (12.3%) | Jean Gray 5,249 (12.1%) | Robert Gough 1,042 (2.4%) | Deborah Holler 1,245 (2.9%) | Roger Coghill (Green) 519 (1.2%) | Paul Murphy |
South West Wales elected 7 Members of Parliament.
Constituency | Candidates | Incumbent | ||||||||||||
---|---|---|---|---|---|---|---|---|---|---|---|---|---|---|
Labour | Conservative | Liberal Democrat | Plaid Cymru | Referendum | Other | |||||||||
Aberavon [40] | John Morris 25,650 (71.3%) | Peter Harper 2,835 (7.9%) | Ronald McConville 4,079 (11.3%) | Philip Cockwell 2,088 (5.8%) | Peter David 970 (2.7%) | Captain Beany (Independent) 341 (1.0%) | John Morris | |||||||
Bridgend [41] | Win Griffiths 25,115 (58.1%) | David Davies 9,867 (22.8%) | Andrew Mckinlay 4,968 (11.5%) | Dennis R. Watkins 1,649 (3.8%) | Tudor Greaves 1,662 (3.8%) | Win Griffiths | ||||||||
Gower [42] | Martin Caton 23,313 (53.8%) | Alun Cairns 10,306 (23.8%) | Howard W. Evans 5,624 (13.0%) | D Elwyn Williams 2,226 (5.1%) | Richard D. Lewis 1,745 (4.0%) | Anthony G. Popham (Independent) 122 (0.3%) | Gareth Wardell† | |||||||
Neath [43] | Peter Hain 30,324 (73.5%) | David M. Evans 3,583 (8.7%) | Frank H. Little 2,597 (6.3%) | Trefor Jones 3,344 (8.1%) | Peter A. Morris 975 (2.4%) | Howard Marks (Legalise Cannabis Party) 420 (1.0%) | Peter Hain | |||||||
Ogmore [44] | Ray Powell 28,163 (74.0%) | David A. Unwin 3,716 (9.8%) | Kirsty Williams 3,510 (9.2%) | John D. Rogers 2,679 (7.0%) | Ray Powell | |||||||||
Swansea East [45] | Donald Anderson 29,151 (75.4%) | Catherine Dibble 3,582 (9.3%) | Elwyn Jones 3,440 (8.9%) | Michelle Pooley 1,308 (2.3%) | Catherine Maggs 904 (2.3%) | Ronnie Job (Socialist Alternative) 289 (0.8%) | Donald Anderson | |||||||
Swansea West [46] | Alan Williams 22,748 (56.2%) | Andrew Baker 8,289 (20.5%) | John Newbury 5,872 (14.5%) | Dai Lloyd 2,675 (6.6%) | David Proctor (SLP) 885 (2.2%) | Alan Williams |
Ann Clwyd Roberts was a Welsh Labour politician who served as Member of Parliament (MP) for Cynon Valley for 35 years, from 1984 until 2019. Although she had intended to stand down in 2015, she was re-elected in that year's general election and in 2017 before standing down in 2019. Clwyd is the longest-serving female MP for a Welsh constituency.
Carmarthen West and South Pembrokeshire is a constituency of the House of Commons of the Parliament of the United Kingdom. It elects one Member of Parliament (MP) by the first past the post system of election.
Carmarthen East and Dinefwr is a constituency of the House of Commons of the Parliament of the United Kingdom represented since 2010 by Jonathan Edwards of Plaid Cymru. It elects one Member of Parliament (MP) by the first past the post system of election. It was created in 1997, mostly from the former seat of Carmarthen.
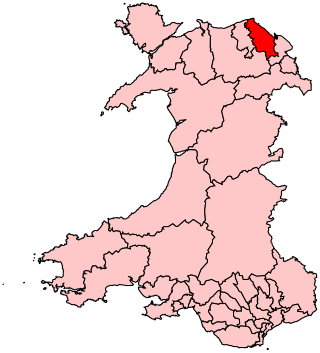
Clwyd South is a constituency of the House of Commons of the Parliament of the United Kingdom (Westminster). The constituency was created in 1997, and it elects one Member of Parliament (MP) by the first past the post method of election.
Clwyd West is a constituency of the House of Commons of the Parliament of the United Kingdom. It elects one Member of Parliament (MP) by the first past the post method of election. The current MP is David Jones of the Conservative Party, first elected at the 2005 general election and who also served as Secretary of State for Wales from 4 September 2012 until 14 July 2014.
Delyn is a constituency represented in the House of Commons of the UK Parliament since 2019 by Rob Roberts, who was elected as a Conservative, but currently sits as an Independent following sexual harassment allegations.
Aberconwy is a constituency represented in the House of Commons of the UK Parliament since 2019 by Robin Millar, a Conservative.
Wrexham is a constituency of the Senedd. It elects one Member of the Senedd by the first past the post method of election. Also, however, it is one of nine constituencies in the North Wales electoral region, which elects four additional members, in addition to nine constituency members, to produce a degree of proportional representation for the region as a whole.
Caerfyrddin is a proposed parliamentary constituency in Wales to return one Member of Parliament (MP) to the House of Commons of the Parliament of the United Kingdom, from the next general election. It previously existed between 1542 and 1997 under the English version of the name, Carmarthen. It was named Carmarthen Boroughs from 1832 to 1918; between 1997 and 2024 it was divided between Carmarthen East and Dinefwr constituency and Carmarthen West and South Pembrokeshire.
Brecon and Radnorshire is a constituency of the Senedd. It elects one Member of the Senedd by the first past the post method of election. Also, however, it is one of eight constituencies in the Mid and West Wales electoral region, which elects four additional members, in addition to eight constituency members, to produce a degree of proportional representation for the region as a whole. It is currently represented by James Evans MS, of the Conservatives who has been the MS since May 2021.
Montgomeryshire is a constituency of the Senedd. It elects one Member of the Senedd by the first past the post method of election. Also, however, it is one of eight constituencies in the Mid and West Wales electoral region, which elects four additional members, in addition to eight constituency members, to produce a degree of proportional representation for the region as a whole.
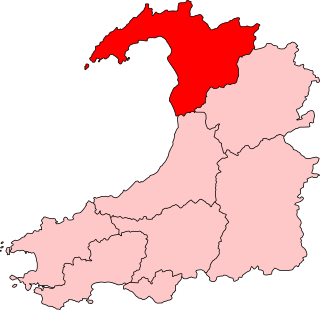
Dwyfor Meirionnydd is a constituency of the Senedd, first created for the former Assembly's 2007 election. It elects one Member of the Senedd by the first past the post method of election. Also, however, it is one of eight constituencies in the Mid and West Wales electoral region, which elects four additional members, in addition to nine constituency members, to produce a degree of proportional representation for the region as a whole.
Simon Anthony Hart is a British politician serving as the Chief Whip of the House of Commons and Parliamentary Secretary to the Treasury since October 2022. He previously served as Secretary of State for Wales in the Johnson government from 2019 to 2022. A member of the Conservative Party, he has been the Member of Parliament (MP) for Carmarthen West and South Pembrokeshire since 2010.
The 2007 National Assembly for Wales election was held on Thursday 3 May 2007 to elect members to the National Assembly for Wales. It was the third general election. On the same day local elections in England and Scotland, as well as the Scottish Parliament election took place. This election was preceded by the previous Assembly election in 2003.
Llŷr Huws Gruffydd, is a Welsh Plaid Cymru politician, serving as a Member of the Senedd (MS) for the North Wales region since 2011. He acted as interim leader of Plaid Cymru from 16 May to 16 June 2023.
These are the results of the 2005 United Kingdom general election in Wales. The election was held on 5 May 2005 and all 40 seats in Wales were contested.
The 2015 United Kingdom general election in Wales was held on 7 May 2015 and all 40 seats in Wales were contested. The election for each seat was conducted on the basis of first-past-the-post.
These are the election results from United Kingdom general elections based on the electoral regional boundaries used by the Senedd, for the Senedd electoral region of North Wales. Since the 1997 general election, this grouping of constituencies into this unofficial region have elected nine Members of Parliament to the House of Commons of the United Kingdom.
These are the election results from United Kingdom general elections based on the electoral regional boundaries used by the Senedd, for the Senedd electoral region of Mid and West Wales. Since the 1997 general election, this grouping of constituencies into this unofficial region have elected eight Members of Parliament to the House of Commons of the United Kingdom.