Montgomeryshire (UK Parliament constituency)

Last updated

Montgomeryshire
Former County constituency
for the House of Commons
Montgomeryshire2007Constituency.svg
Boundary of Montgomeryshire in Wales
Preserved county Powys
Electorate 48,910 (December 2010) [1]
Major settlements Newtown, Welshpool
1542–2024
SeatsOne
Created from Montgomery
Replaced by Montgomeryshire and Glyndŵr
Senedd Montgomeryshire, Mid and West Wales

Montgomeryshire (Welsh : Sir Drefaldwyn) was a constituency [n 1] in Wales represented in the House of Commons of the UK Parliament.

Contents

Created in 1542, it elected one Member of Parliament (MP), formerly known as the knight of the shire, by the first-past-the-post system of election. It was abolished following the 2023 Periodic Review of Westminster constituencies prior to the 2024 general election.

The Montgomeryshire Senedd constituency was created with the same boundaries in 1999 (as an Assembly constituency).

Boundaries and political history

Montgomeryshire (UK Parliament constituency)
Map of boundaries 1983-2024

The seat was based on the ancient county of Montgomeryshire, in the principal area of Powys. One of Britain's most rural and isolated constituencies, Montgomeryshire elected Liberal or Liberal-affiliated candidates from 1880, until a Conservative victory in the 1979 general election. In the 1983 general election it was the only seat in England and Wales where a sitting Conservative MP was unseated, while nationally the party's seat majority increased. However, in 2010, the Conservatives won and held the seat in 2015 and 2017, with an increased majority. The seat was officially known as Montgomery before 1997. It is the only seat in Wales never to have elected a Labour MP. [2]

Until 1918 this seat, in common with many others, contained an enclaved seat, which comprised the boroughs of Montgomery, Llanfyllin, Llanidloes, Newtown and Welshpool. This seat survived the Redistribution of Seats Act 1885 which abolished many similar seats. The seat was finally abolished in 1918 and absorbed into the wider Montgomeryshire seat.

Under proposed constituency boundary changes announced in September 2016, ahead of the next general election, the seat was to be partitioned, the northern half including Welshpool to be merged with Clwyd South to form a new seat of South Clwyd and North Montgomeryshire; most of the southern including Newtown was to be merged with the Brecon and Radnor seat to form a seat renamed as Brecon, Radnor and Montgomery, [3] and the wards of Llanidloes and Blaen Hafren merged into the Ceredigion constituency which would form part of a new seat called Ceredigion and North Pembrokeshire. [4] However, the general elections of 2017 and 2019 were fought on existing boundaries.

Abolition

The constituency was abolished as part of the 2023 Periodic Review of Westminster constituencies and under the June 2023 final recommendations of the Boundary Commission for Wales for the 2024 United Kingdom general election. The entire constituency became part of the new Montgomeryshire and Glyndŵr. [5]

Members of Parliament

1542–1604

ParliamentMember
1542 James Leche [6]
1545 Humphrey Lloyd [6]
1547 Humphrey Lloyd [6]
1553 (Mar) Edward Herbert [6]
1553 (Oct) Edward Herbert [6]
1554 (Apr) Edward Herbert [6]
1554 (Nov) Edward Herbert [6]
1555Not known
1558 Edward Herbert [6]
1559 (Jan) Edward Herbert I [7]
1562–1563 Edward Herbert I [7]
1571 Edward Herbert I [7]
1572 John Price [7]
1584 (Oct) Richard Herbert [7]
1586 (Oct) Oliver Lloyd [7]
1588 (Oct) Edward Herbert I [7]
1593 Reginald Williams [7]
1597 (Sep) William Herbert [7]
1601 (Oct) Edward Herbert [7]

1604–present

ElectionMember [8] Party
1604–1611 William Herbert
1614 William Herbert
1621–1622 William Herbert
1624 William Herbert
1624–1629 William Herbert
1640 Richard Herbert
1640–1642 John Pryce
1642Seat vacant from 12 September 1642, when Pryce was disabled from sitting
1647 Edward Vaughan
1648Seat vacant after Vaughan was excluded in Pride's Purge
1653Not separately represented in the Barebones Parliament
1654–1655
(two members)
Charles Lloyd
John Pryce
1656–1658
(two members)
Charles Lloyd
Hugh Pryce
1659 Edward Vaughan
1660 John Purcell
1661 Edward Vaughan
1661 Hon. Andrew Newport Conservative
1679 Edward Vaughan Conservative
1719 Hon. Price Devereux Conservative
1740 Robert Williams
1741 Sir Watkin Williams-Wynn Conservative
1742 Robert Williams
1747 Edward Kynaston
1772 Watkin Williams
1774 William Mostyn Owen
1795 Francis Lloyd
1799 Charles Williams-Wynn Tory [9]
1834 Conservative [9]
1850 by-election Herbert Williams-Wynn Conservative
1862 by-election Charles Williams-Wynn Conservative
1880 Stuart Rendel Liberal
1894 by-election Arthur Humphreys-Owen Liberal
1906 David Davies Liberal
1929 Clement Davies Liberal
1931 National Liberal
1939 Independent
1942 Liberal
1962 by-election Emlyn Hooson Liberal
1979 Delwyn Williams Conservative
1983 Alex Carlile Liberal
1988 Liberal Democrat
1997 Lembit Öpik Liberal Democrat
2010 Glyn Davies Conservative
2019 Craig Williams Conservative

Elections

Montgomery election results Montgomery election results.png
Montgomery election results

Elections in the 19th century

Elections in the 1830s

General election 1830: Montgomery [9] [10]
PartyCandidateVotes%±%
Tory Charles Williams-Wynn Unopposed
Registered electors c.1,110
Tory hold
1830 Montgomeryshire by-election [9] [10]
PartyCandidateVotes%±%
Tory Charles Williams-Wynn Unopposed
Registered electors c.1,110
Tory hold
  • Caused by Williams-Wynn's appointment as a Commissioner for the Affairs of India
General election 1831: Montgomery [9] [10]
PartyCandidateVotes%±%
Tory Charles Williams-Wynn 703 70.0 N/A
Whig Joseph Hayes Lyon30230.0N/A
Majority40140.0N/A
Turnout 1,005c.90.5N/A
Registered electors c.1,110
Tory hold
General election 1832: Montgomery [11] [9]
PartyCandidateVotes%±%
Tory Charles Williams-Wynn Unopposed
Registered electors 2,525
Tory hold
General election 1835: Montgomery [11] [9]
PartyCandidateVotes%±%
Conservative Charles Williams-Wynn Unopposed
Registered electors 2,737
Conservative hold
General election 1837: Montgomery [11] [9]
PartyCandidateVotes%±%
Conservative Charles Williams-Wynn Unopposed
Registered electors 2,819
Conservative hold

Elections in the 1840s

General election 1841: Montgomery [11]
PartyCandidateVotes%±%
Conservative Charles Williams-Wynn Unopposed
Registered electors 2,936
Conservative hold
General election 1847: Montgomery [11]
PartyCandidateVotes%±%
Conservative Charles Williams-Wynn Unopposed
Registered electors 3,214
Conservative hold

Elections in the 1850s

1850 Montgomeryshire by-election [11]
PartyCandidateVotes%±%
Conservative Herbert Watkin Williams-Wynn Unopposed
Conservative hold
  • Caused by Williams-Wynn's death.
General election 1852: Montgomery [11]
PartyCandidateVotes%±%
Conservative Herbert Watkin Williams-Wynn Unopposed
Registered electors 2,986
Conservative hold
General election 1857: Montgomery [11]
PartyCandidateVotes%±%
Conservative Herbert Watkin Williams-Wynn Unopposed
Registered electors 2,872
Conservative hold
General election 1859: Montgomery [11]
PartyCandidateVotes%±%
Conservative Herbert Watkin Williams-Wynn Unopposed
Registered electors 2,723
Conservative hold

Elections in the 1860s

1862 Montgomeryshire by-election [11]
PartyCandidateVotes%±%
Conservative Charles Williams-Wynn 1,269 57.0 N/A
Liberal Sudeley Hanbury-Tracy [12] 95943.0N/A
Majority31014.0N/A
Turnout 2,22883.3N/A
Registered electors 2,675
Conservative hold Swing
  • Caused by Williams-Wynn's death.
General election 1865: Montgomery [11]
PartyCandidateVotes%±%
Conservative Charles Williams-Wynn Unopposed
Registered electors 3,339
Conservative hold
General election 1868: Montgomery [11]
PartyCandidateVotes%±%
Conservative Charles Williams-Wynn Unopposed
Registered electors 4,810
Conservative hold

Elections in the 1870s

General election 1874: Montgomery [11]
PartyCandidateVotes%±%
Conservative Charles Williams-Wynn Unopposed
Registered electors 5,014
Conservative hold

Elections in the 1880s

General election 1880: Montgomery [11]
PartyCandidateVotes%±%
Liberal Stuart Rendel 2,232 52.2 N/A
Conservative Charles Williams-Wynn 2,04147.8N/A
Majority1914.4N/A
Turnout 4,27380.8N/A
Registered electors 5,291
Liberal gain from Conservative Swing N/A
General election 1885: Montgomery [13]
PartyCandidateVotes%±%
Liberal Stuart Rendel 4,044 54.4 +2.2
Conservative Charles Williams-Wynn 3,38945.6-2.2
Majority6558.8+4.4
Turnout 7,43383.8+3.0
Registered electors 8,870
Liberal hold Swing +2.2
General election 1886: Montgomery [13]
PartyCandidateVotes%±%
Liberal Stuart Rendel 3,799 54.1 -0.3
Conservative Devereux Herbert Mytton [14] 3,22045.9+0.3
Majority5798.2-0.6
Turnout 7,01979.1-4.7
Registered electors 8,870
Liberal hold Swing -0.3

Elections in the 1890s

General election 1892: Montgomery [13]
PartyCandidateVotes%±%
Liberal Stuart Rendel 3,662 56.3 +2.2
Conservative Devereux Herbert Mytton [14] 2,84743.7-2.2
Majority81512.6+4.4
Turnout 6,50973.3-5.8
Registered electors 8,880
Liberal hold Swing +2.2
1894 Montgomeryshire by-election [13]
PartyCandidateVotes%±%
Liberal Arthur Humphreys-Owen 3,440 51.7 -4.6
Conservative Watkin Williams-Wynn 3,21548.3+4.6
Majority2253.4-9.2
Turnout 6,65582.2+8.9
Registered electors 8,092
Liberal hold Swing -4.6
  • Caused by Rendel's elevation to the peerage.
General election 1895: Montgomery [13]
PartyCandidateVotes%±%
Liberal Arthur Humphreys-Owen 3,442 50.2 -6.1
Conservative Watkin Williams-Wynn 3,41549.8+6.1
Majority270.4-12.2
Turnout 6,85785.8+12.5
Registered electors 7,989
Liberal hold Swing -6.1

Elections in the 20th century

Elections in the 1900s

Humphreys-Owen Arthur Humphreys-Owen.jpg
Humphreys-Owen
General election 1900: Montgomery [13]
PartyCandidateVotes%±%
Liberal Arthur Humphreys-Owen 3,482 52.0 +1.8
Conservative Watkin Williams-Wynn 3,21848.0-1.8
Majority2644.0+3.6
Turnout 6,70084.6-1.2
Registered electors 7,915
Liberal hold Swing +1.8
David Davies David Davies MP.jpg
David Davies
General election 1906: Montgomery [13]
PartyCandidateVotes%±%
Liberal David Davies Unopposed
Registered electors
Liberal hold

Elections in the 1910s

General election January 1910: Montgomery [13]
PartyCandidateVotes%±%
Liberal David Davies 4,369 61.8 N/A
Conservative Arthur Williams-Wynn2,69738.2N/A
Majority1,67223.6N/A
Turnout 7,06689.1N/A
Registered electors 7,928
Liberal hold Swing N/A
General election December 1910: Montgomery [13]
PartyCandidateVotes%±%
Liberal David Davies Unopposed
Registered electors 7,928
Liberal hold
General election 1918: Montgomery [15]
PartyCandidateVotes%±%
Liberal David Davies Unopposed
Registered electors 24,949
Liberal hold
  • Davies was endorsed by the Coalition Government, but refused to accept the coupon.

Elections in the 1920s

General election 1922: Montgomery [15]
PartyCandidateVotes%±%
Liberal David Davies Unopposed
Registered electors 23,802
Liberal hold
General election 1923: Montgomery [15]
PartyCandidateVotes%±%
Liberal David Davies Unopposed
Registered electors 24,126
Liberal hold
General election 1924: Montgomery [15]
PartyCandidateVotes%±%
Liberal David Davies 14,942 77.3 N/A
Labour Arthur Davies4,38422.7N/A
Majority10,55854.6N/A
Turnout 19,32679.4N/A
Registered electors 24,338
Liberal hold Swing N/A
General election 1929: Montgomery [15]
PartyCandidateVotes%±%
Liberal Clement Davies 12,779 46.5 -30.8
Unionist John Murray Naylor10,65138.7N/A
Labour John Evans 4,06914.8-7.9
Majority2,1287.8-46.8
Turnout 27,49988.3+8.9
Registered electors 31,142
Liberal hold Swing -11.4

Elections in the 1930s

General election 1931: Montgomery [15]
PartyCandidateVotes%±%
National Liberal Clement Davies Unopposed
Registered electors 30,120
National Liberal hold
General election 1935: Montgomery [15]
PartyCandidateVotes%±%
National Liberal Clement Davies Unopposed
Registered electors 30,943
National Liberal hold

Elections in the 1940s

General election 1945: Montgomery [15]
PartyCandidateVotes%±%
Liberal Clement Davies 14,018 56.3 N/A
Conservative Philip Owen10,89543.7N/A
Majority3,12313.6N/A
Turnout 24,91377.4N/A
Registered electors 32,180
Liberal gain from National Liberal Swing N/A

Elections in the 1950s

General election 1950: Montgomery [16]
PartyCandidateVotes%±%
Liberal Clement Davies 14,401 50.0 -6.3
Conservative Harry West7,62126.5-17.2
Labour John David Williams6,76023.5N/A
Majority6,78023.5+9.9
Turnout 28,78288.9+11.5
Registered electors 32,372
Liberal hold Swing
General election 1951: Montgomery [16]
PartyCandidateVotes%±%
Liberal Clement Davies 17,075 68.5 +18.5
Labour David Caradog Jones7,85431.5+8.0
Majority9,22137.0+13.5
Turnout 24,92976.9-12.0
Registered electors 32,423
Liberal hold Swing
General election 1955: Montgomery [16]
PartyCandidateVotes%±%
Liberal Clement Davies 16,021 68.0 -0.5
Labour David Caradog Jones7,52132.0+0.5
Majority8,50036.0-1.0
Turnout 23,54273.6-3.3
Registered electors 31,983
Liberal hold Swing -0.5
General election 1959: Montgomery [16]
PartyCandidateVotes%±%
Liberal Clement Davies 10,970 42.0 -26.0
Conservative Frank Leslie Morgan8,17631.3N/A
Labour David Caradog Jones6,95026.6-5.4
Majority2,79410.7-25.3
Turnout 26,09683.8+10.2
Registered electors 31,152
Liberal hold Swing

Elections in the 1960s

1962 Montgomeryshire by-election [16]
PartyCandidateVotes%±%
Liberal Emlyn Hooson 13,181 51.3 +9.3
Conservative Robert H. Dawson5,63221.9-9.4
Labour Tudor Davies5,29920.6-6.0
Plaid Cymru Islwyn Ffowc Elis 1,5946.2N/A
Majority7,54929.4+18.7
Turnout 25,70685.1+1.3
Registered electors 30,202
Liberal hold Swing
General election 1964: Montgomery [16]
PartyCandidateVotes%±%
Liberal Emlyn Hooson 10,738 42.3 +0.3
Conservative Jerry Wiggin 6,76826.7-4.6
Labour Gwyn M. Evans5,69622.5-4.1
Plaid Cymru Islwyn Ffowc Elis 2,1678.5N/A
Majority3,97015.6+4.9
Turnout 25,36984.1+0.3
Registered electors 30,155
Liberal hold Swing
General election 1966: Montgomery [16]
PartyCandidateVotes%±%
Liberal Emlyn Hooson 10,278 41.5 -0.8
Conservative Jerry Wiggin 6,78427.4+0.7
Labour Gwyn M. Evans5,89123.8+1.3
Plaid Cymru Trefor Edwards1,8417.4-1.1
Majority3,49414.1-1.5
Turnout 24,79482.8-1.3
Registered electors 29,951
Liberal hold Swing

Elections in the 1970s

General election 1970: Montgomery [16]
PartyCandidateVotes%±%
Liberal Emlyn Hooson 10,202 38.4 -3.1
Conservative Delwyn Williams 7,89129.7+2.3
Labour David W. Thomas5,33520.1-3.7
Plaid Cymru Edward Millward 3,14511.8+4.4
Majority2,3118.7-5.4
Turnout 26,57382.3-0.5
Registered electors 32,304
Liberal hold Swing
General election February 1974: Montgomery [17]
PartyCandidateVotes%±%
Liberal Emlyn Hooson 12,495 45.4 +7.0
Conservative W R C Williams-Wynne7,84428.5-1.2
Labour P W Harries4,88817.8-2.3
Plaid Cymru A P Jones2,2748.3-3.5
Majority4,65116.9+8.2
Turnout 27,50182.6+0.3
Registered electors 33,303
Liberal hold Swing
General election October 1974: Montgomery [18]
PartyCandidateVotes%±%
Liberal Emlyn Hooson 11,280 43.1 -2.3
Conservative W R C Williams-Wynne7,42128.4-0.1
Labour P W Harries5,03119.2+1.4
Plaid Cymru A P Jones2,4409.3+1.0
Majority3,85914.7-2.2
Turnout 26,17277.9-4.7
Registered electors 33,583
Liberal hold Swing
General election 1979: Montgomery [19]
PartyCandidateVotes%±%
Conservative Delwyn Williams 11,751 40.3 +11.9
Liberal Emlyn Hooson 10,15834.9−8.2
Labour J Price4,75116.3−2.9
Plaid Cymru Carl Clowes 2,4748.5−0.8
Majority1,5935.4N/A
Turnout 29,13481.4+1.5
Registered electors 35,786
Conservative gain from Liberal Swing

Elections in the 1980s

General election 1983: Montgomery [20]
PartyCandidateVotes%±%
Liberal Alex Carlile 12,863 43.3 +8.4
Conservative Delwyn Williams 12,19541.1+0.8
Labour Joe Wilson 2,5508.6−7.7
Plaid Cymru Carl Clowes 1,5855.3−3.2
Independent David Rowlands4871.6N/A
Majority6682.2N/A
Turnout 29,68079.2−2.2
Registered electors 37,474
Liberal gain from Conservative Swing

In 1983 this was Labour's worst performance in Wales and the only seat where Labour won less than 12.5% and lost their £150 deposit. The threshold for retaining deposits was lowered to 5% in 1985.

General election 1987: Montgomery [21]
PartyCandidateVotes%±%
Liberal Alex Carlile 14,729 46.6 +3.3
Conservative David Evans12,17138.5−2.6
Labour Edward Llewellyn-Jones3,30410.5+1.9
Plaid Cymru Carl Clowes 1,4124.5−0.8
Majority2,5588.1+5.9
Turnout 31,61679.4+0.2
Registered electors 39,808
Liberal hold Swing

Elections in the 1990s

General election 1992: Montgomery [22] [23]
PartyCandidateVotes%±%
Liberal Democrats Alex Carlile 16,031 48.5 +1.9
Conservative Jeannie France-Hayhurst10,82232.7−5.8
Labour Stephen Wood4,11512.4+1.9
Plaid Cymru Hugh Parsons1,5814.8+0.3
Green Patrick Adams5081.5N/A
Majority5,20915.8+7.7
Turnout 33,05779.9+0.5
Registered electors 41,386
Liberal Democrats hold Swing
General election 1997: Montgomeryshire [24] [25]
PartyCandidateVotes%±%
Liberal Democrats Lembit Öpik 14,647 45.9 −2.6
Conservative Glyn Davies 8,34426.1−6.6
Labour Angharad Davies6,10919.1+6.7
Plaid Cymru Helen Mary Jones 1,6085.0+0.2
Referendum John Bufton 8792.8N/A
Green Susan Walker3381.1−0.4
Majority6,30319.8+4.0
Turnout 31,92574.7−5.2
Registered electors 60,873
Liberal Democrats hold Swing +2.0

Elections in the 21st century

Elections in the 2000s

General election 2001: Montgomeryshire [26] [27]
PartyCandidateVotes%±%
Liberal Democrats Lembit Öpik 14,319 49.4 +3.5
Conservative David Jones8,08527.9+1.8
Labour Paul Davies3,44311.9−7.2
Plaid Cymru David Senior1,9696.8+1.8
UKIP David Rowlands7862.7N/A
ProLife Alliance Ruth Davies2100.7N/A
Independent Reginald Taylor1710.6N/A
Majority6,23421.5+1.7
Turnout 28,98365.5−9.2
Registered electors 62,200
Liberal Democrats hold Swing +0.9
General election 2005: Montgomeryshire [28] [29]
PartyCandidateVotes%±%
Liberal Democrats Lembit Öpik 15,419 51.2 +1.8
Conservative Simon Baynes 8,24627.4−0.5
Labour David Tinline3,45411.5−0.4
Plaid Cymru Ellen ap Gwynn2,0786.9+0.1
UKIP Clive Easton9003.0+0.3
Majority7,17323.8+2.3
Turnout 30,09764.4−1.1
Registered electors 46,766
Liberal Democrats hold Swing +1.2

Elections in the 2010s

General election 2010: Montgomeryshire [30] [31]
PartyCandidateVotes%±%
Conservative Glyn Davies 13,976 41.3 +13.8
Liberal Democrats Lembit Öpik 12,79237.8−13.4
Plaid Cymru Heledd Fychan 2,8028.3+1.3
Labour Nick Colbourne2,4077.1−5.2
UKIP David W. L. Rowlands1,1283.3+0.4
National Front Milton Ellis3841.1N/A
Independent Bruce Lawson3241.0N/A
Majority1,1843.5N/A
Turnout 33,81369.4+3.1
Registered electors 48,730
Conservative gain from Liberal Democrats Swing +13.2

note: The David Rowlands who stood here is different from the David Rowlands who stood in Newport East at this election for UKIP.

General election 2015: Montgomeryshire [32] [33] [34]
PartyCandidateVotes%±%
Conservative Glyn Davies 15,204 45.0 +3.7
Liberal Democrats Jane Dodds [35] 9,87929.3−8.5
UKIP Des Parkinson [36] 3,76911.2+7.9
Labour Martyn Singleton [37] 1,9005.6−1.5
Plaid Cymru Ann Griffith [38] 1,7455.2−3.1
Green Richard Chaloner1,2603.7N/A
Majority5,32515.7+12.2
Turnout 33,75769.3−0.1
Registered electors 48,690
Conservative hold Swing +6.2
General election 2017: Montgomeryshire [39] [40]
PartyCandidateVotes%±%
Conservative Glyn Davies 18,075 51.8 +6.8
Liberal Democrats Jane Dodds 8,79025.2−4.1
Labour Iwan Wyn Jones5,54215.9+10.3
Plaid Cymru Aled Morgan Hughes1,9605.6+0.4
Green Richard Chaloner5241.5−2.2
Majority9,28526.6+10.9
Turnout 34,89170.1+0.8
Registered electors 50,755
Conservative hold Swing +5.5
General election 2019: Montgomeryshire [41] [42]
PartyCandidateVotes%±%
Conservative Craig Williams 20,020 58.5 +6.7
Liberal Democrats Kishan Devani7,88223.0−2.2
Labour Kait Duerden5,58516.3+0.4
Gwlad Gwlad Gwyn Evans7272.1N/A
Rejected ballots213
Majority12,13835.5+8.9
Turnout 34,21469.8−0.3
Registered electors 48,997
Conservative hold Swing +4.4

Of the 213 rejected ballots:

  • 156 were either unmarked or it was uncertain who the vote was for. [42]
  • 24 voted for more than one candidate. [42]
  • 33 had want of official mark. [42]

See also

Notes

  1. A county constituency (for the purposes of election expenses and type of returning officer).

Related Research Articles

<span class="mw-page-title-main">Aberavon (UK Parliament constituency)</span> Parliamentary constituency in the United Kingdom, 1918 onwards

Aberavon is a constituency represented in the House of Commons of the Parliament of the United Kingdom since 2015 by Stephen Kinnock of the Welsh Labour Party. It includes the town of Aberavon, although the largest town in the constituency is Port Talbot.

<span class="mw-page-title-main">Swansea West (UK Parliament constituency)</span> Parliamentary constituency in the United Kingdom, 1918 onwards

Swansea West is a constituency of the House of Commons of the Parliament of the United Kingdom. It elects one Member of Parliament (MP) by the first past the post system of election, and is currently represented by Geraint Davies of Labour Co-op, who was first elected in the constituency in 2010.

<span class="mw-page-title-main">Cardiff North (UK Parliament constituency)</span> Parliamentary constituency in the United Kingdom, 1950 onwards

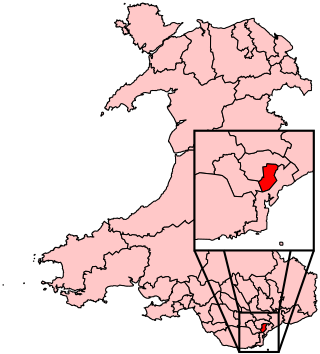
Cardiff North is a constituency represented in the House of Commons of the UK Parliament since 2017 by Anna McMorrin of the Labour Party.

<span class="mw-page-title-main">Monmouth (UK Parliament constituency)</span> Parliamentary constituency in the United Kingdom, 1918 onwards

Monmouth was a county constituency of the House of Commons of the Parliament of the United Kingdom. The seat was created for the 1918 general election. From 2005 until 2024 the Member of Parliament (MP) was David Davies of the Conservative Party.

<span class="mw-page-title-main">Cardiff Central (UK Parliament constituency)</span> Parliamentary constituency in the United Kingdom, 1983 onwards

Cardiff Central is a borough constituency in the city of Cardiff. It returns one Member of Parliament (MP) to the House of Commons of the Parliament of the United Kingdom, elected by the first past the post system. The seat is currently held by Jo Stevens of the Labour Party. She was appointed as Shadow Secretary of State for Digital, Culture, Media and Sport on 6 April 2020.

<span class="mw-page-title-main">Blaenau Gwent (UK Parliament constituency)</span> Parliamentary constituency in the United Kingdom, 1983 onwards

Blaenau Gwent is a constituency in South Wales, represented in the House of Commons of the UK Parliament since 2010 by Nick Smith of the Labour Party.

<span class="mw-page-title-main">Brecon and Radnorshire (UK Parliament constituency)</span> Parliamentary constituency in the United Kingdom, 1918 onwards

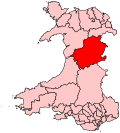
Brecon and Radnorshire is a county constituency in Wales of the House of Commons of the Parliament of the United Kingdom. Created in 1918, it elects one Member of Parliament (MP) by the first-past-the-post system of election. The constituency is represented by Fay Jones of the Conservative Party, who defeated incumbent Jane Dodds of the Liberal Democrats at the 2019 general election.

<span class="mw-page-title-main">Bridgend (UK Parliament constituency)</span> Parliamentary constituency in the United Kingdom, 1983 onwards

Bridgend is a constituency represented in the House of Commons of the UK Parliament since 2019 by Jamie Wallis, a Conservative.

<span class="mw-page-title-main">Cardiff South and Penarth (UK Parliament constituency)</span> Parliamentary constituency in the United Kingdom, 1983 onwards

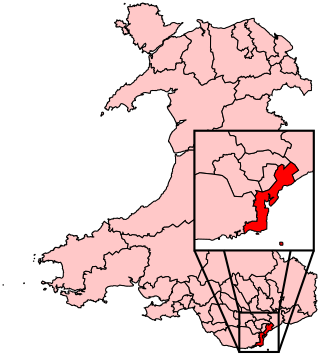
Cardiff South and Penarth is a constituency created in 1983 represented in the House of Commons of the UK Parliament since 2012 by Stephen Doughty, a Labour Co-op MP. It is the largest such entity in Wales, with an electorate of 75,175 and one of the most ethnically diverse.

<span class="mw-page-title-main">Cardiff West (UK Parliament constituency)</span> Parliamentary constituency in the United Kingdom, 1950 onwards

Cardiff West is a constituency represented in the House of Commons of the UK Parliament since 2001 by Kevin Brennan of the Labour Party.

<span class="mw-page-title-main">Clwyd South (UK Parliament constituency)</span> Parliamentary constituency in the UK

Clwyd South is a constituency of the House of Commons of the Parliament of the United Kingdom (Westminster). The constituency was created in 1997, and it elects one Member of Parliament (MP) by the first past the post method of election.

<span class="mw-page-title-main">Cynon Valley (UK Parliament constituency)</span> Parliamentary constituency in the United Kingdom, 1983 onwards

Cynon Valley is a constituency in Wales represented in the House of Commons of the UK Parliament since 2019 by Beth Winter of the Labour Party.

<span class="mw-page-title-main">Gower (UK Parliament constituency)</span> Parliamentary constituency in the United Kingdom, 1885 onwards

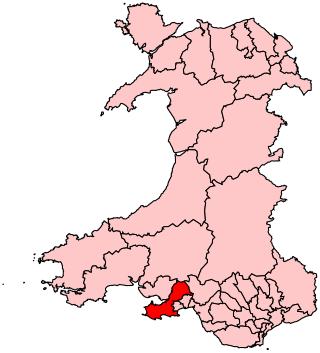
Gower is a constituency created in 1885 and represented in the House of Commons of the UK Parliament by one Member of Parliament (MP). Tonia Antoniazzi of the Labour Party became its MP after winning it from Conservative Byron Davies in the 2017 UK general election. Her party had previously represented the seat from 1909 until 2015.

<span class="mw-page-title-main">Islwyn (UK Parliament constituency)</span> Parliamentary constituency in the United Kingdom, 1983 onwards

Islwyn was a constituency in Wales represented in the House of Commons of the Parliament of the United Kingdom. The area, historically known for coal-mining, has voted for Labour Party candidates since it was created effective at the 1983 general election. Islwyn's first Member of Parliament (MP) was Neil Kinnock, who represented it until he resigned from Parliament in 1995. Kinnock also served as Leader of the Labour Party and Leader of the Opposition from 1983 until 1992.

<span class="mw-page-title-main">Newport West (UK Parliament constituency)</span> Parliamentary constituency in the United Kingdom, 1983 onwards

Newport West was one of two parliamentary constituencies for the city of Newport, South Wales, in the House of Commons of the Parliament of the United Kingdom. It elected one Member of Parliament (MP) using the first-past-the-post voting system. Paul Flynn, of the Labour Party, was the MP from the 1987 general election until his death on 17 February 2019. Consequently, a by-election was held in the constituency on Thursday 4 April 2019 and Ruth Jones of the Labour Party was elected.

<span class="mw-page-title-main">Ogmore (UK Parliament constituency)</span> Parliamentary constituency in the United Kingdom, 1918 onwards

Ogmore is a constituency created in 1918 represented in the House of Commons of the UK Parliament by Chris Elmore of the Labour Party.

<span class="mw-page-title-main">Swansea East (UK Parliament constituency)</span> Parliamentary constituency in the United Kingdom, 1918 onwards

Swansea East is a borough constituency represented in the House of Commons of the Parliament of the United Kingdom by Carolyn Harris of the Labour Party.

<span class="mw-page-title-main">Torfaen (UK Parliament constituency)</span> Parliamentary constituency in the United Kingdom, 1983 onwards

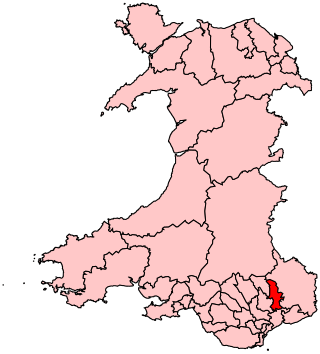
Torfaen is a constituency in Wales represented in the House of Commons of the UK Parliament since 2015 by Nick Thomas-Symonds, a member of the Labour Party who also serves as the Shadow Secretary of State for International Trade. It was established for the 1983 general election.

<span class="mw-page-title-main">Vale of Glamorgan (UK Parliament constituency)</span> Parliamentary constituency in the United Kingdom, 1983 onwards

Vale of Glamorgan is a constituency represented in the House of Commons of the UK Parliament since 2010 by Alun Cairns, a Conservative.

<span class="mw-page-title-main">Wrexham (UK Parliament constituency)</span> Parliamentary constituency in the United Kingdom, 1918 onwards

Wrexham is a parliamentary constituency centred on the city of Wrexham in the preserved county of Clwyd, Wales in the United Kingdom. It was created in 1918, and is represented in the House of Commons of the UK Parliament from December 2019 by Sarah Atherton of the Conservative Party.

References

  1. "Beyond 20/20 WDS - Table view". 2011 Electorate Figures. StatsWales. 1 December 2010. Retrieved 13 March 2011.
  2. "Welsh Labour 'has longest winning streak of any party in the world'". BBC News. 15 November 2022.
  3. "It's All Change For MPs, Political map to be transformed". Shropshire Star. 13 September 2016. p. 1.Report by Mark Andrews.
  4. "Former MP urges re-think on move". Shropshire Star. 17 September 2016. p. 16.Report based on criticism of proposals by former Montgomeryshire MP Delwyn Williams.
  5. 2023 Review of Parliamentary Constituencies - The 2023 Review of Parliamentary Constituencies in Wales (PDF). Boundary Commission for Wales. 28 June 2023.
  6. 1 2 3 4 5 6 7 8 "History of Parliament" . Retrieved 30 August 2011.
  7. 1 2 3 4 5 6 7 8 9 10 "History of Parliament" . Retrieved 30 August 2011.
  8. Leigh Rayment's Historical List of MPs – Constituencies beginning with "M" (part 3)
  9. 1 2 3 4 5 6 7 8 Stooks Smith, Henry (1845). The Parliaments of England, from 1st George I., to the Present Time. Vol II: Oxfordshire to Wales Inclusive. London: Simpkin, Marshall, & Co. pp. 195–196. Retrieved 7 May 2020 via Google Books.
  10. 1 2 3 Escott, Margaret. "Montgomeryshire". The History of Parliament. Retrieved 7 May 2020.
  11. 1 2 3 4 5 6 7 8 9 10 11 12 13 14 Craig, F. W. S. (1977). British Parliamentary Election Results 1832-1885 (1 ed.). London: Macmillan Press ISBN   978-1-349-02349-3.
  12. "Montgomeryshire" . Derby Mercury . 9 July 1862. p. 8. Retrieved 6 March 2018 via British Newspaper Archive.
  13. 1 2 3 4 5 6 7 8 9 Craig, F. W. S. (1974). British parliamentary election results 1885-1918 (1 ed.). London and Basingstoke: The Macmillan Press Ltd. ISBN   9780333169032. Page 486
  14. 1 2 Lythgoe, Darrin. "Devereux Herbert Mytton". Tathamfamilyhistory. Retrieved 12 November 2017.
  15. 1 2 3 4 5 6 7 8 Craig, F. W. S. (1969). British parliamentary election results 1918-1949 (1 ed.). Glasgow: Political Reference Publications. ISBN   0-900178-019. Page
  16. 1 2 3 4 5 6 7 8 Craig, F. W. S. (1971). British parliamentary election results 1950-1970 (1 ed.). Chichester: Political Reference Publications. ISBN   9780900178023. Page 589
  17. "Politics Resources". Election February 1974. Politics Resources. 28 February 1974. Archived from the original on 11 August 2011. Retrieved 2 February 2021.
  18. "Politics Resources". Election October 1974. Politics Resources. 10 October 1974. Archived from the original on 11 August 2011. Retrieved 2 February 2021.
  19. "Politics Resources". Election 1979. Politics Resources. 3 May 1979. Archived from the original on 11 August 2011. Retrieved 2 February 2021.
  20. "Election Data 1983". Electoral Calculus. Archived from the original on 15 October 2011. Retrieved 18 October 2015.
  21. "Election Data 1987". Electoral Calculus. Archived from the original on 15 October 2011. Retrieved 18 October 2015.
  22. "Election Data 1992". Electoral Calculus. Archived from the original on 15 October 2011. Retrieved 18 October 2015.
  23. "Politics Resources". Election 1992. Politics Resources. 9 April 1992. Archived from the original on 24 July 2011. Retrieved 6 December 2010.
  24. "Election Data 1997". Electoral Calculus. Archived from the original on 15 October 2011. Retrieved 18 October 2015.
  25. "BBC NEWS > Montgomeryshire". Vote 2001. BBC News. 7 June 2001. Retrieved 4 April 2020.
  26. "Election Data 2001". Electoral Calculus. Archived from the original on 15 October 2011. Retrieved 18 October 2015.
  27. "BBC NEWS > Aberavon". Vote 2001. BBC News. 7 June 2001. Retrieved 4 April 2020.
  28. "Election Data 2005". Electoral Calculus. Archived from the original on 15 October 2011. Retrieved 18 October 2015.
  29. "Montgomeryshire parliamentary constituency - Election 2005" via www.bbc.co.uk.
  30. "Election Data 2010". Electoral Calculus. Archived from the original on 26 July 2013. Retrieved 17 October 2015.
  31. "BBC NEWS – Election 2010 – Montgomeryshire". BBC News.
  32. "Election Data 2015". Electoral Calculus. Archived from the original on 17 October 2015. Retrieved 17 October 2015.
  33. "Powys election results". 2015 general election results. Powys County Council. Retrieved 20 September 2015.
  34. "Montgomeryshire Parliamentary constituency". Election 2015 Results. BBC. Retrieved 4 April 2020.
  35. "Jane Dodds - Parliamentary Candidate for Montgomeryshire (Montgomeryshire Liberal Democrats)". Archived from the original on 6 July 2014. Retrieved 3 July 2014.
  36. "4587404460". Archived from the original on 12 March 2015. Retrieved 13 February 2015.
  37. "Labour reveal Martyn Singleton as candidate". Mywelshpool.co.uk. 31 March 2015. Retrieved 19 September 2017.
  38. "Labour reveal Martyn Singleton as candidate". Mywelshpool.co.uk. Retrieved 19 September 2017.
  39. "Statement of Persons Nominated and Notice of Poll" (PDF). Powys County Council. 11 May 2017. Retrieved 6 June 2017.
  40. "Montgomeryshire parliamentary constituency - Election 2017". BBC News. Retrieved 9 June 2017.
  41. "Montgomeryshire parliamentary constituency - Election 2019" via www.bbc.co.uk.
  42. 1 2 3 4 "Election-Results/General-Election-2019". Powys County Council. Retrieved 4 April 2020.

Further reading

52°38′24″N3°28′08″W / 52.640°N 3.469°W / 52.640; -3.469