2008 United States presidential election in Washington (state)

Last updated

2008 United States presidential election in Washington (state)
Flag of Washington.svg
  2004 November 4, 2008 2012  
Turnout84.61% (of registered voters) Increase2.svg2.56% [1]
  Obama portrait crop.jpg John McCain 2009 Official.jpg
Nominee Barack Obama John McCain
Party Democratic Republican
Home state Illinois Arizona
Running mate Joe Biden Sarah Palin
Electoral vote110
Popular vote1,750,8481,229,216
Percentage57.34%40.26%

Washington Presidential Election Results 2008.svg
2008 US Presidential election in Washington by congressional district.svg

President before election

George W. Bush
Republican

Elected President

Barack Obama
Democratic

The 2008 United States presidential election in Washington took place on November 4, 2008, and was part of the 2008 United States presidential election. Voters chose 11 representatives, or electors to the Electoral College, who voted for president and vice president.

Contents

The State of Washington was won by Democratic nominee Barack Obama by a 17.1% margin of victory. Prior to the election, all 17 news organizations considered this a state Obama would win, or otherwise considered as a safe blue state. No Republican presidential nominee had won the State of Washington since Ronald Reagan won the state in 1984. Continuing on that trend, Washington stayed in the Democratic column as Obama carried the state with over 57% of the vote.

As of the 2020 presidential election , this is the last election in which Skamania County, Klickitat County, and Wahkiakum County voted for the Democratic candidate. This is also the last time the Democrat carried more counties than the Republican. Obama became the first ever Democrat to win the White House without carrying Ferry County, as well as the first to do so without carrying Asotin County since Woodrow Wilson in 1912.

Primaries

Democratic primary

The Democratic caucuses were a series of events held by the Washington State Democratic Party to determine the delegates that the Party sent to the 2008 Democratic National Convention. Delegates were selected in a four-tier process that began with precinct caucuses, was further refined in legislative district caucuses and/or county conventions, concluded for some delegates in the congressional district caucuses, and finally concluded for the remaining delegates at the state convention.

Washington also held a Democratic primary on February 19, 2008, but the Washington State Democratic Party did not use the results of the primary to determine its delegates. [2]

Delegate breakdown

The Washington State Democratic Party sent a total of 97 delegates to the 2008 Democratic National Convention. Of those delegates, 78 were pledged and 19 were unpledged. The 78 pledged delegates were allocated (pledged) to vote for a particular candidate at the national convention according to the results of Washington's four-step caucus process. The 19 unpledged delegates were popularly called "superdelegates" because their vote represented their personal decisions, whereas the regular delegates' votes represented the collective decision of many voters. The superdelegates were free to vote for any candidate at the national convention and were selected by the Washington State Democratic Party's officials and the pledged delegates. [3] [4]

The 78 pledged delegates were further divided into 51 district delegates and 27 statewide delegates. The 51 district delegates were divided among Washington's 9 congressional districts and were allocated to the presidential candidates based on the caucus results in each district. The 27 statewide delegates were divided into 17 at-large delegates and 10 party leaders and elected officials (abbreviated PLEOs). They were allocated to the presidential candidates at the state convention based on the preference of the 51 district delegates on June 13–15. [3] [4]

Of the 19 unpledged delegates, 17 were selected in advance and 2 were selected at the state convention. The delegates selected in advance were 7 Democratic National Committee members, the 2 Democratic U.S. senators from Washington, Maria Cantwell and Patty Murray, the 6 Democratic U.S. representatives from Washington, and the Democratic governor of Washington, Christine Gregoire. [3] [4]

Delegate selection process

Precinct caucuses

The precinct caucuses took place on February 9, 2008. Washington's two senators, Patty Murray and Maria Cantwell, endorsed Senator Hillary Clinton earlier in the nomination season. [5] The week before the caucuses, Washington's governor, Christine Gregoire, endorsed Senator Barack Obama. [6]

The caucuses were open to all voters who would be 18 years old by November 4, 2008. To vote, participants completed a form with their contact information and candidate preference. The form also asked voters to sign an oath stating: "I declare that I consider myself to be a DEMOCRAT and I will not participate in the nomination process of any other political party for the 2008 Presidential election." In some caucus groups, members split into smaller groups according to the candidate they supported. Voters supporting non-viable candidates had the option of moving into viable groups, and voters in viable groups could change their preference. [7] Unlike other state Democratic Party caucuses, Washington does not require a 15% threshold for allocation of delegates at the precinct level. Rules state that any fractional delegates remaining are awarded to the candidate with the most votes that do not have delegates.

Legislative district caucuses and county conventions

Democrats vote in the 43rd Legislative District Caucus, April 5, 2008 43rd Legislative District Democratic Caucus 1.jpg
Democrats vote in the 43rd Legislative District Caucus, April 5, 2008

The second tier of the delegate selection process involved choosing 2,000 legislative district delegates (and 1,000 alternates) to send to the congressional district conventions on May 17 and the state convention on June 13–15. [8] There are 49 legislative districts in Washington State. Each district was allocated a certain number of delegates. [9] Delegates were elected at either legislative district caucuses or county conventions. Each of Washington's 39 counties has a local Democratic Party organization that determined the event at which delegate selection would take place. Most counties chose to select delegates at legislative district caucuses on April 5. The remaining counties selected delegates at sub-caucuses during their county conventions, most of which were held on either April 12 or April 19. The breakdown of events by date is listed below. [10] [11]

April 5

Legislative district caucuses:

  • 1st through 6th
  • 8th
  • 11th
  • 12th
  • 16th (Benton County portion only, held at the 8th LD caucus)
  • 21st
  • 25th through 34th
  • 36th through 39th
  • 40th (San Juan County portion only)
  • 41st through 48th

County convention:

  • Whatcom (40th LD)
April 12

County conventions:

  • Clallam (24th LD)
  • Franklin (9th & 16th LDs)
  • Grays Harbor (19th, 24th & 35th LDs)
  • Kitsap (23rd & 35th LDs)
  • Kittitas (13th LD)
  • Pend Oreille (7th LD)
  • Skagit (10th & 40th LDs)
April 13

County convention:

  • Snohomish (10th LD)
April 19

County conventions:

  • Asotin (9th LD)
  • Chelan (13th LD)
  • Clark (15th, 17th, 18th & 49th LDs)
  • Cowlitz (18th & 19th LDs)
  • Ferry (7th LD)
  • Grant (13th LD)
  • Island (10th LD)
  • Klickitat (15th LD)
  • Lewis (20th LD)
  • Lincoln (7th LD)
  • Mason (35th LD)
  • Okanogan (7th LD)
  • Pacific (19th LD)
  • Skamania (15th LD)
  • Spokane (7th & 9th LDs)
  • Stevens (7th LD)
  • Thurston (20th, 22nd & 35th LDs)
  • Wahkiakum (19th LD)
  • Whitman (9th LD)
  • Yakima (13th, 14th & 15th LDs)
April 20

County convention:

  • Walla Walla (16th LD)
April 26

County convention:

  • Jefferson (24th LD)
Unknown date

County conventions:

  • Adams (9th LD)
  • Garfield (9th LD)
  • Columbia (16th LD)

Congressional district caucuses

Fifty-one delegates were chosen at the nine congressional district caucuses. Each district was allotted a different number of delegates:

  • CD 1: 6
  • CD 2: 6
  • CD 3: 5
  • CD 4: 3
  • CD 5: 5
  • CD 6: 6
  • CD 7: 9
  • CD 8: 6
  • CD 9: 5

State convention

Twenty-nine delegates were chosen at the state convention, twenty-seven of which were pledged to vote for a particular candidate. Seventeen of these pledged delegates were "at-large" delegates that did not represent a specific Washington congressional district, and ten were party leaders and elected officials (PLEOs).

Polls

Results

Precinct caucuses

Caucus date: February 9, 2008

National pledged delegates determined: 0 (of 78)

2008 Washington Democratic presidential precinct caucuses
96.4% of precincts reporting [12]
CandidatePrecinct delegatesPercentageEstimated national delegates [7]
Barack Obama 21,76867.56%52
Hillary Clinton 10,03831.15%26
Other500.16%0
Uncommitted3641.13%0
Totals32,220100.00%78

Primary

The Washington State Democratic Party did not use the results of the primary to determine its delegates. [2]

Primary date: February 19, 2008

National pledged delegates determined: 0 (of 78)

Key:Withdrew
prior to contest
2008 Washington Democratic presidential primary [13]
CandidateVotesPercentage
Barack Obama 354,11251.22%
Hillary Clinton 315,74445.67%
John Edwards 11,8921.72%
Dennis Kucinich 4,0210.58%
Bill Richardson 2,0400.30%
Joe Biden 1,8830.27%
Mike Gravel 1,0710.15%
Christopher Dodd 6180.09%
Totals691,381100.00%

Legislative district caucuses and county conventions

Dashes indicate districts for which results are unavailable.

Caucus/Convention dates: April 5–26, 2008

National pledged delegates determined: 0 (of 78)

Washington Democratic Legislative District Caucuses
and County Conventions, 2008
61% of districts reporting
Legislative
District
Barack
Obama
Hillary
Clinton
Total State Delegates
from this LD [9]
LD1 [14] 321244
LD2 [15] 261440
LD333
LD438
LD5 [16] 361248
LD6 [17] 291544
LD734
LD833
LD933
LD1043
LD11 [18] 261036
LD1231
LD1328
LD1427
LD1526
LD1628
LD1739
LD1844
LD1938
LD20 [19] 251338
LD2140
LD22 [20] 361349
LD23 [21] 341145
LD24 [22] 281047
LD25 [23] 261541
LD26 [24] 281442
LD27 [25] 271239
LD2834
LD2930
LD3035
LD31 [26] 221638
LD32 [27] 361450
LD33 [28] 231235
LD34 [29] 381351
LD35 [30] 15841
LD36 [31] 521567
LD37 [31] 38947
LD38 [32] 231134
LD39 [33] 271239
LD40 [34] 36947
LD41 [35] 361349
LD42 [36] 331043
LD43 [37] 531467
LD44 [38] 301343
LD45 [39] 331245
LD46 [40] 451560
LD47 [41] 271138
LD48 [42] 301141
LD4938
Totals9503692,000
Estimated
national delegates
0078

Congressional district caucuses

Caucus date: May 17, 2008

National pledged delegates determined: 51 (of 78)

Washington Democratic Congressional District Caucuses, 2008
0% of districts reporting
Congressional DistrictNational Delegates Obama [43] National Delegates Clinton [44] National Delegates Total
CD1 [45] 426
CD2426
CD3325
CD4213
CD5325
CD6426
CD7 [46] 729
CD8426
CD9325
Totals341751

State convention

Convention date: June 13–15, 2008

National pledged delegates determined: 27 (of 78)

2008 Washington Democratic State Convention [4]
CandidateAt-Large and PLEO delegatesPercentageNational delegates
Barack Obama 1866.67%52
Hillary Clinton 933.33%26
Totals27100.00%78

Republican caucuses and primary

The Republican caucuses were held on Saturday February 9 and the primary on February 19, 2008, to compete 40 total delegates, of which 18 tied to the caucuses, 19 tied to the primary, and 3 unpledged RNC member delegates. [47]

Candidates

All following candidates appeared on the ballot for voters in Washington:

Caucuses

Voting in Washington's caucuses closed at 9:00 pm EST February 9.

The Washington Republican Party declared John McCain the winner on the night of the election, after 87% of the votes were counted. Mike Huckabee disputed the results and accused the state party of calling the election prematurely. He demanded a statewide caucus recount. [48] However, by Tuesday, February 12, the Washington Republicans again declared McCain the winner after 96% of the votes were tallied, [49] and never counted the rest of the votes. [50]

96% of precincts reporting [47]
CandidateState delegatePercentageDelegatesCounties carried
John McCain 3,22825.9%1611
Mike Huckabee 2,95923.52%811
Ron Paul 2,74021.64%59
Mitt Romney 1,90315.45%04
Uncommitted1,66213.49%02
Total12,320100%2937

Primary

The primary took place on February 19, 2008.

Official results [47] [51]
CandidateVotesPercentageDelegates
John McCain 262,30449.50%16
Mike Huckabee 127,65724.09%8
Mitt Romney*86,14016.25%0
Ron Paul 40,5397.65%5
Rudy Giuliani*5,1450.97%0
Fred Thompson*4,8650.92%0
Alan Keyes 2,2260.42%0
Duncan Hunter*7990.19%0
Total529,932100%29

* Candidate stopped campaign before primary

Money raised

The following table shows the amount of money each Republican Party candidate raised in the state of Washington. [52]

Campaign

Predictions

SourceRanking
D.C. Political Report [53] Likely D
Cook Political Report [54] Solid D
The Takeaway [55] Solid D
Electoral-vote.com [56] Solid D
Washington Post [57] Solid D
Politico [58] Solid D
RealClearPolitics [59] Solid D
FiveThirtyEight [57] Solid D
CQ Politics [60] Solid D
The New York Times [61] Solid D
CNN [62] Safe D
NPR [57] Solid D
MSNBC [57] Solid D
Fox News [63] Likely D
Associated Press [64] Likely D
Rasmussen Reports [65] Safe D

Since February 28, Obama won every pre-election poll. Since September 22, he won each poll with a double-digit margin of victory. The final 3 polls averaged Obama leading 54% to 40%.

Fundraising

McCain raised a total of $2,697,999 in the state. Obama raised $16,518,208. [66]

Advertising and visits

Obama and his interest groups spent $312,869. McCain and his interest groups spent just $2,264. [67] The Democratic ticket visited the state once, while the Republican ticket did not visit at all. [68]

Analysis

Washington once leaned Republican, like most of the Pacific Northwest. From 1952 to 1984, it only went Democratic twice—in 1964 and 1968. However, it has voted for the Democratic presidential nominee in every presidential election since 1988. Neither candidate seriously contested the state as it was viewed as a safe blue state. Like Oregon, the state is divided politically by the urban/rural divide and geographically by the Cascade Mountains. The two are related in that nearly all of the major cities lie west of the Cascades. Most of the state's population resides in Western Washington along the Pacific Coast and in highly urbanized areas like Seattle. The Seattle area, home to almost two-thirds of the state's population, is overwhelmingly Democratic. The rest of Western Washington leans Democratic as well, though the lean is not as pronounced as in the greater Seattle area. In contrast, Eastern Washington is very rural, and in many ways more similar to Idaho than Seattle. Republicans have had an edge here for many years, in part to its strong tinge of social conservatism. As a result, while Republicans typically win more counties, the overwhelming Democratic trend in the more-heavily populated western portion is enough to swing the whole state to the Democrats.

On Election Day, Obama won the state by 17.18%. Washington was called for Obama as soon as the polls in the state closed. He swept the more urban counties along the Western Seaboard, which compose the Democratic base. More than two-thirds of the state's population lives in this area; this makes it very difficult for a Republican to win the state because of this region's liberal tilt. Obama would have been assured a victory in any event due to his performance in the Seattle area. He carried King County, home to Seattle itself and its close suburbs and just over a third of the state's population, with 69.97 percent of the vote—almost three-fifths of his statewide majority. Obama also swept the two other big counties in Western Washington, Pierce (home to Tacoma) and Snohomish (home to Everett) by decisive margins. His combined majority in King, Pierce and Snohomish counties would have been more than enough to carry the state. McCain only won one county in the western part of the state, Lewis County, traditionally the most socially conservative county west of the Cascades.

On the other hand, McCain did extremely well in Eastern Washington. Neither Al Gore or John Kerry was able to take a single county in Eastern Washington; in 2008, Obama only won one small county, Whitman County, home to Washington State University in Pullman. Nevertheless, as with Oregon, McCain's margins in the eastern part of the state were far outweighed by Obama's landslides in the more populated coastal regions and cities in the western part of the state. Obama did, however, improve substantially in Eastern Washington, especially in the region's largest county, Spokane County, home to the city of Spokane.

During the same election, incumbent Democratic Governor Christine Gregoire was reelected to a second term with 53.00% of the vote over Republican Dino Rossi who took 46.55% in a rematch of their controversial race from four years earlier. At the state level, Democrats picked up one seat in the Washington House of Representatives while Republicans picked up a seat in the Washington Senate.

Results

2008 United States presidential election in Washington (state)
PartyCandidateRunning mateVotesPercentageElectoral votes
Democratic Barack Obama Joe Biden 1,750,84857.34%11
Republican John McCain Sarah Palin 1,229,21640.26%0
Independent Ralph Nader Matt Gonzalez 29,4890.97%0
Write-insWrite-ins14,8800.49%0
Libertarian Bob Barr Wayne Allyn Root 12,7280.42%0
Constitution Chuck Baldwin Darrell Castle9,4320.31%0
Green Cynthia McKinney Rosa Clemente 3,8190.13%0
OthersOthers6,6420.22%0
Totals3,057,054100.00%11
Voter turnout (Voting age population)62.2%

By county

CountyBarack Obama
Democratic
John McCain
Republican
Various candidates
Other parties
MarginTotal
#%#%#%#%
Adams 1,55231.95%3,22266.32%841.73%-1,670-34.37%4,858
Asotin 4,13942.32%5,45155.74%1901.94%-1,312-13.42%9,780
Benton 26,28835.84%45,34561.83%1,7082.33%-19,057-25.99%73,341
Chelan 13,78142.85%17,60554.74%7772.41%-3,824-11.89%32,163
Clallam 19,47050.55%18,19947.25%8512.21%1,2713.30%38,520
Clark 95,35651.85%84,21245.79%4,3572.37%11,1446.06%183,925
Columbia 68630.38%1,49966.39%733.24%-813-36.01%2,258
Cowlitz 24,59754.05%19,55442.96%1,3612.99%5,04311.09%45,512
Douglas 5,84838.26%9,09859.52%3392.22%-3,250-21.26%15,285
Ferry 1,46741.49%1,91654.19%1534.33%-449-12.70%3,536
Franklin 7,36137.19%12,03760.81%3972.01%-4,676-23.62%19,795
Garfield 38528.04%96870.50%201.46%-583-42.46%1,373
Grant 9,60134.74%17,15362.07%8803.18%-7,552-27.33%27,634
Grays Harbor 16,35456.04%12,10441.47%7262.49%4,25014.57%29,184
Island 22,05852.31%19,42646.07%6801.61%2,6326.24%42,164
Jefferson 13,25265.85%6,33031.46%5412.69%6,92234.39%20,123
King 648,23069.97%259,71628.03%18,5112.00%388,51441.94%926,457
Kitsap 68,62454.89%53,29742.63%3,0902.47%15,32712.26%125,011
Kittitas 8,03044.67%9,47152.68%4762.65%-1,441-8.01%17,977
Klickitat 4,96548.85%4,94448.64%2552.51%210.21%10,164
Lewis 13,62438.96%20,27857.99%1,0673.05%-6,654-19.03%34,969
Lincoln 2,03233.82%3,80363.30%1732.88%-1,771-29.48%6,008
Mason 15,05052.78%12,60044.19%8633.03%2,4508.59%28,513
Okanogan 7,61344.82%8,79851.79%5763.39%-1,185-6.97%16,987
Pacific 6,09455.12%4,55541.20%4063.67%1,53913.92%11,055
Pend Oreille 2,56238.79%3,71756.28%3264.94%-1,155-17.49%6,605
Pierce 181,82454.88%141,67342.76%7,8392.37%40,15112.12%331,336
San Juan 7,37469.66%2,95827.94%2542.40%4,41641.72%10,586
Skagit 30,05353.42%24,68743.89%1,5132.69%5,3669.53%56,253
Skamania 2,81751.31%2,52445.97%1492.71%2935.34%5,490
Snohomish 187,29458.13%126,72239.33%8,1832.54%60,57218.80%322,199
Spokane 105,78647.87%108,31449.01%6,9073.13%-2,528-1.14%221,007
Stevens 8,49937.62%13,13258.13%9604.25%-4,633-20.51%22,591
Thurston 75,88259.57%48,36637.97%3,1422.47%27,51621.60%127,390
Wahkiakum 1,12148.61%1,10547.92%803.47%160.69%2,306
Walla Walla 10,08140.52%14,18257.01%6142.47%-4,101-16.49%24,877
Whatcom 58,23657.71%40,20539.84%2,4652.44%18,03117.87%100,906
Whitman 9,07051.57%8,10446.07%4152.36%9665.50%17,589
Yakima 33,79243.58%41,94654.10%1,7962.32%-8,154-10.52%77,534
Totals1,750,84857.34%1,229,21640.26%73,1972.40%521,63217.08%3,053,261
County Flips:
Democratic
Hold
Gain from Republican
Republican
Hold Washington County Flips 2008.svg
County Flips:

Counties that flipped from Republican to Democratic

By congressional district

Barack Obama carried 7 of the state's 9 congressional districts, including one district held by a Republican.

DistrictMcCainObamaRepresentative
1st 35.93%62.44% Jay Inslee
2nd 42.00%55.60% Rick Larsen
3rd 45.66%52.37% Brian Baird
4th 57.84%40.30% Doc Hastings
5th 51.54%45.97% Cathy McMorris Rodgers
6th 40.51%57.43% Norm Dicks
7th 14.96%83.54% Jim McDermott
8th 41.83%56.62% Dave Reichert
9th 39.47%58.72% Adam Smith

Electors

Technically the voters of Washington cast their ballots for electors: representatives to the Electoral College. Washington is allocated 11 electors because it has 9 congressional districts and 2 senators. All candidates who appear on the ballot or qualify to receive write-in votes must submit a list of 11 electors, who pledge to vote for their candidate and their running mate. Whoever wins the majority of votes in the state is awarded all 11 electoral votes. Their chosen electors then vote for president and vice president. Although electors are pledged to their candidate and running mate, they are not obligated to vote for them. [69] An elector who votes for someone other than their candidate is known as a faithless elector.

The electors of each state and the District of Columbia met on December 15, 2008, to cast their votes for president and vice president. The Electoral College itself never meets as one body. Instead the electors from each state and the District of Columbia met in their respective capitols.

The following were the members of the Electoral College from the state. All 11 were pledged to Barack Obama and Joe Biden: [70]

  1. Jeff Siddiqui [71]
  2. Maggie Hanson
  3. Jane Buchanan‐Banks
  4. Pat M. Notter
  5. Marcus Riccelli [72]
  6. Bradford Donovan
  7. Lesley Ahmed [73]
  8. Di A. Irons [74]
  9. Calvin Edwards
  10. Kristine Fallstone
  11. John Daniels

See also

Related Research Articles

<span class="mw-page-title-main">2008 Democratic Party presidential primaries</span> Selection of the Democratic Party nominee

From January 3 to June 3, 2008, voters of the Democratic Party chose their nominee for president in the 2008 United States presidential election. Senator Barack Obama of Illinois was selected as the nominee, becoming the first African American to secure the presidential nomination of any major political party in the United States. However, due to a close race between Obama and Senator Hillary Clinton of New York, the contest remained competitive for longer than expected; neither candidate received enough pledged delegates from state primaries and caucuses to achieve a majority, without endorsements from unpledged delegates (superdelegates).

<span class="mw-page-title-main">2008 Iowa Democratic presidential caucuses</span> Democratic caucus in the 2008 election

The 2008 Iowa Democratic presidential caucus occurred on January 3, and was the state caucuses of the Iowa Democratic Party. It was the first election for the Democrats of the 2008 presidential election. Also referred to as "the First in the Nation Caucus," it was the first election of the primary season on both the Democratic and Republican sides. Of the eight major Democratic presidential candidates, then-U.S. Senator Barack Obama of Illinois received the most votes and was ultimately declared the winner of the Iowa Democratic Caucus of 2008, making him the first African American to win the caucus and the first African American to win a primary state since Jesse Jackson in 1988. Former U.S. Senator John Edwards of North Carolina came in second place and then-U.S. Senator Hillary Clinton of New York finished third, though Clinton received more delegates than Edwards. Campaigning had begun as early as two years before the event.

<span class="mw-page-title-main">2008 United States presidential election in Iowa</span>

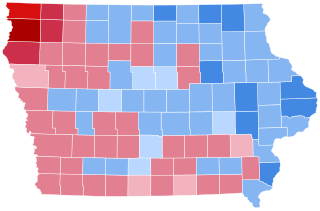
The 2008 United States presidential election in Iowa took place on November 4, 2008, as part of the 2008 United States presidential election. Voters chose seven representatives, or electors to the Electoral College, who voted for president and vice president.

<span class="mw-page-title-main">2008 United States presidential election in California</span>

The 2008 United States presidential election in California took place on November 4, 2008, in California as part of the 2008 United States presidential election. Voters chose 55 electors, the most out of any of the 50 states, to the Electoral College, who voted for president and vice president.

<span class="mw-page-title-main">2008 Kansas Democratic presidential caucuses</span>

The 2008 Kansas Democratic presidential caucuses took held on Super Tuesday, February 5, 2008, with 21 delegates at stake. The remaining 11 delegates were selected at the Kansas Democratic Party District Conventions on April 12. The state, and a majority of its delegates, were won by Barack Obama.

<span class="mw-page-title-main">2008 North Dakota Democratic presidential caucuses</span>

The 2008 North Dakota Democratic presidential caucuses took place on February 5, 2008, one of the many Super Tuesday nominating contests held that day. Barack Obama won the caucuses, securing 8 out of 13 national delegates.

<span class="mw-page-title-main">2008 Washington Democratic presidential caucuses</span>

The 2008 Washington Democratic presidential caucuses were a series of events held by the Washington State Democratic Party to determine the delegates that the Party sent to the 2008 Democratic National Convention. Delegates were selected in a four-tier process that began with precinct caucuses, was further refined in legislative district caucuses and/or county conventions, concluded for some delegates in the congressional district caucuses, and finally concluded for the remaining delegates at the state convention.

<span class="mw-page-title-main">2008 Texas Democratic presidential primary and caucuses</span>

The 2008 Texas Democratic presidential primary and caucuses were a series of events to determine the delegates that the Texas Democratic Party sent to the 2008 Democratic National Convention. Delegates were selected using results from two sources: the Texas Presidential Primary held on March 4 by the Secretary of State of Texas's office, and a series of caucus events held between March 4 and June 7 by the Texas Democratic Party. The indecisive results of Super Tuesday, and the fact that Texas had the largest number of delegates among the states remaining on the Democratic primary calendar, resulted in the Texas primary receiving significant attention from both the Hillary Clinton and Barack Obama campaigns.

<span class="mw-page-title-main">2008 United States presidential election in Illinois</span>

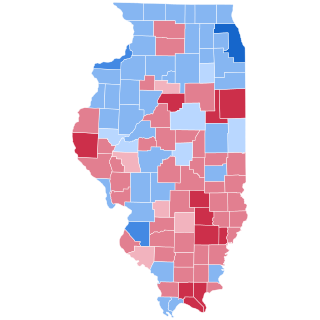
The 2008 United States presidential election in Illinois took place on November 4, 2008, and was part of the 2008 United States presidential election. Voters chose 21 representatives, or electors to the Electoral College, who voted for president and vice president.

<span class="mw-page-title-main">2012 United States presidential election in Iowa</span>

The 2012 United States presidential election in Iowa took place on November 6, 2012, as part of the 2012 United States presidential election in which all 50 states plus the District of Columbia participated. Iowa voters chose six electors to represent them in the Electoral College via a popular vote pitting incumbent Democratic President Barack Obama and his running mate, Vice President Joe Biden, against Republican challenger and former Massachusetts Governor Mitt Romney and his running mate, Congressman Paul Ryan.

<span class="mw-page-title-main">2012 United States presidential election in Colorado</span> Election in Colorado

The 2012 United States presidential election in Colorado took place on November 6, 2012, as part of the 2012 United States presidential election in which all 50 states plus the District of Columbia participated. Colorado voters chose nine electors to represent them in the Electoral College via a popular vote pitting incumbent Democratic President Barack Obama and his running mate, Vice President Joe Biden, against Republican challenger and former Massachusetts Governor Mitt Romney and his running mate, Congressman Paul Ryan. Obama and Biden carried Colorado with 51.45% of the popular vote to Romney's and Ryan's 46.09%, thus winning the state's nine electoral votes by a 5.36% margin.

<span class="mw-page-title-main">2012 United States presidential election in Minnesota</span>

The 2012 United States presidential election in Minnesota took place on November 6, 2012, as part of the 2012 United States presidential election in which all 50 states plus the District of Columbia participated. State voters chose ten electors to represent them in the Electoral College via a popular vote pitting incumbent Democratic President Barack Obama and his running mate, Vice President Joe Biden, against Republican challenger and former Massachusetts Governor Mitt Romney and his running mate, Congressman Paul Ryan.

<span class="mw-page-title-main">2012 United States presidential election in Washington (state)</span> Election in Washington

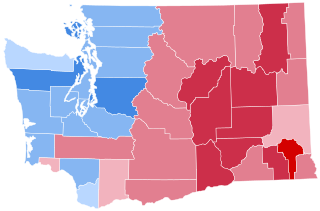
The 2012 United States presidential election in Washington took place on November 6, 2012, as part of the 2012 United States presidential election in which all 50 states plus the District of Columbia participated. Washington voters chose 12 electors to represent them in the Electoral College via a popular vote pitting incumbent Democratic President Barack Obama and his running mate, Vice President Joe Biden, against Republican challenger and former Massachusetts Governor Mitt Romney and his running mate, Congressman Paul Ryan.

<span class="mw-page-title-main">2012 United States presidential election in Arkansas</span>

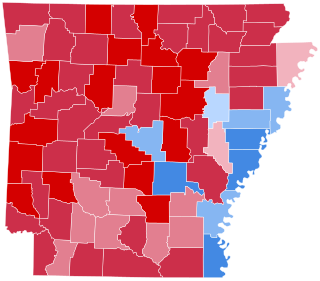
The 2012 United States presidential election in Arkansas took place on November 6, 2012, as part of the 2012 General Election in which all 50 states plus the District of Columbia participated. Arkansas voters chose six electors to represent them in the Electoral College via a popular vote pitting incumbent Democratic President Barack Obama and his running mate, Vice President Joe Biden, against Republican challenger and former Massachusetts Governor Mitt Romney and his running mate, Congressman Paul Ryan.

<span class="mw-page-title-main">2012 United States presidential election in Kansas</span> Election in Kansas

The 2012 United States presidential election in Kansas took place on November 6, 2012, as part of the 2012 United States presidential election in which all 50 states plus the District of Columbia participated. Kansas voters chose six electors to represent them in the Electoral College via a popular vote pitting incumbent Democratic President Barack Obama and his running mate, Vice President Joe Biden, against Republican challenger and former Massachusetts Governor Mitt Romney and his running mate, Congressman Paul Ryan. Romney and Ryan carried the state with 59.59 percent of the popular vote to Obama's and Biden's 38.00 percent, thus winning the state's six electoral votes.

<span class="mw-page-title-main">2012 United States presidential election in Nebraska</span> Election in nebraska

The 2012 United States presidential election in Nebraska took place on November 6, 2012, as part of the 2012 United States presidential election in which all 50 states plus the District of Columbia participated. Voters chose five electors to represent them in the Electoral College via a popular vote pitting incumbent Democratic President Barack Obama and his running mate, Vice President Joe Biden, against Republican challenger and former Massachusetts Governor Mitt Romney and his running mate, Congressman Paul Ryan.

<span class="mw-page-title-main">2008 United States presidential election in New Hampshire</span> Election in New Hampshire

The 2008 United States presidential election in New Hampshire took place on November 4, 2008, as part of the 2008 United States presidential election throughout all 50 states and D.C. Voters chose four representatives, or electors to the Electoral College, who voted for president and vice president.

<span class="mw-page-title-main">2012 United States presidential election in Alabama</span> Election in Alabama

The 2012 United States presidential election in Alabama took place on November 6, 2012, as part of the 2012 general election, in which all 50 states plus the District of Columbia participated. Alabama voters chose nine electors to represent them in the Electoral College via a popular vote pitting incumbent Democratic President Barack Obama and his running mate, Vice President Joe Biden, against Republican challenger and former Massachusetts Governor Mitt Romney and his running mate, Congressman Paul Ryan.

<span class="mw-page-title-main">2012 United States presidential election in Alaska</span> Election in Alaska

The 2012 United States presidential election in Alaska took place on November 6, 2012, as part of the 2012 United States presidential election in which all 50 states plus the District of Columbia participated. Alaska voters chose three electors to represent them in the Electoral College via a popular vote pitting incumbent Democratic President Barack Obama and his running mate, Vice President Joe Biden, against Republican challenger and former Massachusetts Governor Mitt Romney and his running mate, Congressman Paul Ryan.

<span class="mw-page-title-main">2016 United States presidential election in Texas</span> Election in Texas

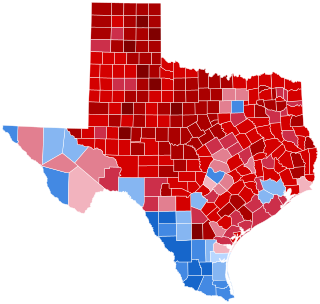
The 2016 United States presidential election in Texas took place on November 8, 2016, as part of the 2016 United States presidential election. Primary elections were held on March 1, 2016.

References

  1. Secretary of State: Kim Wyman. "Voter Turnout by Election". www.sos.wa.gov. Retrieved May 25, 2020.
  2. 1 2 Yardley, William (February 18, 2008). "In Washington State Vote, Relevance Is an Issue". The New York Times.
  3. 1 2 3 "Washington State Delegate Selection Plan For The 2008 Democratic National Convention". Washington State Democratic Party. August 23, 2007. Archived from the original (PDF) on April 23, 2008. Retrieved April 29, 2008.
  4. 1 2 3 4 Berg-Andersson, Richard (March 1, 2008). "Washington Democrat Presidential Nominating Process". The Green Papers. Retrieved March 5, 2008.
  5. "Murray endorses Clinton". Seattle Times Company. January 31, 2008. Retrieved February 8, 2008.
  6. McGann, Chris (February 8, 2008). "Gregoire endorses Obama". Seattle PI. Retrieved February 8, 2008.
  7. 1 2 "Washington State Democratic Party". Washington State Democratic Party.
  8. "The 2008 Washington State Democratic Caucus-Convention Cycle" (PDF). 46th District Democrats. December 2, 2007. Archived from the original (PDF) on August 27, 2008. Retrieved April 25, 2008.
  9. 1 2 Ravens, Jaxon. "Delegates and Alternates Allocated to each County and Legislative District for the Congressional District Caucuses and the State Convention" (PDF). 34th District Democrats. Archived from the original (PDF) on September 9, 2008. Retrieved April 25, 2008.
  10. "Washington State Democrats - Legislative District Caucuses". Washington State Democratic Party. Archived from the original on April 23, 2008. Retrieved April 25, 2008.
  11. "Washington State Democrats - County Conventions". Washington State Democratic Party. Retrieved April 25, 2008.
  12. "Caucus Results by Jurisdiction". Washington State Democratic Party. February 12, 2008. Archived from the original on February 27, 2008. Retrieved February 12, 2008.
  13. "President - Democratic Party Federal (Statewide)". Washington Secretary of State. March 7, 2008. Archived from the original on May 7, 2008. Retrieved March 8, 2008.
  14. DeGolier, Cheryl (April 6, 2008). "LD Caucus Results and Observations". Snohomish County Democrats. Retrieved April 27, 2008.
  15. "Yelm Starts Democrat Caucuses". The Olympian Online. Archived from the original on September 13, 2014. Retrieved April 26, 2008.
  16. "2008 Legislative District Caucuses". 5th District Democrats. Archived from the original on April 10, 2008. Retrieved April 26, 2008.
  17. Brewer, Andrew. "Final Credentials Report April 5th 6th LD Caucus". 6th Legislative District Democrats. Retrieved April 28, 2008.[ dead link ]
  18. Brede, Alene. "April 5th 11th LD Preliminary Caucus Results". 11th Legislative District Democrats. Retrieved April 28, 2008.
  19. "Caucus Results". Thurston County Democrats. Archived from the original on May 10, 2008. Retrieved May 10, 2008.
  20. "Caucus Results". Thurston County Democrats. Archived from the original on May 10, 2008. Retrieved April 27, 2008.
  21. "LD Caucus Results were". YouTube . Archived from the original on December 21, 2021. Retrieved May 10, 2008.
  22. The 24th LD met at 3 different places: the Clallam, Grays Harbor, and Jefferson County Conventions. Clallam County portion "2008 Elected Delegates". Clallam Democrats. Archived from the original on May 9, 2008. Retrieved May 15, 2008. Jefferson County Portion "Results of the Jefferson County Convention, April 26, 2008". Jefferson County Democrats. Retrieved May 15, 2008. Grays Harbor portion (still waiting)
  23. Stokes, Charley. "HUNDREDS OF ENTHUSIASTIC DEMOCRATS FILL PHS AUDITORIUM" (PDF). 25th Legislative District Democrats. Retrieved May 10, 2008.
  24. "26th Legislative District Democrats". www.26dems.org. Archived from the original on May 9, 2008. Retrieved December 7, 2018.
  25. "27th LD CD Caucus and WS Convention Del and Alt 2008" (PDF). 27th Legislative District Democrats. Archived from the original (PDF) on September 9, 2008. Retrieved May 15, 2008.
  26. "LD Caucus Delegates". www.31stdistrictdemocrats.org. Archived from the original on September 2, 2011. Retrieved December 7, 2018.
  27. "Snohomish County Democrats". Archived from the original on July 5, 2013. Retrieved October 10, 2012.
  28. http://www.33rddems.org/caucus2008.php%5B%5D
  29. "34th Dems 2008 LD Caucus Results". www.34dems.org. Archived from the original on April 9, 2008. Retrieved December 7, 2018.
  30. The 35th LD met at 4 different places: the Mason, Thurston, Grays Harbor, and Kitsap County Conventions. Mason County portion "Results". Mason County Democratic Central Committee. Retrieved April 28, 2008. Thurston County portion: "Caucus Results". Thurston County Democrats. Retrieved April 28, 2008.
  31. 1 2 "Welcome to the 37th District Democrats". 37th District Democrats. Retrieved December 7, 2018.
  32. "Working On A Better Life". www.snohomishdemocrats.org. Retrieved December 7, 2018.
  33. "Home". wa-democrats-39ld.org. September 1, 2011. Archived from the original on September 1, 2011. Retrieved December 7, 2018.
  34. The 40th LD met at 3 different places: the Whatcom County Convention, the Skagit County Convention, and San Juan county's 40th LD caucus. Skagit County portion: "Delegates by the Numbers". Skagit Valley Herald. April 13, 2008. pp. A–6. Whatcom County portion: McClendon, Natalie (April 12, 2008). "Local Democrats Elect Delegates to Congressional District Caucus". Whatcom County Democrats. Retrieved April 28, 2008. San Juan portion: "San Juan 2008 Results of the 40th Legislative District Caucus". Democrats of San Juan County Washington. Retrieved April 28, 2008.
  35. "41st Legislative District Caucus Results". 41st District Democrats. April 11, 2008. Retrieved April 28, 2008.
  36. McClendon, Natalie (April 12, 2008). "Local Democrats Elect Delegates to Congressional District Caucus". Whatcom County Democrats. Retrieved April 28, 2008.
  37. "Caucus Results". 43rd District Democrats of Washington. Archived from the original on August 23, 2006. Retrieved April 28, 2008.
  38. DeWitt, Rick. "Legislative District Caucus". 44th Legislative District Democrats of Washington State. Archived from the original on August 19, 2008. Retrieved April 28, 2008.
  39. "45th LD Democrats - Caucus Information". 45th District Democrats. Archived from the original on March 8, 2008. Retrieved April 28, 2008.
  40. "WA46Dems - LD Caucus Results". 46th District Democrats. Archived from the original on June 29, 2008. Retrieved April 25, 2008.
  41. "LD Caucus Results". 47th District Democrats. Archived from the original on June 26, 2006. Retrieved May 15, 2008.
  42. "LD Caucus Results". 48th District Democrats. Archived from the original on August 6, 2010. Retrieved April 26, 2008.
  43. "WA National Delegate List". Obama Campaign. Archived from the original on June 9, 2008. Retrieved May 20, 2008.
  44. Derived by deducting reported Obama numbers from total delegates for each CD.
  45. DeGolier, Cheryl (May 19, 2008). "1st Congressional District Caucus Results". 1st District Democrats. Retrieved May 20, 2008.[ permanent dead link ]
  46. "CD Caucus Results". 46th District Democrats. Archived from the original on August 27, 2008. Retrieved May 20, 2008.
  47. 1 2 3 "RESULTS: Washington". CNN. February 9, 2008. Retrieved February 9, 2008.
  48. "Mike Huckabee wants retraction, caucus recount". The Seattle Times . February 11, 2008.
  49. "Washington Caucus Updates Show McCain is Still GOP Winner, Despite Huckabee Challenge". FoxNews.com. February 12, 2008. Retrieved January 10, 2009.[ dead link ]
  50. Nate Silver (March 2, 2012). "In Washington Caucus, Expect the Unexpected". FiveThirtyEight . Retrieved March 3, 2012.
  51. "President - Republican Party". Washington Secretary of State. March 7, 2008. Archived from the original on May 21, 2008. Retrieved May 24, 2008.
  52. "CNN Map: Campaign money race".
  53. "D.C.'s Political Report: The complete source for campaign summaries". January 1, 2009. Archived from the original on January 1, 2009. Retrieved August 23, 2021.
  54. "Presidential". May 5, 2015. Archived from the original on May 5, 2015. Retrieved August 23, 2021.
  55. "Vote 2008 - The Takeaway - Track the Electoral College vote predictions". April 22, 2009. Archived from the original on April 22, 2009. Retrieved August 23, 2021.
  56. "Electoral-vote.com: President, Senate, House Updated Daily". electoral-vote.com. Retrieved August 23, 2021.
  57. 1 2 3 4 Based on Takeaway
  58. "POLITICO's 2008 Swing State Map - POLITICO.com". www.politico.com. Retrieved September 22, 2016.
  59. "Result". www.realclearpolitics.com. 2008. Retrieved November 18, 2021.
  60. "CQ Presidential Election Maps, 2008". CQ Politics. Archived from the original on June 14, 2009. Retrieved December 20, 2009.
  61. Nagourney, Adam; Zeleny, Jeff; Carter, Shan (November 4, 2008). "The Electoral Map: Key States". The New York Times. Retrieved May 26, 2010.
  62. "October 2008 CNN Political Ticker - CNN.com Blogs". CNN. October 31, 2008. Archived from the original on June 19, 2010. Retrieved May 26, 2010.
  63. "Winning The Electoral College". Fox News. April 27, 2010.
  64. "roadto270". hosted.ap.org. Retrieved September 22, 2016.
  65. "Election 2008: Electoral College Update - Rasmussen Reports". www.rasmussenreports.com. Retrieved September 22, 2016.
  66. "Presidential Campaign Finance". Archived from the original on March 24, 2009. Retrieved August 18, 2009.
  67. "Map: Campaign Ad Spending - Election Center 2008 from CNN.com". CNN. Retrieved May 26, 2010.
  68. "Map: Campaign Candidate Visits - Election Center 2008 from CNN.com". CNN. Retrieved May 26, 2010.
  69. "Electoral College". California Secretary of State. Archived from the original on October 30, 2008. Retrieved November 1, 2008.
  70. "Electoral College Democratic Pres Electors" (PDF). www.secstate.wa.gov. Archived from the original (PDF) on January 23, 2016. Retrieved November 18, 2021.
  71. Gregory Roberts (August 4, 2008). "Lynnwood man may become one of first Muslim presidential electors in U.S". Seattlepi.com. Retrieved November 18, 2021.
  72. "Marcus M. Riccelli - Congressional Staffer Salary Data". www.legistorm.com.
  73. Regimbal, Alec. "Washington's Muslim electors could help make history". Blog.seattlepi.nwsource.com. Retrieved November 18, 2021.
  74. Roberts, Gregory; Modie, Neil (October 20, 2005). "Irons family feud airs on the Web". Seattle Post-Intelligencer.