2008 United States presidential election in Maryland

Last updated

2008 United States presidential election in Maryland
Flag of Maryland.svg
  2004 November 4, 2008 2012  
  Obama portrait crop.jpg John McCain 2009 Official.jpg
Nominee Barack Obama John McCain
Party Democratic Republican
Home state Illinois Arizona
Running mate Joe Biden Sarah Palin
Electoral vote100
Popular vote1,629,467959,862
Percentage61.92%36.47%

Maryland Presidential Election Results 2008.svg
County Results

President before election

George W. Bush
Republican

Elected President

Barack Obama
Democratic

The 2008 United States presidential election in Maryland took place on November 4, 2008, and was part of the 2008 United States presidential election. Voters chose 10 representatives, or electors to the Electoral College, who voted for president and vice president.

Contents

Maryland was won by Democratic nominee Barack Obama by a 25.4% margin of victory. Prior to the election, all 17 news organizations considered this a state Obama would win, or otherwise considered as a safe blue state. The Old Line State has voted for the Democratic presidential candidate of every election since 1992. In 2008, Obama easily captured the state's 10 electoral votes in a landslide victory, winning 61.92% of the popular vote to Republican John McCain's 36.47%.

Primaries

Campaign

Predictions

There were 16 news organizations who made state-by-state predictions of the election. Here are their last predictions before election day:

SourceRanking
D.C. Political Report [1] Likely D
Cook Political Report [2] Solid D
The Takeaway [3] Solid D
Electoral-vote.com [4] Solid D
Washington Post [5] Solid D
Politico [6] Solid D
RealClearPolitics [7] Solid D
FiveThirtyEight [5] Solid D
CQ Politics [8] Solid D
The New York Times [9] Solid D
CNN [10] Safe D
NPR [5] Solid D
MSNBC [5] Solid D
Fox News [11] Likely D
Associated Press [12] Likely D
Rasmussen Reports [13] Safe D

Polling

Obama won every single pre-election poll, each by a double-digit margin of victory and at least 51% of the vote. The final 3 polls averaged Obama leading 54% to 38%. [14]

Fundraising

John McCain raised a total of $3,439,120 in the state. Barack Obama raised $19,091,136. [15]

Advertising and visits

Obama spent $257,582 while McCain spent nothing. [16] Both tickets visited the state once. [17]

Analysis

Voting taking place at a Maryland polling station Voting at Election 2008 (3004181834) (cropped).jpg
Voting taking place at a Maryland polling station

Maryland has supported the Democratic nominee in each of the last five presidential elections by an average margin of 15.4%. In 1980, it was 1 of only 6 states to vote for Democrat Jimmy Carter over Republican Ronald Reagan. It has only supported a Republican six times since Franklin D. Roosevelt1948 and the Republican landslides of 1952, 1956, 1972, 1984 and 1988.

Maryland is often among the Democratic nominees' best states. In 1992, Bill Clinton fared better in Maryland than any other state except his home state of Arkansas. In 1996, Maryland was Clinton's sixth best, in 2000 Maryland ranked fourth for Al Gore and in 2004 John Kerry showed his fifth best performance in Maryland.

Republican presidential candidates typically win more counties by running up huge margins in western Maryland and the Eastern Shore. However, they are usually swamped by the heavily Democratic Baltimore-Washington, D.C. axis, which casts almost 75% of the state's vote. The state's four largest county-level jurisdictions – Montgomery, Prince George's and Baltimore counties and the City of Baltimore — are strongly Democratic. These areas, which contain 1.5 million voters combined, make it extremely difficult for a Republican to win Maryland. Even in bad years for Democrats, a Republican usually has to run the table in the rest of the state and win either Montgomery, Prince George's or Baltimore counties to have a realistic chance of carrying the state. In 1984, for instance, Ronald Reagan only carried Maryland by crushing Walter Mondale in Baltimore County and narrowly winning Montgomery. In 1988, George H. W. Bush ran up a 42,300-vote margin in Baltimore County over Michael Dukakis – almost 85% of his statewide margin of 49,800 votes.

The 2008 election was no exception. Barack Obama won the state's 10 electoral votes in 2008 with 61.92% of the vote to John McCain's 36.47%. Obama carried Montgomery, Prince George's, Baltimore County and Baltimore City with 71.6%, 88.9%, 56.2 and 87.2% of the vote, respectively. Obama's combined 550,000-vote margin in these four areas would have been enough to carry the state. While McCain won more counties, the only large county he won was Anne Arundel County, home to the state capital, Annapolis. In this election, Maryland voted 18.17% to the left of the nation at-large. [18]

In 2008, Democrats picked up a U.S. House an open seat in Maryland's 1st Congressional District as Democrat Frank M. Kratovil, Jr. defeated Republican Andy Harris by less than a 1% margin of victory.

Results

2008 United States presidential election in Maryland [19]
PartyCandidateRunning mateVotesPercentageElectoral votes
Democratic Barack Obama Joe Biden 1,629,46761.92%10
Republican John McCain Sarah Palin 959,86236.47%0
Independent Ralph Nader Matt Gonzalez 14,7130.56%0
Libertarian Bob Barr Wayne Allyn Root 9,8420.44%0
Independent Write-in candidates 9,0430.34%0
Green Cynthia McKinney Rosa Clemente 4,7470.18%0
Constitution Chuck Baldwin Darrell Castle3,7600.14%0
America's Independent Alan Keyes (write-in)Brian Rohrbough1030.00%0
UnaffiliatedDonald Kenneth Allen (write-in)Christopher Borcik170.56%0
Democratic Blaine Taylor (write-in)n/a120.00%0
Socialist USA Brian Moore (write-in) Stewart Alexander 100.00%0
Totals2,631,596100.00%10
Voter turnout (Voting age population)62.4%

Results by county

CountyBarack Obama
Democratic
John McCain
Republican
Various candidates
Other parties
MarginTotal votes cast [20]
# %# %# %# %
Allegany 10,69335.95%18,40561.88%6442.17%-7,712-25.93%29,742
Anne Arundel 125,01548.15%129,68249.95%4,9221.90%-4,667-1.80%259,619
Baltimore 214,15156.22%158,71441.66%8,0732.12%55,43714.55%380,938
Baltimore City 214,38587.16%28,68111.66%2,9021.18%185,70475.50%245,968
Calvert 20,29946.07%23,09552.42%6631.50%-2,796-6.35%44,057
Caroline 4,97137.61%8,01560.64%2321.76%-3,044-23.03%13,218
Carroll 28,06033.11%54,50364.30%2,1972.59%-26,443-31.20%84,760
Cecil 17,66541.57%23,85556.14%9742.29%-6,190-14.57%42,494
Charles 43,63562.22%25,73236.69%7601.08%17,90325.53%70,127
Dorchester 6,91245.25%8,16853.48%1941.27%-1,256-8.22%15,274
Frederick 54,01348.58%55,17049.62%2,0031.80%-1,157-1.04%111,186
Garrett 3,73629.02%8,90369.17%2331.81%-5,167-40.14%12,872
Harford 48,55239.38%71,75158.19%2,9922.43%-23,199-18.82%123,295
Howard 87,12059.99%55,39338.14%2,7201.87%31,72721.85%145,233
Kent 4,95349.43%4,90548.95%1621.62%480.48%10,020
Montgomery 314,44471.58%118,60827.00%6,2091.41%195,83644.58%439,261
Prince George's 332,39688.87%38,83310.38%2,7970.75%293,56378.49%374,026
Queen Anne's 8,57535.66%15,08762.74%3831.59%-6,512-27.08%24,045
Somerset 4,77948.16%5,03750.76%1081.09%-258-2.60%9,924
St. Mary's 19,02342.84%24,70555.63%6811.53%-5,682-12.79%44,409
Talbot 9,03544.45%10,99554.09%2981.47%-1,960-9.64%20,328
Washington 26,24542.61%34,16955.47%1,1861.93%-7,924-12.86%61,600
Wicomico 19,43646.44%21,84952.20%5691.36%-2,413-5.77%41,854
Worcester 11,37441.59%15,60757.07%3651.33%-4,233-15.48%27,346
Totals1,629,46761.92%959,86236.47%42,2671.61%669,60525.44%2,631,596
County Flips:
Democratic
Hold
Gain from Republican
Republican
Hold Maryland County Flips 2008.svg
County Flips:

Counties that flipped from Republican to Democratic

By congressional district

Barack Obama carried 6 of Maryland’s 8 congressional districts. McCain carried two congressional districts, including one that was won by a Democrat.

DistrictObamaMcCainRepresentative
1st 39.81%58.26% Wayne Gilchrest (110th Congress)
Frank M. Kratovil, Jr. (111th Congress)
2nd 59.84%38.25% Dutch Ruppersberger
3rd 58.78%39.23% John Sarbanes
4th 85.06%14.16% Albert Wynn (110th Congress)
Donna Edwards (111th Congress)
5th 65.44%33.30% Steny Hoyer
6th 40.19%57.65% Roscoe Bartlett
7th 78.79%19.89% Elijah Cummings
8th 73.88%24.70% Chris Van Hollen

Electors

Technically the voters of Maryland cast their ballots for electors: representatives to the Electoral College. Maryland is allocated 10 electors because it has 8 congressional districts and 2 senators. All candidates who appear on the ballot or qualify to receive write-in votes must submit a list of 10 electors, who pledge to vote for their candidate and his or her running mate. Whoever wins the majority of votes in the state is awarded all 10 electoral votes. Their chosen electors then vote for president and vice president. Although electors are pledged to their candidate and running mate, they are not obligated to vote for them. [21] An elector who votes for someone other than his or her candidate is known as a faithless elector.

The electors of each state and the District of Columbia met on December 15, 2008, to cast their votes for president and vice president. The Electoral College itself never meets as one body. Instead the electors from each state and the District of Columbia met in their respective capitols.

The following were the members of the Electoral College from the state. All 10 were pledged to Barack Obama and Joe Biden: [22]

  1. Gene M. Ransom III
  2. Delores Kelley
  3. Guy Guzzone
  4. Nathaniel Exum
  5. Chris Reynolds
  6. Bobby Fouche
  7. Elizabeth Bobo
  8. Michael Barnes
  9. Susan Lee
  10. Rainier Harvey, Sr.

See also

Related Research Articles

<span class="mw-page-title-main">2008 United States presidential election in New York</span>

The 2008 United States presidential election in New York took place on November 4, 2008, and was part of the 2008 United States presidential election. Voters chose 31 representatives, or electors to the Electoral College, who voted for president and vice president.

<span class="mw-page-title-main">2008 United States presidential election in Indiana</span> Election in Indiana

The 2008 United States presidential election in Indiana took place on November 4, 2008, and was part of the 2008 United States presidential election. Voters chose 11 representatives, or electors to the Electoral College, who voted for president and vice president.

<span class="mw-page-title-main">2008 United States presidential election in Colorado</span> Election in Colorado

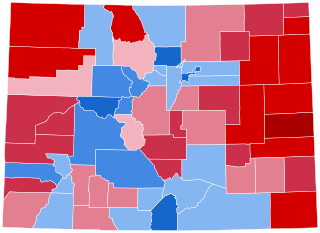
The 2008 United States presidential election in Colorado took place on November 4, 2008, as a part of the 2008 United States presidential election throughout all 50 states and the District of Columbia. Voters chose nine representatives, or electors to the Electoral College, who voted for president and vice president.

<span class="mw-page-title-main">2008 United States presidential election in Utah</span> Election in Utah

The 2008 United States presidential election in Utah took place on November 4, 2008. It was part of the 2008 United States presidential election. Voters chose five representatives, or electors to the Electoral College, who voted for president and vice president.

<span class="mw-page-title-main">2008 United States presidential election in New Jersey</span> Election in New Jersey

The 2008 United States presidential election in New Jersey took place on November 4, 2008, and was part of the 2008 United States presidential election. Voters chose 15 representatives, or electors to the Electoral College, who voted for president and vice president.

<span class="mw-page-title-main">2008 United States presidential election in Wyoming</span> Election in Wyoming

The 2008 United States presidential election in Wyoming took place on November 4, 2008, and was part of the 2008 United States presidential election. Voters chose three representatives, or electors to the Electoral College, who voted for president and vice president.

<span class="mw-page-title-main">2008 United States presidential election in Nebraska</span> Election in Nebraska

The 2008 United States presidential election in Nebraska took place on November 4, 2008, as part of the 2008 United States presidential election. Voters chose five electors to the Electoral College, who voted for president and vice president. However, Nebraska is one of the two states of the U.S. that, instead of giving all of its electors to the winner based on its statewide results, allocates just two electoral votes to the winner of the statewide popular vote. The other three electors vote based on their individual congressional district results.

<span class="mw-page-title-main">2008 United States presidential election in Montana</span> Election in Montana

The 2008 United States presidential election in Montana took place on November 4, 2008, and was part of the 2008 United States presidential election. Voters chose three representatives, or electors to the Electoral College, who voted for president and vice president.

<span class="mw-page-title-main">2008 United States presidential election in Nevada</span> Election in Nevada

The 2008 United States presidential election in Nevada was part of the 2008 United States presidential election, which took place on November 4, 2008, throughout all 50 states and D.C. Voters chose five representatives, or electors to the Electoral College, who voted for president and vice president.

<span class="mw-page-title-main">2008 United States presidential election in Ohio</span> Election in Ohio

The 2008 United States presidential election in Ohio took place on November 4, 2008, which was part of the 2008 United States presidential election. Voters chose 20 representatives, or electors to the Electoral College, who voted for president and vice president.

<span class="mw-page-title-main">2008 United States presidential election in Connecticut</span> Election in Connecticut

The 2008 United States presidential election in Connecticut took place on November 4, 2008, and was part of the 2008 United States presidential election. Voters chose seven representatives, or electors to the Electoral College, who voted for president and vice president.

<span class="mw-page-title-main">2008 United States presidential election in Illinois</span> Election in Illinois

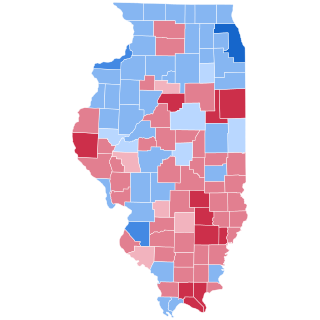
The 2008 United States presidential election in Illinois took place on November 4, 2008, and was part of the 2008 United States presidential election. Voters chose 21 representatives, or electors to the Electoral College, who voted for president and vice president.

<span class="mw-page-title-main">2008 United States presidential election in Virginia</span> Election in Virginia

The 2008 United States presidential election in Virginia took place on November 4, 2008, which was part of the 2008 United States presidential election. Voters chose 13 representatives, or electors to the Electoral College, who voted for president and vice president.

<span class="mw-page-title-main">2008 United States presidential election in Alabama</span> Election in Alabama

The 2008 United States presidential election in Alabama took place on November 4, 2008, and was part of the 2008 United States presidential election. Voters chose nine representatives, or electors, to the Electoral College, who voted for president and vice president.

<span class="mw-page-title-main">2008 United States presidential election in Idaho</span> Election in Idaho

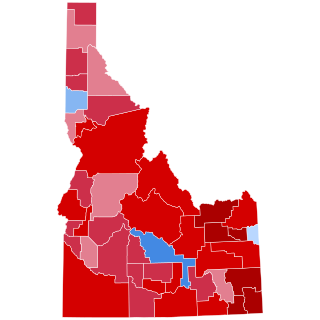
The 2008 United States presidential election in Idaho took place on November 4, 2008, and was part of the 2008 United States presidential election. Voters chose four representatives, or electors to the Electoral College, who voted for president and vice president.

<span class="mw-page-title-main">2008 United States presidential election in West Virginia</span> Election in West Virginia

The 2008 United States presidential election in West Virginia took place on November 4, 2008, and was part of the 2008 United States presidential election. Voters chose 5 representatives, or electors to the Electoral College, who voted for president and vice president.

<span class="mw-page-title-main">2008 United States presidential election in Minnesota</span>

The 2008 United States presidential election in Minnesota took place on November 4, 2008, and was part of the 2008 United States presidential election. Voters chose ten representatives, or electors to the Electoral College, who voted for president and vice president.

<span class="mw-page-title-main">2008 United States presidential election in Georgia</span> Election in Georgia

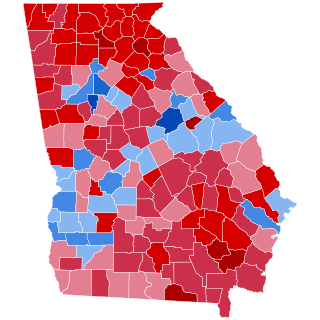
The 2008 United States presidential election in Georgia took place on November 4, 2008. Voters chose 15 representatives, or electors to the Electoral College, who voted for president and vice president.

<span class="mw-page-title-main">2008 United States presidential election in Kansas</span> Election in Kansas

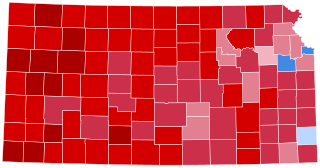
The 2008 United States presidential election in Kansas took place on November 4, 2008, and was part of the 2008 United States presidential election. Voters chose six representatives, or electors to the Electoral College, who voted for president and vice president.

<span class="mw-page-title-main">2008 United States presidential election in Michigan</span> Election in Michigan

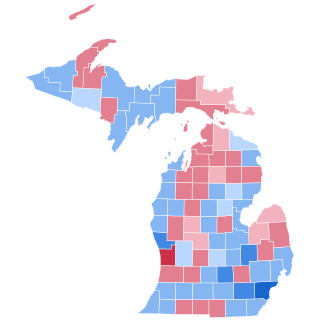
The 2008 United States presidential election in Michigan took place on November 4, 2008. It was part of the 2008 United States presidential election which happened throughout all 50 states and D.C. Voters chose 17 representatives, or electors to the Electoral College, who voted for president and vice president.

References

  1. "D.C.'s Political Report: The complete source for campaign summaries". January 1, 2009. Archived from the original on January 1, 2009. Retrieved August 23, 2021.
  2. "Presidential". May 5, 2015. Archived from the original on May 5, 2015. Retrieved August 23, 2021.
  3. "Vote 2008 - The Takeaway - Track the Electoral College vote predictions". April 22, 2009. Archived from the original on April 22, 2009. Retrieved August 23, 2021.
  4. "Electoral-vote.com: President, Senate, House Updated Daily". electoral-vote.com. Retrieved August 23, 2021.
  5. 1 2 3 4 Based on Takeaway
  6. "POLITICO's 2008 Swing State Map - POLITICO.com". www.politico.com. Retrieved September 22, 2016.
  7. "RealClearPolitics - Electoral Map". Archived from the original on June 5, 2008.
  8. "CQ Presidential Election Maps, 2008". CQ Politics. Archived from the original on June 14, 2009. Retrieved December 20, 2009.
  9. Nagourney, Adam; Zeleny, Jeff; Carter, Shan (November 4, 2008). "The Electoral Map: Key States". The New York Times. Retrieved May 26, 2010.
  10. "October 2008 CNN Political Ticker - CNN.com Blogs". CNN. October 31, 2008. Archived from the original on June 19, 2010. Retrieved May 26, 2010.
  11. "Winning The Electoral College". Fox News. April 27, 2010.
  12. "roadto270". hosted.ap.org. Retrieved September 22, 2016.
  13. "Election 2008: Electoral College Update - Rasmussen Reports™". www.rasmussenreports.com. Retrieved September 22, 2016.
  14. Election 2008 Polls - Dave Leip's Atlas of U.S. Presidential Elections
  15. "Presidential Campaign Finance". Archived from the original on March 24, 2009. Retrieved August 20, 2009.
  16. "Map: Campaign Ad Spending - Election Center 2008 from CNN.com". CNN. Retrieved May 26, 2010.
  17. "Map: Campaign Candidate Visits - Election Center 2008 from CNN.com". CNN. Retrieved May 26, 2010.
  18. "Dave Leip's Atlas of U.S. Presidential Elections". uselectionatlas.org. Retrieved March 31, 2023.
  19. "Maryland State Board of Elections" . Retrieved December 12, 2008.
  20. Maryland State Board of Elections; 2008 Presidential General Election Official Results President and Vice President of the United States
  21. "Electoral College". California Secretary of State. Archived from the original on October 30, 2008. Retrieved November 1, 2008.
  22. "2008 Presidential Electors". elections.maryland.gov. Retrieved May 22, 2021.