2008 United States presidential election in Iowa

Last updated

2008 United States presidential election in Iowa
Flag of Iowa (xrmap collection).svg
  2004 November 4, 2008 2012  
  Obama portrait crop.jpg John McCain 2009 Official.jpg
Nominee Barack Obama John McCain
Party Democratic Republican
Home state Illinois Arizona
Running mate Joe Biden Sarah Palin
Electoral vote70
Popular vote828,940682,379
Percentage53.93%44.39%

Iowa Presidential Election Results 2008.svg
2008 US Presidential election in Iowa by congressional district.svg

President before election

George W. Bush
Republican

Elected President

Barack Obama
Democratic

The 2008 United States presidential election in Iowa took place on November 4, 2008, as part of the 2008 United States presidential election. Voters chose seven representatives, or electors to the Electoral College, who voted for president and vice president.

Contents

Iowa was won by the Democratic nominee, Senator Barack Obama of Illinois, by a 9.54% margin of victory. Obama took 53.93% of the vote while his Republican opponent, Senator John McCain of Arizona, took 44.39%. Prior to the election, all 16 organizations considered this a state Obama would win. In 2004, Republican George W. Bush very narrowly won Iowa in his reelection bid, although prior to that, the state had gone Democratic for four consecutive presidential elections. A Midwestern state where agriculture plays a critical role in the daily lives of its citizens, Iowa is nevertheless an independent state. However, due to Obama's popularity from the Iowa caucuses, Bush's low approval rating, and the poor state of the economy, the state easily fell into the Democratic column later in the election cycle. Obama's 828,940 votes are the most received by a Democratic presidential candidate in the state's history.

As of the 2020 presidential election , this is the last election in which Adams County, Audubon County, Benton County, Carroll County, Crawford County, Delaware County, Emmet County, Franklin County, Greene County, Hamilton County, Hardin County, Iowa County, Kossuth County, Palo Alto County, Warren County, and Winnebago County voted for the Democratic candidate. This was also the last time a majority of Iowa's counties went to the Democratic presidential candidate.

Caucuses

The 2008 Iowa caucuses took place on January 3, 2008. They are an unofficial primary, with the delegates to the state convention selected proportionally via a straw poll. The Iowa caucuses mark the traditional formal start of the delegate selection process for the 2008 United States presidential election. It was the first election of the 2008 presidential election. Also referred to as "the First in the Nation Caucus," it was the first election of the primary season on both the Democratic and Republican sides.

Democratic caucuses

Of the eight major Democratic presidential candidates, then-U.S. Senator Barack Obama of Illinois received the most votes and was ultimately declared the winner of the Iowa Democratic Caucus of 2008, making him the first African American to win the caucus. [1] Former U.S. Senator John Edwards of North Carolina came in second place and then-U.S. Senator Hillary Clinton of New York finished third, though Clinton received more delegates than Edwards. Campaigning had begun as early as two years before the event.

History

The Iowa Caucuses have historically been the first held in the United States. The caucus marked the traditional and formal start of the delegate selection process for the 2008 United States presidential election, and the process in which members of the Democratic Party gathered to make policy decisions. [2]

Iowa state law mandates that its caucus must be held at least eight days before any other meeting, caucus, or primary for the presidential nominating process. Therefore, the Iowa Caucuses have always been traditionally the leading state in the nominating process. Not only did controversy brew between the candidates, but the caucuses themselves drew a large amount of media attention. The decisions of the Iowans often affect the rest of the campaign season. [3] Barack Obama's victory in Iowa helped establish him as one of the Democratic frontrunners of 2008 and was a first step toward his eventual nomination. [4]

Process

The caucuses followed the regular procedures of the Democratic Party process. Any voter who was a registered Democrat and a resident of Iowa was eligible to participate in the event. Individuals could have chosen to register or change their party affiliation at the door. [2] It was estimated that 60 percent of the caucusgoers would have attended the caucuses for the first time. [5] All of the caucusgoers met in public buildings or schools in their respective precincts and divided themselves into groups; each group represented a candidate. The voting was done publicly (viva voce). [6] To be viable, each preference group/candidate must have had at least 15 percent of the caucusgoers' votes. If a candidate received less than 15 percent of the caucusgoers' votes, then the supporters of that non-viable candidate had 30 minutes to join a viable candidate's group, join another non-viable candidate's group to make the candidate viable, join an uncommitted group, or choose not to be counted as a voter. [5]

In Iowa, there were 1,784 precincts for the caucuses. Each viable preference group at each caucus elected a certain number of delegates proportional to the group's size that would represent the candidate at the county conventions. There are 99 counties in Iowa, and their Democratic conventions took place on March 15, 2008. At these conventions, a subset of delegates were chosen to attend the district, then state conventions. At the Iowa Democratic Party State Convention on June 14, 2008, a subset of delegates were chosen to attend the Democratic National Convention held August 25–28, 2008, in Denver, Colorado. As in the precinct caucuses, the pledged delegates to the national convention proportionally represented the candidates compared to the results of the state caucus. [6]

Delegate allocation

The delegate allocation to the Democratic National Convention was as follows: 29 district delegates proportionally represented a candidate's support at each congressional district. [7] [8] The First Congressional District receives six pledged delegates, the Second Congressional District receives seven, the Third Congressional District receives six, the Fourth Congressional District receives six, and the Fifth Congressional District receives four. All of these pledged delegates represent each congressional district independently; they are not affected by the results of the state convention. [8]

At the Iowa Democratic Party State Convention, on the other hand, 16 pledged delegates proportionally represented the candidates' support. Ten of these delegates were designated as at-large, meaning that they represent the entire state as a whole. [7] The other six were referred to as Party Leaders and Elected Officials (PLEO). [8] These may include members of the Democratic National Committee (DNC), members of the U.S. House of Representatives and the U.S. Senate, the Governor, and former party leaders. Not all of the PLEOs were pledged, [7] but if they were, they would represent the state as a whole along with the at-large delegates. In total, the Democratic presidential candidates were allocated a total of 45 pledged delegates, depending on their support in each district and in the state. [8]

Twelve delegates that did not represent caucus results were sent to the Democratic National Convention; they are referred to as unpledged. Eleven of them are PLEOs, which include six members of the DNC, one U.S. Senator, three U.S. Representatives, and one Governor. [7] [8] Because these unpledged delegates' profiles are usually high-profile elected officials, they are referred to as superdelegates. [9] The other unpledged delegate is an add-on delegate, who is selected at the Iowa Democratic Party State Convention. [7] [8]

While this process lasts for a period of approximately five months, the results of the state caucus are usually predictable by the results of the precincts' caucuses combined. Therefore, the results of the precinct caucuses provide a good measurement of Iowa's delegation to the Democratic National Convention. [2]

Polls

Pre-caucus opinion polling statistics throughout the campaign season. 2008 Demo Iowa.png
Pre-caucus opinion polling statistics throughout the campaign season.

Before the caucuses, the Des Moines Register reported that during a poll of 800 likely Democratic caucus goers from December 27 to December 30, 2007, the candidates had the following results:

The above results have a margin of sampling error of ±3.5 percentage points. [5]

Barack Obama's results in the opinion polls rose from 28% in the Des Moines Register's poll in late November 2007. This was in part a result of a "dramatic influx of first-time caucusgoers, including a sizable bloc of political independents." [5] Hillary Rodham Clinton remained at a constant 25%, while John Edwards was almost unchanged when his ratings increased to 24% from 23% in November. Approximately one-third of likely caucusgoers said that they could have been persuaded to choose a different candidate before the caucuses. [5]

The December results of the Des Moines Register's poll also showed a widened gap between the three-way contest for the lead — Clinton, Edwards, and Obama — and the rest of the Democratic candidates. No other Democrat received more than 6 percent support of caucusgoers. [5]

Thirty percent of the sample population from the Des Moines Register's poll said that a candidate's ability to bring about change in the United States was the most important to them; 27% said that a candidate who would be most successful in unifying the country would have taken priority in their votes. Most caucusgoers also said that Obama was strong in both of these areas. Having the experience and competence to lead was considered the most important aspect of a candidate by 18 percent of the sample population; Hillary Clinton was rated best on this trait. Only 6 percent of the sample population said that being best able to win the general election was the top priority; Clinton, again, was rated best on this trait. [5]

Results

Caucus results
Iowa Democratic presidential caucuses
Barack Obama
John Edwards
Hillary Clinton
Tie IowaPresidentialPrimaryResults2008.svg
Iowa Democratic presidential caucuses
  Barack Obama
  John Edwards
  Hillary Clinton
  Tie

Caucus Date: January 3, 2008

National Pledged Delegates Determined: 0 (of 45)

Iowa Democratic Presidential Caucus Results – 2008
PartyCandidateState DelegatesPercentageDelegates
Democratic Barack Obama 94037.6%16
Democratic John Edwards 74429.7%14
Democratic Hillary Clinton 73729.4%15
Democratic Bill Richardson 532.1%0
Democratic Joe Biden 230.9%0
Democratic Uncommitted30.2%0
Democratic Christopher Dodd 10.0%0
Totals2,500100.00%45
Voter turnout %

The Iowa Democratic Party does not release vote counts (it releases only the number of delegates to the state convention). [10] Since Hillary Rodham Clinton had the highest delegate strength in Iowa's 5th congressional district (a district allocated four national convention delegates) and received the same amount of national delegates elsewhere, she was projected to receive one more national delegate than Edwards despite receiving fewer projected delegates to the state convention. [10]

The Democratic National Committee gives the 50 states 794 superdelegates. According to a January 4, 2008 poll conducted by the Associated Press, most of the superdelegates were undecided, but 160 had endorsed Clinton, compared to 59 for Obama and 32 for Edwards. Along with the delegates that the candidates secured from Iowa, the numbers were as follows: 175 for Clinton, 75 for Obama, and 46 for Edwards. (To win the Democratic nomination for president, 2,025 delegates are needed.) [11] Thus, Clinton initially retained an overall delegate lead following the Iowa results.

Dennis Kucinich and Barack Obama competed against each other in the Iowa Caucuses, but Kucinich asked that Iowans caucusing for him, should they fail to build a viable preference group on Caucus Night to realign to Barack Obama in the second round. Both had fought for the same priorities including ending the Iraq War, reforming Washington, D.C., and creating a better life for working families. In the 2004 Iowa Democratic Caucuses, Kucinich made a similar announcement in favor of John Edwards. At that caucus, Edwards's aides claimed that this request helped put him in second place. In the 2008 Iowa Caucus, however, Kucinich did not conduct much of a campaign in Iowa. He paid for no organizers nor offices in the state, and he was not invited to the Des Moines Register's debate in December 2007. [12] [13] Mike Gravel didn't conduct an active campaign in Iowa either. [14]

While the 2008 Iowa Caucuses saw a record turnout for both parties, the Democratic caucus drew more than 239,000 voters, almost double the Republican total. [15] Entrance polling indicated that a significant portion of the turnout came from first-time caucus attendees, as well as attendees under the age of 30; two groups of voters that primarily lent their support to Barack Obama. Women, previously expected to largely back Hillary Clinton, split their vote between Clinton and Obama, the latter of whom actually received slightly more support. [15] In the aftermath of the results from the Iowa Caucuses, Chris Dodd and Joe Biden dropped out of the presidential race. [15]

As a result of the Iowa Caucus, Barack Obama received a significant surge of support in the next competition, the New Hampshire Democratic Primary five days after. [16] In New Hampshire pre-primary polls conducted from January 4 to January 6, 2008, Obama enjoyed a 13-point lead over Clinton. [17]

County convention results

Convention Date: March 15, 2008

National Pledged Delegates Determined: 0 (of 45)

Iowa Democratic Presidential County Convention Results – 2008
PartyCandidateCounty DelegatesPercentageNational Delegates
Democratic Barack Obama 1,29951.96%25
Democratic Hillary Clinton 80232.08%14
Democratic John Edwards 38815.52%6
Democratic Uncommitted110.42%0
Totals2,500100.00%45
Voter turnout %
District convention results

Convention Date: April 26, 2008

National pledged delegates determined: 29 (of 45)

Iowa Democratic Presidential District Convention Results – 2008
PartyCandidateDistrict DelegatesPercentageDistrict DelegatesNational Delegates
Democratic Barack Obama 1655.17%2028
Democratic Hillary Clinton 931.03%914
Democratic John Edwards 413.79%03
Totals29100.00%2945
Voter turnout %

Analysis

Barack Obama scored a major victory in the Iowa Democratic Caucuses due to a number of factors. According to exit polls, 93 percent of voters in the Iowa Democratic Caucus were Caucasian and 33% voted for Obama, 27 percent for Clinton, and 24 percent for Edwards; 4% of voters were African American and 72% voted for Obama, 16% for Clinton, and 8% for Edwards; 3% represented other races and they went 49% for Obama, 26% for Clinton, 10% for Richardson, and 5% for Edwards. Obama also won young voters ages 17–44 with 52% of the vote compared to 16% for both Clinton and Edwards. Edwards won middle-age voters ages 45–59 with 30% while Obama received 29% and Clinton took in 26% of their support. Clinton did best among elderly voters ages 60 and over with 40% of the vote while Edwards received 27% and Obama took in 19.5% of their support. Obama won self-identified Democrats by a margin of 32-31-23 (Obama-Clinton-Edwards), Independents backed Obama 41-23-17 (Obama-Edwards-Clinton), as well as self-identified Republicans who supported Obama 44-32-10 (Obama-Edwards-Clinton). Obama also won moderates and liberals but Edwards won conservatives. Socioeconomic class was not really a factor in how voters made their decisions, as Obama won all groups of family incomes.

Obama performed best in Eastern Iowa, which is considered to be the more liberal part of the state, and Central Iowa which is considered to be the more moderate part of the state. Clinton performed best in Western Iowa, which is considered to be the most conservative part of the state.

Republican caucuses

Prior to the 2008 caucuses, as in previous election cycles with a competitive presidential race, an unofficial Ames Straw Poll was held, on August 11, 2007. The official one, electing delegates to the state convention, was held on January 3, 2008, the same day as the Democratic contest. In the Ames Straw Poll, Mitt Romney finished first with 32% of the vote. In the January 2008 caucuses, Mike Huckabee finished first with 34% of the vote.

Process

Unlike the Democratic caucus, the Republican Party does not use voting rounds or have minimum requirements for a percent of votes. The Republican version is done with a straw vote of those attending the caucus. This vote is sometimes done by a show of hands or by dividing themselves into groups according to candidate. However, officially it is done with voters receiving a blank piece of paper with no names on it, and the voter writing a name and placing it in a ballot box. [18]

Following the straw poll, delegates are then elected from the remaining participants in the room, as most voters leave once their vote is cast. All delegates are officially considered unbound, [19] but media outlets either apportion delegates proportionally [20] or apportion them in terms of winner-take-all by counties. [21] In precincts that elect only one delegate, the delegate is chosen by majority vote and the vote must be by paper ballot. [22] The state party strongly urges that delegates reflect the results of the preference poll, but there is no obligation that they do so.

The Ames Straw Poll

The 2007 Ames straw poll was held at Iowa State University (Ames)'s Hilton Coliseum on August 11, 2007. [23] This was primarily a fundraising event for the state's Republican Party, and only Iowa residents who paid the $35 price for a ticket were eligible to vote. Tickets were available through the various presidential campaigns and the Iowa Republican Party's headquarters.

In general, the candidates bought large blocks of tickets and gave them out for free to whoever agreed to go and vote for that candidate. The candidates also rented buses to transport voters to Ames.

Mitt Romney finished first with 32% of the vote, followed by Mike Huckabee (18%), Sam Brownback (15%), Tom Tancredo (14%), and Ron Paul (10%). Six other candidates shared the remaining 14% of the vote.

Pre-caucus polls

Pre-caucus opinion polling statistics throughout the campaign season. 2008 GOP Iowa.png
Pre-caucus opinion polling statistics throughout the campaign season.

Before the caucuses, the Des Moines Register reported the following results from a poll of 800 likely Republican caucus goers from December 27 to December 30, 2007:

The above results have a margin of sampling error of ±3.5 percentage points. [24]

Mike Huckabee's results in the opinion polls rose from 29% in the Des Moines Register's poll in late November 2007. Mitt Romney rose two points from 24% in November to 26% in December. John McCain enjoyed the biggest increase from November, increasing six points from 7% to 13%, while Rudy Giuliani suffered the biggest drop from November, decreasing eight points from 13% to 5%. Giuliani's large drop was attributed to his strategy of skipping early states such as Iowa and New Hampshire in favor of larger, delegate-rich states such as Florida, California, and New York. [24] No other candidate polled more than 10%.

Huckabee's poll numbers in Iowa rose dramatically from October to December, in part due to his backing among evangelical voters, who accounted for almost one-half of those polled. Huckabee led Romney in that group 47%-20%. Huckabee also polled higher than Romney among the group who said it was more important to be a social conservative than a fiscal conservative, while Romney led Huckabee 29%-25% among the group who said that being fiscally conservative was most important. In addition, Romney also polled highest in the categories of experience and competence, the ability to bring about change, and electability.

Results

As of 11:05 p.m. EDT, January 3, 2008, with 100% of the votes reported, the results were:

100% of precincts reporting [25]
CandidateVotes [26] PercentageDelegates
Mike Huckabee 40,95434.36%17
Mitt Romney 30,02125.19%12
Fred Thompson 15,96013.39%0
John McCain 15,53613.03%3
Ron Paul 11,8419.93%2
Rudy Giuliani 4,0993.44%0
Duncan Hunter 5060.42%0
Alan Keyes 2470.21%0
John Cox*10.01%0
Hugh Cort 50%0
Tom Tancredo*50%0
Vern Wuensche20%0
Sam Brownback*10%0
Cap Fendig10%0
Total119,188100%34

*Candidate had already dropped out of the race prior to caucus.

Only three candidates won majorities in the individual counties: Mike Huckabee, Mitt Romney, and Ron Paul. The Giuliani campaign followed an unusual strategy of focusing on larger states that vote later in the process, and had done little if any campaigning in Iowa. Tancredo had already withdrawn from the presidential race two weeks earlier and endorsed Romney, [27] but his name remained in the official list of candidates of the Iowa Republican Party.

Some 120,000 Iowa Republicans attended the 2008 caucuses, a new record. About 87,000 attended in 2000; in 2004, George W. Bush ran unopposed. [28]

General election

Predictions

There were 16 organizations or websites that made state-by-state predictions of the election. Here are their last predictions before election day:

SourceRanking
D.C. Political Report [29] Likely D (flip)
Cook Political Report [30] Lean D (flip)
The Takeaway [31] Lean D (flip)
Electoral-vote.com [32] Solid D (flip)
Washington Post [33] Solid D (flip)
Politico [34] Solid D (flip)
RealClearPolitics [35] Solid D (flip)
FiveThirtyEight [33] Solid D (flip)
CQ Politics [36] Solid D (flip)
The New York Times [37] Lean D (flip)
CNN [38] Safe D (flip)
NPR [33] Solid D (flip)
MSNBC [33] Lean D (flip)
Fox News [39] Likely D (flip)
Associated Press [40] Likely D (flip)
Rasmussen Reports [41] Safe D (flip)

Polling

Obama won every pre-election poll but one taken in the state. The final 3 polls averaged Obama leading 54% to 39%. [42]

Fundraising

John McCain raised a total of $680,641 in the state. Barack Obama raised $2,250,696. [43]

Advertising and visits

Obama and his interest groups spent $15,334,065. McCain and his interest groups spent $5,817,988. [44] The Republican ticket visited the state 9 times. The Democratic ticket visited the state 4 times. [45]

Analysis

Despite its closeness in recent elections, Iowa was not in close contention in the 2008 election. During primary season, Barack Obama had campaigned extensively in the state and won a substantial victory that established him as the Democratic front-runner and ultimately propelled him to victory over Hillary Clinton. In contrast, John McCain did not campaign at all in Iowa and ended up placing fourth in the Iowa Republican Caucus. Moreover, McCain's stand against Congressional ethanol subsidies proved unpopular in a state that had a large corn crop; conversely, Obama supported these subsidies. Polls consistently gave Barack Obama a double-digit lead in the state.

On Election Day, Obama won by a 9.54-point margin. The reliably Republican western part of the state turned out for McCain as expected. John Kerry failed to win any counties in this region in 2004, contributing substantially to Bush's narrow victory in the state. However, Obama significantly improved on Kerry's performance in the region. For instance, Pottawattamie County, home to Council Bluffs, went from an 18-point win for Bush to only a two-point win for McCain. Conversely, in traditionally Democratic Eastern Iowa, Obama did historically well. He was already familiar to many voters in the region, in part because the Quad Cities area spills into Obama's home state of Illinois. He also did very well in typically competitive central Iowa, anchored by the state capital of Des Moines. Every county in the state, except Clarke in central Iowa, voted more Democratic in 2008 than in 2004.

At the same time, incumbent Democratic U.S. Senator Tom Harkin was reelected with 62.66% of the vote over Republican Christopher Reed, a businessman, who received 37.26%. At the state level, Democrats expanded their leads in the Iowa state legislature, picking up four seats in the Iowa House of Representatives and two seats in the Iowa Senate.

Results

2008 United States presidential election in Iowa
PartyCandidateVotesPercentageElectoral votes
Democratic Barack Obama 828,94053.93%7
Republican John McCain 682,37944.39%0
Peace and Freedom Ralph Nader 8,0140.52%0
N/A Write-ins 6,7370.44%0
Libertarian Bob Barr 4,5900.30%0
Constitution Chuck Baldwin 4,4450.29%0
Green Cynthia McKinney 1,4230.09%0
Socialist Workers James Harris 2920.02%0
Socialist Brian Moore 1820.01%0
Party for Socialism and Liberation Gloria La Riva 1210.01%0
Invalid or blank votes13,8820.01%
Totals1,544,268100%7
Voter Turnout (Voting age/Registered)69%/73%

By county

CountyBarack Obama
Democratic
John McCain
Republican
Various candidates
Other parties
MarginTotal votes cast
# %# %# %# %
Adair 1,92447.47%2,06050.83%691.70%-136-3.36%4,053
Adams 1,11850.68%1,04647.42%421.91%723.26%2,206
Allamakee 3,97156.23%2,96541.99%1261.77%1,00614.24%7,062
Appanoose 2,97048.07%3,08649.94%1231.97%-116-1.87%6,179
Audubon 1,73950.61%1,63447.56%631.83%1053.05%3,436
Benton 7,05851.45%6,44747.00%2121.54%6114.45%13,717
Black Hawk 39,18460.48%24,66238.07%9411.45%14,52222.41%64,787
Boone 7,35652.80%6,29345.17%2822.02%1,0637.63%13,931
Bremer 6,94053.92%5,74144.60%1911.48%1,1999.32%12,872
Buchanan 6,05058.50%4,13940.02%1531.48%1,91118.48%10,342
Buena Vista 4,07548.40%4,22350.15%1221.45%-148-1.75%8,420
Butler 3,36446.94%3,70051.63%1021.43%-336-4.69%7,166
Calhoun 2,34145.06%2,74152.76%1132.18%-400-7.70%5,195
Carroll 5,30251.01%4,92247.35%1711.65%3803.66%10,395
Cass 3,21143.68%4,00654.49%1351.83%-795-10.81%7,352
Cedar 5,22154.02%4,28944.38%1551.60%9329.64%9,665
Cerro Gordo 14,40559.67%9,37538.83%3631.50%5,03020.84%24,143
Cherokee 2,89045.38%3,37252.95%1061.67%-482-7.57%6,368
Chickasaw 3,92359.57%2,55738.82%1061.61%1,36620.75%6,586
Clarke 2,21849.90%2,11847.65%1092.44%1002.25%4,445
Clay 3,92546.72%4,35551.83%1221.45%-430-5.11%8,402
Clayton 5,19557.79%3,65140.61%1441.61%1,54417.18%8,990
Clinton 15,01860.75%9,32437.72%3801.54%5,69423.03%24,722
Crawford 3,71551.66%3,34546.52%1311.82%3705.14%7,191
Dallas 15,14946.41%16,95451.94%5401.65%-1,805-5.53%32,643
Davis 1,68044.00%2,02953.14%1092.85%-349-9.14%3,818
Decatur 1,98648.37%2,02049.20%1002.43%-34-0.83%4,106
Delaware 4,64952.22%4,11346.20%1411.58%5366.02%8,903
Des Moines 12,46260.57%7,72137.53%3911.90%4,74123.04%20,574
Dickinson 4,62546.68%5,16252.10%1201.20%-537-5.42%9,907
Dubuque 28,61159.65%18,65138.89%7011.46%9,96020.76%47,963
Emmet 2,57051.25%2,37347.32%721.44%1973.93%5,015
Fayette 5,90857.57%4,20540.98%1491.45%1,70316.59%10,262
Floyd 4,82259.58%3,05137.70%2192.71%1,77121.88%8,093
Franklin 2,57550.01%2,50148.57%731.42%741.44%5,149
Fremont 1,84847.43%1,98951.05%591.52%-141-3.62%3,896
Greene 2,37149.35%2,34948.90%841.74%220.45%4,804
Grundy 2,79040.86%3,94557.77%941.37%-1,155-16.91%6,829
Guthrie 2,62544.88%3,07452.56%1502.57%-449-7.68%5,849
Hamilton 4,01849.72%3,91348.42%1501.86%1051.30%8,081
Hancock 2,80547.30%3,01650.86%1091.85%-211-3.56%5,930
Hardin 4,39349.58%4,31548.70%1531.73%780.88%8,861
Harrison 3,55546.88%3,90951.55%1191.57%-354-4.67%7,583
Henry 4,34946.36%4,82251.41%2092.22%-473-5.05%9,380
Howard 2,94162.19%1,72236.41%661.40%1,21925.78%4,729
Humboldt 2,16042.16%2,89556.51%681.32%-735-14.35%5,123
Ida 1,45440.99%2,03657.40%571.61%-582-16.41%3,547
Iowa 4,20249.16%4,18848.99%1581.85%140.17%8,548
Jackson 6,10261.28%3,67336.89%1821.82%2,42924.39%9,957
Jasper 10,25052.78%8,79445.28%3781.95%1,4567.50%19,422
Jefferson 5,07058.73%3,32438.51%2382.76%1,74620.22%8,632
Johnson 51,02769.91%20,73228.40%1,2301.69%30,29541.51%72,989
Jones 5,44654.42%4,40544.01%1571.57%1,04110.41%10,008
Keokuk 2,51846.96%2,71250.58%1322.46%-194-3.62%5,362
Kossuth 4,62550.82%4,32947.57%1461.60%2963.25%9,100
Lee 9,82157.00%7,06240.99%3472.01%2,75916.01%17,230
Linn 68,03760.01%43,62638.48%1,7061.50%24,41121.53%113,369
Louisa 2,52351.27%2,31447.02%841.71%2094.25%4,921
Lucas 2,02945.33%2,33052.06%1172.61%-301-6.73%4,476
Lyon 1,67526.93%4,47171.88%741.19%-2,796-44.95%6,220
Madison 3,73344.02%4,57953.99%1691.99%-846-9.97%8,481
Mahaska 4,46440.83%6,27157.35%1991.82%-1,807-16.52%10,934
Marion 7,42143.57%9,25654.34%3552.09%-1,835-10.77%17,032
Marshall 10,02353.71%8,27844.36%3621.93%1,7459.35%18,663
Mills 2,97640.86%4,18357.44%1241.70%-1,207-16.58%7,283
Mitchell 3,17955.13%2,46942.82%1182.05%71012.31%5,766
Monona 2,29547.84%2,41150.26%911.90%-116-2.42%4,797
Monroe 1,79846.41%2,00051.63%761.96%-202-5.22%3,874
Montgomery 2,32643.98%2,88754.58%761.44%-561-10.60%5,289
Muscatine 10,92057.11%7,92941.47%2711.42%2,99115.64%19,120
O'Brien 2,33831.88%4,89466.74%1011.38%-2,556-34.86%7,333
Osceola 1,03733.14%2,02764.78%652.08%-990-31.64%3,129
Page 2,90039.41%4,35159.12%1081.47%-1,451-19.71%7,359
Palo Alto 2,42850.50%2,29447.71%861.79%1342.79%4,808
Plymouth 4,62936.99%7,76562.05%1210.96%-3,136-25.06%12,515
Pocahontas 1,80044.87%2,13853.29%741.84%-338-8.42%4,012
Polk 120,98456.43%89,66841.82%3,7571.75%31,31614.61%214,409
Pottawattamie 20,43648.28%21,23750.18%6511.54%-801-1.90%42,324
Poweshiek 5,51955.01%4,34043.26%1741.73%1,17911.75%10,033
Ringgold 1,23645.97%1,40152.10%521.93%-165-6.13%2,689
Sac 2,25644.65%2,70553.53%921.82%-449-8.88%5,053
Scott 48,92756.64%36,36542.10%1,0861.26%12,56214.54%86,378
Shelby 2,86344.35%3,48854.04%1041.61%-625-9.69%6,455
Sioux 3,03018.18%13,49080.95%1450.87%-10,460-62.77%16,665
Story 26,54856.99%18,99540.78%1,0382.23%7,55316.21%46,581
Tama 4,89955.34%3,82043.15%1331.51%1,07912.19%8,852
Taylor 1,34744.51%1,60753.11%722.38%-260-8.60%3,026
Union 3,00050.73%2,78147.02%1332.25%2193.71%5,914
Van Buren 1,54642.80%1,98654.98%802.21%-440-12.18%3,612
Wapello 8,82055.33%6,66341.80%4572.87%2,15713.53%15,940
Warren 12,29949.42%12,14448.79%4461.79%1550.63%24,889
Washington 5,17048.64%5,24749.36%2122.00%-77-0.72%10,629
Wayne 1,35745.52%1,56552.50%591.98%-208-6.98%2,981
Webster 9,91753.44%8,33744.93%3021.63%1,5808.51%18,556
Winnebago 3,25453.48%2,73044.86%1011.66%5248.62%6,085
Winneshiek 6,82960.52%4,27337.87%1821.61%2,55622.65%11,284
Woodbury 21,98349.05%22,21949.58%6131.37%-236-0.53%44,815
Worth 2,56760.27%1,61237.85%801.88%95522.42%4,259
Wright 3,10248.51%3,19850.01%951.48%-96-1.50%6,395
Total828,94053.93%682,37944.39%25,8041.68%146,5619.54%1,537,123
Iowa counties shift 2004-2008.svg
Iowa counties trend 2004-2008.svg
Iowa County Flips 2008.svg

Counties that flipped from Republican to Democratic

By congressional district

Barack Obama carried 4 out of the state's 5 congressional districts, including one district held by a Republican.

DistrictMcCainObamaRepresentative
1st 40.72%58.24% Bruce Braley
2nd 38.57%60.18% Dave Loebsack
3rd 44.66%54.03% Leonard Boswell
4th 45.53%53.11% Tom Latham
5th 54.60%44.25% Steve King

Electors

Technically the voters of Iowa cast their ballots for electors: representatives to the Electoral College. Iowa is allocated 7 electors because it has 5 congressional districts and 2 senators. All candidates who appear on the ballot or qualify to receive write-in votes must submit a list of 7 electors, who pledge to vote for their candidate and his or her running mate. Whoever wins the majority of votes in the state is awarded all 7 electoral votes. Their chosen electors then vote for president and vice president. Although electors are pledged to their candidate and running mate, they are not obligated to vote for them. [46] An elector who votes for someone other than his or her candidate is known as a faithless elector.

The electors of each state and the District of Columbia met on December 15, 2008, to cast their votes for president and vice president. The Electoral College itself never meets as one body. Instead the electors from each state and the District of Columbia met in their respective capitols.

The following were the members of the Electoral College from the state. All 7 pledged to Barack Obama and Joe Biden:

  1. Elwood Thompson
  2. Slayton Thompson
  3. Kathleen O'Leary
  4. Jon Heitland
  5. Dennis Ryan
  6. Joe Judge
  7. Audrey Linville

See also

Related Research Articles

<span class="mw-page-title-main">2008 United States presidential election</span> 56th quadrennial U.S. presidential election

The 2008 United States presidential election was the 56th quadrennial presidential election, held on November 4, 2008. The Democratic ticket of Barack Obama, the junior senator from Illinois, and Joe Biden, the senior senator from Delaware, defeated the Republican ticket of John McCain, the senior senator from Arizona, and Sarah Palin, the governor of Alaska. Obama became the first African American to be elected to the presidency, as well as being only the third sitting United States senator elected president, joining Warren G. Harding and John F. Kennedy. Meanwhile, this was only the second successful all-senator ticket since the 1960 election and is the only election where both major party nominees were sitting senators. This was the first election since 1952 in which neither the incumbent president nor vice president was on the ballot, as well as the first election since 1928 in which neither ran for the nomination.

<span class="mw-page-title-main">Iowa caucuses</span> United States electoral event

The Iowa caucuses are quadrennial electoral events for the Democratic and Republican parties in the U.S. state of Iowa. Unlike primary elections, where registered voters cast ballots at polling places on election day, Iowa caucuses are meetings where voters gather to discuss and select candidates for their registered party. Political parties hold the caucuses, in contrast to most state-run primaries. Both presidential and midterm elections in Iowa use caucuses. The caucuses are also held to select delegates to county conventions and party committees, among other party activities.

<span class="mw-page-title-main">2008 Democratic Party presidential primaries</span> Selection of the Democratic Party nominee

From January 3 to June 3, 2008, voters of the Democratic Party chose their nominee for president in the 2008 United States presidential election. Senator Barack Obama of Illinois was selected as the nominee, becoming the first African American to secure the presidential nomination of any major political party in the United States. However, due to a close race between Obama and Senator Hillary Clinton of New York, the contest remained competitive for longer than expected; neither candidate received enough pledged delegates from state primaries and caucuses to achieve a majority, without endorsements from unpledged delegates (superdelegates).

The following is a timeline of major events leading up to and immediately following the United States presidential election of 2008. The election was the 56th quadrennial United States presidential election. It was held on November 4, 2008, but its significant events and background date back to about 2002. The Democratic Party nominee, Senator Barack Obama of Illinois, defeated the Republican Party's nominee, Senator John McCain of Arizona.

<span class="mw-page-title-main">2008 Iowa Democratic presidential caucuses</span> Democratic caucus in the 2008 election

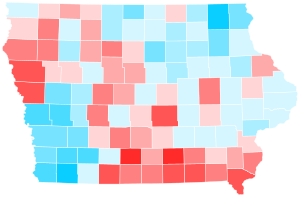
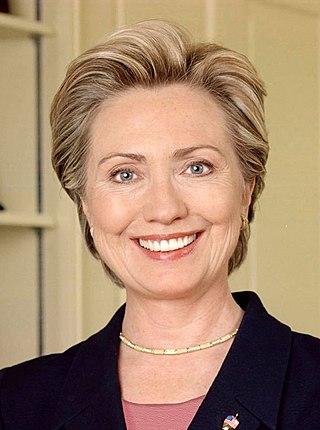
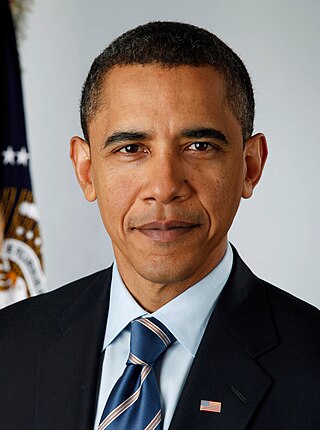
The 2008 Iowa Democratic presidential caucus occurred on January 3, and was the state caucuses of the Iowa Democratic Party. It was the first election for the Democrats of the 2008 presidential election. Also referred to as "the First in the Nation Caucus," it was the first election of the primary season on both the Democratic and Republican sides. Of the eight major Democratic presidential candidates, then-U.S. Senator Barack Obama of Illinois received the most votes and was ultimately declared the winner of the Iowa Democratic Caucus of 2008, making him the first African American to win the caucus and the first African American to win a primary state since Jesse Jackson in 1988. Former U.S. Senator John Edwards of North Carolina came in second place and then-U.S. Senator Hillary Clinton of New York finished third, though Clinton received more delegates than Edwards. Campaigning had begun as early as two years before the event.

<span class="mw-page-title-main">2008 Iowa Republican presidential caucuses</span>

The 2008 Iowa Republican presidential caucuses took place on January 3, 2008. The Iowa Republican caucuses are an unofficial primary, with the delegates to the state convention selected proportionally via a straw poll. The Iowa caucuses mark the traditional formal start of the delegate selection process for the 2008 United States presidential election.

<span class="mw-page-title-main">2008 Republican Party presidential primaries</span> Selection of Republican US presidential candidate

From January 3 to June 3, 2008, voters of the Republican Party chose their nominee for president in the 2008 United States presidential election. Senator John McCain of Arizona was selected as the nominee through a series of primary elections and caucuses culminating in the 2008 Republican National Convention held from Monday, September 1, through Thursday, September 4, 2008, in Saint Paul, Minnesota. President George W. Bush was ineligible to be elected to a third term due to the term limits established by the 22nd Amendment.

<span class="mw-page-title-main">2008 New Hampshire Democratic presidential primary</span>

The 2008 New Hampshire Democratic presidential primary on January 8, 2008 was the first primary in the United States in 2008. Its purpose was to determine the number of delegates from New Hampshire that would represent a certain candidate at the National Convention. In a primary, members of a political party—in this case, the Democratic Party—will select the candidates to a subsequent election. Since 1920, New Hampshire has always hosted the first primaries in the entire nation. The Democratic Party's primary occurred on the same day as the Republican primary.

<span class="mw-page-title-main">2008 Nevada Republican presidential caucuses</span>

The 2008 Nevada Republican presidential caucuses was held on January 19, the same day as the 2008 South Carolina Republican primary, with 31 delegates at stake. Mitt Romney was the winner in Nevada with 51% of the votes, with Ron Paul in second place. Half of Romney's votes came from Mormons, while two-thirds of the independent voters favored Paul. According to the Las Vegas Sun, Republicans crossed over in large numbers to vote Democratic; CNN exit polls indicated that Republican voters made up 4% of the Democratic caucus turnout.

<span class="mw-page-title-main">2008 Nevada Democratic presidential caucuses</span>

The 2008 Nevada Democratic presidential caucuses took place on January 19, 2008 after having been moved from a later date by the Nevada Democratic Party. The Nevada Democratic Caucus was considered important in determining the eventual party nominee, as many described it as the "Bellwether of the West" seeing as how it is the first Western state to vote in the Democratic Presidential Primary season.

<span class="mw-page-title-main">Nevada presidential caucuses</span> Electoral event

The Nevada presidential caucuses are an electoral event in which citizens met in precinct caucuses to elect delegates to the corresponding county conventions. In 2021, Harry Reid passed legislation (AB321) to include primaries in hopes of increasing voter turn-out. Nevada has for decades and still does have a caucus. The caucus is where the delegates receive the votes that will be carried to the National Convention and not the primaries. There are 17 counties in Nevada and the state has 26 delegates. The Nevada caucuses began in 1981. The Kerry/Dean caucus was held on February 14, 2004. In 2008 the DNC gave Nevada the official first in the west status reflecting the growing importance of the West as well as Nevada's electoral bellwether status. The 2008 Nevada caucuses were the third major electoral event in the nominating process for President of the United States. In 2016, the Democratic caucus was held on February 20 and the Republican caucus was held on February 23.

<span class="mw-page-title-main">2008 Colorado Democratic presidential caucuses</span>

The 2008 Colorado Democratic presidential caucuses took place on Super Tuesday, February 5, 2008. As he did in every other state that held a caucus rather than a primary, Barack Obama won the caucus by a wide, two-to-one margin over Hillary Clinton.

<span class="mw-page-title-main">2008 United States presidential election in Washington (state)</span> Election in Washington

The 2008 United States presidential election in Washington took place on November 4, 2008, and was part of the 2008 United States presidential election. Voters chose 11 representatives, or electors to the Electoral College, who voted for president and vice president.

<span class="mw-page-title-main">2008 United States presidential election in South Carolina</span> Election in South Carolina

The 2008 United States presidential election in South Carolina took place on November 4, 2008, and was part of the 2008 United States presidential election. Voters chose eight representatives, or electors to the Electoral College, who voted for president and vice president.

<span class="mw-page-title-main">2012 United States presidential election in Iowa</span>

The 2012 United States presidential election in Iowa took place on November 6, 2012, as part of the 2012 United States presidential election in which all 50 states plus the District of Columbia participated. Iowa voters chose six electors to represent them in the Electoral College via a popular vote pitting incumbent Democratic President Barack Obama and his running mate, Vice President Joe Biden, against Republican challenger and former Massachusetts Governor Mitt Romney and his running mate, Congressman Paul Ryan.

<span class="mw-page-title-main">2012 United States presidential election in Nevada</span>

The 2012 United States presidential election in Nevada took place on November 6, 2012, as part of the 2012 United States presidential election in which all 50 states plus the District of Columbia participated. State voters chose six electors to represent them in the Electoral College via a popular vote pitting incumbent Democratic President Barack Obama and his running mate, Vice President Joe Biden, against Republican challenger and former Massachusetts Governor Mitt Romney and his running mate, Congressman Paul Ryan.

<span class="mw-page-title-main">2012 United States presidential election in North Carolina</span>

The 2012 United States presidential election in North Carolina took place on November 6, 2012, as part of the 2012 general election in which all 50 states plus the District of Columbia participated. North Carolina voters chose 15 electors to represent them in the Electoral College via a popular vote pitting incumbent Democratic President Barack Obama and his running mate, Vice President Joe Biden, against Republican challenger and former Massachusetts Governor Mitt Romney and his running mate, Congressman Paul Ryan.

<span class="mw-page-title-main">2008 United States presidential election in New Hampshire</span> Election in New Hampshire

The 2008 United States presidential election in New Hampshire took place on November 4, 2008, as part of the 2008 United States presidential election throughout all 50 states and D.C. Voters chose four representatives, or electors to the Electoral College, who voted for president and vice president.

<span class="mw-page-title-main">2016 United States presidential election in Iowa</span>

The 2016 United States presidential election in Iowa was held on Tuesday, November 8, 2016, as part of the 2016 United States presidential election in which all 50 states plus the District of Columbia participated. Iowa voters chose electors to represent them in the Electoral College via a popular vote, pitting the Republican Party's nominee, businessman Donald Trump, and his running mate Indiana Governor Mike Pence against the Democratic Party nominee, former Secretary of State Hillary Clinton, and her running mate Virginia Senator Tim Kaine. Iowa has six electoral votes in the Electoral College.

<span class="mw-page-title-main">2016 Iowa Democratic presidential caucuses</span>

The 2016 Iowa Democratic presidential caucuses were held on Monday February 1 in Iowa, as usual marking the Democratic Party's first nominating contest in their series of presidential primaries ahead of the 2016 presidential election.

References

  1. Shepherd, Julianne (January 4, 2008). "Barack Obama Takes Iowa Caucuses; Senator Could Become America's First Black President". Vibe. Retrieved March 5, 2008.
  2. 1 2 3 "About the Iowa Caucuses". Iowa Caucus 2008. Iowa Department of Economic Development. 2007. Archived from the original on January 2, 2008. Retrieved January 3, 2008.
  3. Best, Amy. "Iowa Caucuses: The Importance of Being First". The Cube. Iowa Department of Economic Development. Archived from the original on September 14, 2012. Retrieved February 1, 2008.
  4. Murray, Shailagh (May 20, 2008). "Obama's Triumphant Iowa Return". Washingtonpost.com. Retrieved January 13, 2009.
  5. 1 2 3 4 5 6 7 Beaumont, Thomas (January 1, 2008). "New Iowa Poll: Obama widens lead over Clinton". DesMoinesRegister.com. Des Moines Register and Tribune Company. Archived from the original on October 8, 2009. Retrieved January 3, 2008.
  6. 1 2 Gill, Kathy (2008). "How Do The Iowa Caucuses Work?". About.com US Politics. About. Archived from the original on January 6, 2008. Retrieved January 9, 2008.
  7. 1 2 3 4 5 "How To Become A Delegate". The 2008 Democratic National Convention. 2008 Democratic National Convention Committee. 2008. Archived from the original on December 24, 2007. Retrieved January 15, 2008.
  8. 1 2 3 4 5 6 Berg-Andersson, Richard E. (May 15, 2008). "Iowa Democratic Delegation 2008". The Green Papers. Retrieved May 16, 2008.
  9. The Associated Press (December 20, 2007). "What Are Delegates?". AOL News. Retrieved January 24, 2008.
  10. 1 2 "America Votes 2008; Iowa Caucuses (Special Coverage)". CNN. January 3, 2008. CNN.
  11. Associated Press (January 4, 2008). "Clinton still leads in overall delegate race, despite losing in Iowa" . Retrieved January 4, 2008.
  12. Kucinich Asks Supporters to Back Obama. Associated Press . 2008-01-02. Archived January 5, 2008, at the Wayback Machine
  13. Zeleny, Jeff. Kucinich Tells Supporters to Caucus for Obama. The New York Times . 2008-01-01.
  14. "Second-Tier Dems Hope for Caucus Boost". WHO-TV. January 3, 2008. Archived from the original on January 12, 2008. Retrieved January 4, 2008.
  15. 1 2 3 Martelle, Scott (January 4, 2008). "America Votes 2008; Iowa Caucuses (Special Coverage)". Los Angeles Times. Retrieved May 5, 2010.
  16. Liasson, Mara; Siegel, Robert (January 8, 2008). "What's at Stake in the New Hampshire Primary". National Public Radio. NPR and the Associated Press. Retrieved January 14, 2008.
  17. Memmott, Mark; Lawrence, Jill (January 6, 2008). "Obama up by 13 points, McCain up by 4 in USAT/Gallup Poll in N.H." USAToday.com. USA Today. Archived from the original on January 16, 2008. Retrieved January 14, 2008.
  18. Leibovich, Mark (January 4, 2008). "One Republican Caucus Is Found to Be an Uncomplicated Affair". The New York Times. Retrieved May 5, 2010.
  19. Republican Party of IOWA | Caucuses
  20. "Election Center 2008: Primary Results – Elections & Politics news from CNN.com". CNN. Retrieved May 5, 2010.
  21. "2014 Midterm Election Results – Congressional, Senate, House & Gubernatorial". ABC News.
  22. "Iowa Caucus 2008". Archived from the original on January 2, 2008. Retrieved July 19, 2012.
  23. Ames Straw Poll date set Archived 2011-07-18 at the Wayback Machine from OvalOffice2008.com.
  24. 1 2 Roos, Jonathan (December 31, 2007). "GOP poll: Huckabee maintains lead over Romney". DesMoinesRegister.com. Des Moines Register and Tribune Company. Retrieved August 31, 2008.
  25. "Election Center 2008: Primary Results for Iowa". CNNPolitics.com. Cable News Network. January 4, 2008. Retrieved January 4, 2008.
  26. "Certified Results of the January 3rd, 2008 – Iowa Republican Party Caucus Presidential Straw Vote". Republican Party of Iowa. January 3, 2008. Archived from the original on May 21, 2008. Retrieved May 23, 2008.
  27. Pulliam, Jason (December 20, 2007). "Tancredo drops out, endorses Romney". USA Today. Retrieved December 20, 2007.
  28. Woodward, Whitney (January 4, 2008). "Democrat turnout outnumbers GOP by 2-1". Quad-City Times . Retrieved January 4, 2008.
  29. "D.C.'s Political Report: The complete source for campaign summaries". January 1, 2009. Archived from the original on January 1, 2009. Retrieved August 23, 2021.
  30. "Presidential". May 5, 2015. Archived from the original on May 5, 2015. Retrieved August 23, 2021.
  31. "Vote 2008 - The Takeaway - Track the Electoral College vote predictions". April 22, 2009. Archived from the original on April 22, 2009. Retrieved August 23, 2021.
  32. "Electoral-vote.com: President, Senate, House Updated Daily". electoral-vote.com. Retrieved August 23, 2021.
  33. 1 2 3 4 Based on Takeaway
  34. "POLITICO's 2008 Swing State Map - POLITICO.com". www.politico.com. Retrieved September 22, 2016.
  35. "RealClearPolitics - Electoral Map". Archived from the original on June 5, 2008.
  36. "CQ Presidential Election Maps, 2008". CQ Politics. Archived from the original on June 14, 2009. Retrieved December 20, 2009.
  37. Nagourney, Adam; Zeleny, Jeff; Carter, Shan (November 4, 2008). "The Electoral Map: Key States". The New York Times. Retrieved May 26, 2010.
  38. "October 2008 CNN Political Ticker - CNN.com Blogs". CNN. October 31, 2008. Archived from the original on June 19, 2010. Retrieved May 26, 2010.
  39. "Winning The Electoral College". Fox News. April 27, 2010.
  40. "roadto270". hosted.ap.org. Retrieved September 22, 2016.
  41. "Election 2008: Electoral College Update - Rasmussen Reports". www.rasmussenreports.com. Retrieved September 22, 2016.
  42. David Leip. "Election 2008 Polls – Dave Leip's Atlas of U.S. Presidential Elections".
  43. "Presidential Campaign Finance". Archived from the original on March 24, 2009. Retrieved August 20, 2009.
  44. "Map: Campaign Ad Spending – Election Center 2008 from CNN.com". CNN. Retrieved May 26, 2010.
  45. "Map: Campaign Candidate Visits – Election Center 2008 from CNN.com". CNN. Retrieved May 26, 2010.
  46. "Electoral College". California Secretary of State. Archived from the original on October 30, 2008. Retrieved November 1, 2008.