Aberdeen North | |
---|---|
Burgh constituency for the House of Commons | |
Subdivisions of Scotland | Aberdeen City |
Electorate | 69,622 |
Current constituency | |
Created | 1885 |
Member of Parliament | Kirsty Blackman (SNP) |
Seats | One |
Created from | Aberdeen |
Overlaps | |
Scottish Parliament | North East Scotland |
Aberdeen North is a burgh constituency of the House of Commons of the Parliament of the United Kingdom and it elects one Member of Parliament (MP) by the first past the post system of election. It was first used in the 1885 general election, but has undergone various boundary changes since that date.
As of the 2019 general election this can be considered the safest SNP seat, as it has the largest SNP vote share and relative majority. [1] [2]
There was also an Aberdeen North Holyrood constituency, a constituency of the Scottish Parliament, [3] created in 1999 with the boundaries of the Westminster constituency of at that time. It was abolished in 2011 by the new constituencies of Aberdeen Donside and Aberdeen Central.
The seat covers the northern half of Aberdeen including the city centre and the North Sea oil companies at the harbour. [4]
Following the 2023 Periodic Review of Westminster constituencies the newly redrawn Aberdeen North to be fought at the 2024 United Kingdom general election would be made from:
As redefined by the Fifth Review of the Boundary Commission for Scotland, and subsequently first used in the 2005 general election, [6] Aberdeen North is entirely within the Aberdeen City council area and one of five constituencies covering that council area and the Aberdeenshire council area. To the south of Aberdeen North there is Aberdeen South, which is also entirely within the Aberdeen City council area. To the west there is West Aberdeenshire and Kincardine, which is entirely within the Aberdeenshire council area, and to the north there is Gordon, which covers part of the Aberdeen City council area and part of the Aberdeenshire council area. Further north there is Banff and Buchan which, like West Aberdeenshire and Kincardine, is entirely within the Aberdeenshire council area.
Fifth Review changes include the transfer of Bridge of Don, Dyce and Danestone areas from Aberdeen North to Gordon, and the new Aberdeen North has boundaries which are very different from those of the earlier constituency. The northern boundary of the earlier constituency coincided with the northern boundary of the Aberdeen City council area. At that time, Aberdeen Central and Aberdeen South covered the rest of the Aberdeen City council area, and all three Aberdeen constituencies were entirely within the council area.
From 1832 to 1885 there was a single Aberdeen constituency. Prior to 1832, the burgh of Aberdeen had been represented as a component of the Aberdeen Burghs constituency.
When Aberdeen North was created by the Redistribution of Seats Act 1885 and first used in the 1885 general election, so was Aberdeen South. Aberdeen North then consisted of the municipal wards of St Clement, St Andrew, St Machar and Greyfriars, and the 10th and 11th Parliamentary Polling Districts. [7] The rest of the county of Aberdeen was covered by the county constituencies of Eastern Aberdeenshire and Western Aberdeenshire. [8]
The same boundaries were used in the 1886 general election, the 1892 general election, the 1895 general election, the 1900 general election, the 1906 general election, the January 1910 general election and the December 1910 general election.
In 1918 constituency boundaries were redefined by the Representation of the People Act 1918. By then the county of city of Aberdeen had been created and, together with Aberdeen North, Aberdeen South became one of two constituencies covering the city (which was one of four counties of cities in Scotland) and entirely within the city. The new boundaries were first used in the 1918 general election, and Aberdeen North then consisted of the wards of Greyfriars, St Andrew, St Clement, St Machar, Torry and Woodside. [8] The county of Aberdeen was covered by Aberdeen and Kincardine East, Central Aberdeenshire and Kincardine and West Aberdeenshire. Aberdeen and Kincardine East and Central Aberdeenshire were entirely within the county of Aberdeen. Kincardine and West Aberdeenshire covered the county of Kincardine minus the burgh of Inverbervie, which was covered by Montrose Burghs, and part of the county of Aberdeen.
The same boundaries were used in the 1922 general election, the 1923 general election, the 1924 general election, the 1929 general election, the 1931 general election, the 1935 general election and the 1945 general election.
For the 1950 general election boundaries were redefined again, by the House of Commons (Redistribution of Seats) Act 1949. A new list of wards defined Aberdeen North - Glimonston, Greyfriars, St Clement, St Machar, St Nicholas and Woodside [8] - but the county of city of Aberdeen remained a two-constituency city, divided between Aberdeen South and Aberdeen North, with both constituencies entirely within the city.
The county of Aberdeen was now again divided between East Aberdeenshire and West Aberdeenshire, with both of these constituencies entirely within the county.
The same boundaries were used for the 1951 general election.
By the time of the 1955 general election, a boundary review had taken account of a small enlargement of the city area, and Aberdeen North was defined as consisting of the wards of Cairncry, St Andrews, St Clement's, St Machar, St Nicholas and Woodside. [8] The same boundaries were used for the 1959 general election, the 1964 general election, the 1966 general election and the 1970 general election.
For the February 1974 general election there was, again, no change to the boundaries of Aberdeen North, but a review had defined the constituency in terms of a new list of wards. The new wards were Mastrick, Northfield, St Clement's, St Machar, St Nicholas, and Woodside. [8] February 1974 boundaries were used also for the October 1974 general election.
In 1975, throughout Scotland, under the Local Government (Scotland) Act 1973, counties were abolished, and the enlarged City of Aberdeen district was formed by including areas formerly within the county of Aberdeen and the county of Kincardine. The City of Aberdeen district became a district within the Grampian region. The enlarged district included areas covered by the constituencies of West Aberdeenshire and North Angus and Mearns. North Angus and Mearns had been created in 1950 to cover the county of Kincardine and part of the county of Angus.
The 1979 general election was held before a review of constituency boundaries took account of new local government boundaries.
This section needs expansion. You can help by adding to it. (June 2008) |
In this period the constituency was made up of the City of Aberdeen District electoral divisions of Ashgrove, Brimmond, Kittybrewster, Mastrick, Northfield East, Northfield West, St Machar, Seaton, Summerfield, and Woodside.
The 1983 general election, the 1987 general election and the 1992 general election took place during this period.
In 1996, under the Local Government etc (Scotland) Act 1994, local government regions and districts were abolished and the city became one of 32 unitary council areas of Scotland. Also, the name of the city became, officially, Aberdeen City.
In this period the constituency was made up of the City of Aberdeen District electoral divisions of Balgownie, Brimmond, Danestone, Mastrick, Middleton, Northfield, Summerfield, and West Don, as provided for by the Parliamentary Constituencies (Scotland) Order 1995. [9]
Since 2005 the constituency is made up of the Aberdeen City Council wards of Auchmill, Berryden, Castlehill, Cummings Park, Donmouth, Hilton, Kittybrewster, Mastrick, Midstocket, Newhills, Pittodrie, St Machar, Seaton, Sheddocksley, Springhill, Stockethill, Summerhill, Sunnybank, and Woodside, as provided for by the Parliamentary Constituencies (Scotland) Order 2005. [10]
As redefined for the 1997 general election, Aberdeen North was one of three constituencies covering and entirely within the Aberdeen City area, the other two being Aberdeen South and Aberdeen Central. Aberdeen South shared boundaries with both of the other two constituencies.
Party | Candidate | Votes | % | ±% | |
---|---|---|---|---|---|
Alba | Charlie Abel [11] | ||||
SNP | Kirsty Blackman [ citation needed ] | ||||
Liberal Democrats | Desmond Bouse[ citation needed ] | ||||
TUSC | Lucas Grant [12] | ||||
Workers Party | Neil Healy [13] | ||||
Scottish Green | Esme Houston [14] | ||||
Conservative | Gillian Tebberen[ citation needed ] | ||||
Labour | Lynn Thomson[ citation needed ] | ||||
Turnout | |||||
Registered electors | |||||
Swing | |||||
Party | Candidate | Votes | % | ±% | |
---|---|---|---|---|---|
SNP | Kirsty Blackman | 20,205 | 54.0 | 12.7 | |
Conservative | Ryan Houghton | 7,535 | 20.1 | 2.6 | |
Labour | Nurul Hoque Ali | 4,939 | 13.2 | 16.8 | |
Liberal Democrats | Isobel Davidson | 2,846 | 7.6 | 3.0 | |
Brexit Party | Sebastian Leslie | 1,008 | 2.7 | New | |
Scottish Green | Guy Ingerson | 880 | 2.4 | New | |
Majority | 12,670 | 33.9 | 22.6 | ||
Turnout | 37,413 | 59.9 | 0.7 | ||
Registered electors | 62,489 | ||||
SNP hold | Swing | 7.7 | |||
Party | Candidate | Votes | % | ±% | |
---|---|---|---|---|---|
SNP | Kirsty Blackman | 15,170 | 41.3 | 15.1 | |
Labour | Orr Vinegold | 11,031 | 30.0 | 4.1 | |
Conservative | Grace O'Keeffe | 8,341 | 22.7 | 10.6 | |
Liberal Democrats | Isobel Davidson | 1,693 | 4.6 | 0.1 | |
Independent | Richard Durkin | 522 | 1.4 | New | |
Majority | 4,139 | 11.3 | 19.2 | ||
Turnout | 36,757 | 59.2 | 5.7 | ||
Registered electors | 62,130 | ||||
SNP hold | Swing | 9.6 | |||
Party | Candidate | Votes | % | ±% | |
---|---|---|---|---|---|
SNP | Kirsty Blackman | 24,793 | 56.4 | 34.2 | |
Labour | Richard Baker | 11,397 | 25.9 | 18.5 | |
Conservative | Sanjoy Sen | 5,304 | 12.1 | 0.3 | |
Liberal Democrats | Euan Davidson | 2,050 | 4.7 | 13.9 | |
TUSC | Tyrinne Rutherford | 206 | 0.5 | New | |
National Front | Christopher Willett | 186 | 0.4 | New | |
Majority | 13,396 | 30.5 | N/A | ||
Turnout | 43,936 | 64.9 | 6.7 | ||
Registered electors | 67,745 | ||||
SNP gain from Labour | Swing | 26.4 | |||
Party | Candidate | Votes | % | ±% | |
---|---|---|---|---|---|
Labour | Frank Doran | 16,746 | 44.4 | 1.9 | |
SNP | Joanna Strathdee | 8,385 | 22.2 | 0.1 | |
Liberal Democrats | Kristian Chapman | 7,001 | 18.6 | 5.3 | |
Conservative | Stewart Whyte | 4,666 | 12.4 | 3.0 | |
BNP | Roy Jones | 635 | 1.7 | New | |
Scottish Socialist | Ewan Robertson | 268 | 0.7 | 1.2 | |
Majority | 8,361 | 22.2 | 3.6 | ||
Turnout | 37,701 | 58.2 | 2.5 | ||
Registered electors | 64,808 | ||||
Labour hold | Swing | 1.0 | |||
Party | Candidate | Votes | % | ±% | |
---|---|---|---|---|---|
Labour | Frank Doran | 15,557 | 42.5 | 6.8 | |
Liberal Democrats | Steve Delaney | 8,762 | 23.9 | 11.7 | |
SNP | Kevin Stewart | 8,168 | 22.3 | 3.3 | |
Conservative | David Anderson | 3,456 | 9.4 | 1.1 | |
Scottish Socialist | John Connon | 691 | 1.9 | 0.5 | |
Majority | 6,795 | 18.6 | 4.0 | ||
Turnout | 36,634 | 55.7 | 1.7 | ||
Registered electors | 65,714 | ||||
Labour hold | Swing | 9.3 | |||
Party | Candidate | Votes | % | ±% | |
---|---|---|---|---|---|
Labour | Malcolm Savidge | 13,157 | 43.3 | 4.6 | |
SNP | Alasdair Allan | 8,708 | 28.7 | 6.9 | |
Liberal Democrats | Jim Donaldson | 4,991 | 16.4 | 2.3 | |
Conservative | Richard Cowling | 3,047 | 10.0 | 5.0 | |
Scottish Socialist | Shona Foreman | 454 | 1.5 | New | |
Majority | 4,449 | 14.6 | 11.5 | ||
Turnout | 30,357 | 57.4 | 13.3 | ||
Registered electors | 52,876 | ||||
Labour hold | Swing | 5.7 | |||
Party | Candidate | Votes | % | ±% | |
---|---|---|---|---|---|
Labour | Malcolm Savidge | 18,839 | 47.9 | 12.8 | |
SNP | Brian Adam | 8,379 | 21.8 | 0.7 | |
Conservative | James Gifford | 5,763 | 15.0 | 3.6 | |
Liberal Democrats | Mike Rumbles | 5,421 | 14.1 | 9.7 | |
Referendum | Alasdair McKenzie | 463 | 1.2 | New | |
Majority | 10,010 | 26.1 | 3.0 | ||
Turnout | 38,865 | 70.7 | 3.8 | ||
Registered electors | 54,895 | ||||
Labour hold | Swing | 1.0 | |||
Party | Candidate | Votes | % | ±% | |
---|---|---|---|---|---|
Labour | Robert Hughes | 18,845 | 47.0 | 7.7 | |
SNP | James McGugan | 9,608 | 24.0 | 10.8 | |
Conservative | Paul S. Cook | 6,836 | 17.1 | 2.8 | |
Liberal Democrats | Martin Ford | 4,772 | 11.9 | 5.9 | |
Majority | 9,237 | 23.1 | 13.8 | ||
Turnout | 40,061 | 66.9 | 3.0 | ||
Registered electors | 60,217 | ||||
Labour hold | Swing | 9.2 | |||
Party | Candidate | Votes | % | ±% | |
---|---|---|---|---|---|
Labour | Robert Hughes | 24,145 | 54.7 | 7.7 | |
SDP | Robert Smith | 7,867 | 17.8 | 6.9 | |
Conservative | Gae Scanlan | 6,330 | 14.3 | 3.8 | |
SNP | Philip Greenhorn | 5,827 | 13.2 | 3.9 | |
Majority | 16,278 | 36.9 | 14.6 | ||
Turnout | 44,169 | 69.9 | 4.9 | ||
Registered electors | 63,214 | ||||
Labour hold | Swing | 1.0 | |||
Party | Candidate | Votes | % | ±% | |
---|---|---|---|---|---|
Labour | Robert Hughes | 19,262 | 47.0 | 9.9 | |
SDP | Colin Deans | 10,118 | 24.7 | 11.1 | |
Conservative | Gae Scanlan | 7,426 | 18.1 | 0.8 | |
SNP | James McGugan | 3,790 | 9.3 | 2.9 | |
Ecology | Margaret Harty | 67 | 0.9 | New | |
Majority | 9,144 | 22.3 | 20.1 | ||
Turnout | 40,663 | 65.0 | 4.7 | ||
Registered electors | 63,049 | ||||
Labour hold | Swing | 1.0 | |||
Party | Candidate | Votes | % | ±% | |
---|---|---|---|---|---|
Labour | Robert Hughes | 26,771 | 59.3 | 8.4 | |
Conservative | Gordon Cassie Adams | 7,657 | 17.0 | 5.7 | |
SNP | Maureen Watt | 5,796 | 12.9 | 16.8 | |
Liberal | Lindsay Jane McMillan | 4,887 | 10.8 | 2.7 | |
Majority | 19,114 | 42.4 | 21.2 | ||
Turnout | 45,111 | 69.7 | ~ | ||
Registered electors | 64,747 | ||||
Labour hold | Swing | ||||
Party | Candidate | Votes | % | ±% | |
---|---|---|---|---|---|
Labour | Robert Hughes | 23,130 | 50.9 | 3.2 | |
SNP | James Andrew McGugan | 13,509 | 29.7 | 6.4 | |
Conservative | Peter Fraser | 5,125 | 11.3 | 5.4 | |
Liberal | Forbes McCallum | 3,700 | 8.1 | 4.2 | |
Majority | 9,621 | 21.2 | 3.2 | ||
Turnout | 45,464 | 69.7 | 5.9 | ||
Registered electors | 65,230 | ||||
Labour hold | Swing | ||||
Party | Candidate | Votes | % | ±% | |
---|---|---|---|---|---|
Labour | Robert Hughes | 23,193 | 47.7 | 14.4 | |
SNP | James Andrew McGugan | 11,337 | 23.3 | 14.9 | |
Conservative | G. Dunnett | 8,115 | 16.7 | 5.3 | |
Liberal | Forbes McCallum | 6,001 | 12.3 | 5.9 | |
Majority | 11,856 | 24.4 | 15.7 | ||
Turnout | 48,646 | 75.6 | 5.8 | ||
Registered electors | 64,349 | ||||
Labour hold | Swing | ||||
Party | Candidate | Votes | % | ±% | |
---|---|---|---|---|---|
Labour | Robert Hughes | 27,707 | 62.1 | 5.5 | |
Conservative | Dennis J. Williams | 9,807 | 22.0 | 1.4 | |
SNP | John McKenna | 3,756 | 8.4 | New | |
Liberal | Forbes McCallum | 2,835 | 6.4 | 3.8 | |
Communist | Andrew Ingram | 521 | 1.2 | 0.5 | |
Majority | 17,900 | 40.1 | 6.9 | ||
Turnout | 44,626 | 69.8 | 2.3 | ||
Registered electors | 63,981 | ||||
Labour hold | Swing | ||||
Party | Candidate | Votes | % | ±% | |
---|---|---|---|---|---|
Labour | Hector Hughes | 28,799 | 67.6 | 1.4 | |
Conservative | Marcus Humphrey | 8,768 | 20.6 | 10.5 | |
Liberal | Doreen W. MacPherson | 4,350 | 10.2 | New | |
Communist | Margaret Rose | 719 | 1.7 | New | |
Majority | 20,031 | 47.0 | 9.2 | ||
Turnout | 42,636 | 72.1 | 2.7 | ||
Registered electors | 59,157 | ||||
Labour hold | Swing | ||||
Party | Candidate | Votes | % | ±% | |
---|---|---|---|---|---|
Labour | Hector Hughes | 31,844 | 68.9 | 4.5 | |
Unionist | John Mclnnes | 14,366 | 31.1 | 1.4 | |
Majority | 17,478 | 37.8 | 3.1 | ||
Turnout | 46,210 | 74.8 | 1.9 | ||
Registered electors | 61,776 | ||||
Labour hold | Swing | ||||
Party | Candidate | Votes | % | ±% | |
---|---|---|---|---|---|
Labour | Hector Hughes | 32,793 | 64.4 | 2.6 | |
Unionist | Jack Stewart-Clark | 15,137 | 29.7 | 3.3 | |
SNP | Sandy Milne | 2,964 | 5.8 | New | |
Majority | 17,656 | 34.7 | 0.8 | ||
Turnout | 50,894 | 76.7 | 2.1 | ||
Registered electors | 66,351 | ||||
Labour hold | Swing | ||||
Party | Candidate | Votes | % | ±% | |
---|---|---|---|---|---|
Labour | Hector Hughes | 33,153 | 67.0 | 2.3 | |
Unionist | Charles A. Malden | 16,357 | 33.0 | 2.3 | |
Majority | 16,796 | 33.9 | 4.5 | ||
Turnout | 49,510 | 74.6 | 8.3 | ||
Registered electors | 66,385 | ||||
Labour hold | Swing | ||||
Party | Candidate | Votes | % | ±% | |
---|---|---|---|---|---|
Labour | Hector Hughes | 33,711 | 64.7 | 4.2 | |
Unionist | Frank Magee | 18,365 | 35.3 | 5.2 | |
Majority | 15,346 | 29.5 | 0.9 | ||
Turnout | 52,076 | 82.9 | ~ | ||
Registered electors | 62,817 | ||||
Labour hold | Swing | ||||
Party | Candidate | Votes | % | ±% | |
---|---|---|---|---|---|
Labour | Hector Hughes | 31,594 | 60.5 | 9.2 | |
Unionist | Archibald Tennant | 15,705 | 30.1 | 5.0 | |
Liberal | John Gray Wilson | 3,574 | 6.8 | New | |
Communist | Bob Cooney [36] | 1,391 | 2.7 | New | |
Majority | 15,889 | 30.4 | 14.2 | ||
Turnout | 50,873 | 82.9 | 15.4 | ||
Registered electors | 57,340 | ||||
Labour hold | Swing | ||||
Party | Candidate | Votes | % | ±% | |
---|---|---|---|---|---|
Labour | Hector Hughes | 26,753 | 69.7 | 21.0 | |
Unionist | Lady Grant of Monymusk [37] | 9,623 | 25.1 | 15.1 | |
SNP | Austin William Walker | 2,021 | 5.3 | New | |
Majority | 17,130 | 44.6 | 35.1 | ||
Turnout | 38,397 | 67.5 | 1.6 | ||
Registered electors | 56,904 | ||||
Labour hold | Swing | ||||
Party | Candidate | Votes | % | ±% | |
---|---|---|---|---|---|
Labour | George Garro-Jones | 16,952 | 48.7 | 24.2 | |
Unionist | John George Burnett | 13,990 | 40.2 | 24.1 | |
Ind. Labour Party | Arthur Fraser Macintosh | 3,871 | 11.1 | New | |
Majority | 2,962 | 8.5 | 31.5 | ||
Turnout | 34,813 | 65.9 | 7.5 | ||
Registered electors | 52,858 | ||||
Labour gain from Unionist | Swing | ||||
Party | Candidate | Votes | % | ±% | |
---|---|---|---|---|---|
Unionist | John George Burnett | 22,931 | 64.3 | New | |
Labour | William Wedgwood Benn | 8,753 | 24.5 | 36.3 | |
Communist | Helen Crawfurd | 3,980 | 11.2 | 5.4 | |
Majority | 14,178 | 39.8 | 12.4 | ||
Turnout | 35,664 | 73.4 | 10.9 | ||
Unionist gain from Labour | Swing | ||||
Party | Candidate | Votes | % | ±% | |
---|---|---|---|---|---|
Labour | William Wedgwood Benn | 17,826 | 60.8 | 0.02 | |
Liberal | Reginald Berkeley | 9,799 | 33.4 | N/A | |
Communist | Aitken Ferguson | 1,686 | 5.8 | N/A | |
Majority | 8,027 | 27.4 | 5.8 | ||
Turnout | 29,311 | 62.5 | 1.9 | ||
Registered electors | 46,934 | ||||
Labour hold | Swing | N/A | |||
Party | Candidate | Votes | % | ±% | |
---|---|---|---|---|---|
Labour | William Wedgwood Benn | 10,646 | 52.5 | 8.3 | |
Unionist | Laura Sandeman | 4,696 | 23.1 | 16.1 | |
Communist | Aitken Ferguson | 2,618 | 12.9 | New | |
Liberal | James Rankin Rutherford | 2,337 | 11.5 | New | |
Majority | 5,950 | 29.4 | 7.8 | ||
Turnout | 20,297 | 56.8 | 7.6 | ||
Registered electors | 35,738 | ||||
Labour hold | Swing | 3.9 | |||
Party | Candidate | Votes | % | ±% | |
---|---|---|---|---|---|
Labour | Frank Rose | 13,249 | 60.8 | 10.2 | |
Unionist | Laura Sandeman | 8,545 | 39.2 | 12.5 | |
Majority | 4,704 | 21.6 | 2.3 | ||
Turnout | 21,794 | 64.4 | 11.4 | ||
Registered electors | 33,826 | ||||
Labour hold | Swing | 1.2 | |||
Party | Candidate | Votes | % | ±% | |
---|---|---|---|---|---|
Labour | Frank Rose | 9,138 | 50.6 | 5.1 | |
Unionist | William Forbes Lumsden | 4,820 | 26.7 | New | |
Liberal | William Mackenzie Cameron | 4,099 | 22.7 | 12.0 | |
Majority | 4,318 | 23.9 | 1.8 | ||
Turnout | 18,057 | 53.0 | 3.9 | ||
Registered electors | 34,098 | ||||
Labour hold | Swing | 2.9 | |||
Party | Candidate | Votes | % | ±% | |
---|---|---|---|---|---|
Labour | Frank Rose | 10,958 | 55.7 | 4.8 | |
National Liberal | William Mackenzie Cameron | 6,615 | 33.6 | New | |
Liberal | James Johnstone | 2,113 | 10.7 | 38.4 | |
Majority | 4,343 | 22.1 | 20.3 | ||
Turnout | 19,686 | 56.9 | 20.5 | ||
Registered electors | 34,603 | ||||
Labour gain from Independent Labour | Swing | N/A | |||
Party | Candidate | Votes | % | ±% | |
---|---|---|---|---|---|
Independent Labour | Frank Rose | 6,128 | 50.9 | New | |
Liberal | Duncan Pirie * | 5,918 | 49.1 | 13.6 | |
Majority | 210 | 1.8 | 23.6 | ||
Turnout | 12,046 | 36.4 | 29.6 | ||
Registered electors | 33,072 | ||||
Independent Labour gain from Liberal | Swing | N/A | |||
*Pirie was endorsed by the Coalition Government but refused to give it his support. [46]
Party | Candidate | Votes | % | ±% | |
---|---|---|---|---|---|
Liberal | Duncan Pirie | 4,282 | 62.7 | 8.7 | |
Liberal Unionist | Robert Scott-Brown | 2,546 | 37.3 | 8.2 | |
Majority | 1,736 | 25.4 | 0.5 | ||
Turnout | 6,828 | 66.0 | 11.0 | ||
Registered electors | 10,341 | ||||
Liberal hold | Swing | 0.3 | |||
Party | Candidate | Votes | % | ±% | |
---|---|---|---|---|---|
Liberal | Duncan Pirie | 4,297 | 54.0 | 8.8 | |
Liberal Unionist | Robert Scott-Brown | 2,314 | 29.1 | 17.0 | |
Social Democratic Federation | Tom Kennedy | 1,344 | 16.9 | 8.2 | |
Majority | 1,983 | 24.9 | 12.8 | ||
Turnout | 7,955 | 77.0 | 3.7 | ||
Registered electors | 10,331 | ||||
Liberal hold | Swing | 12.9 | |||
Party | Candidate | Votes | % | ±% | |
---|---|---|---|---|---|
Liberal | Duncan Pirie | 4,852 | 62.8 | 2.5 | |
Social Democratic Federation | Tom Kennedy | 1,935 | 25.1 | New | |
Conservative | Maltman Barrie | 931 | 12.1 | 22.6 | |
Majority | 2,917 | 37.7 | 7.1 | ||
Turnout | 7,718 | 73.3 | 8.7 | ||
Registered electors | 10,531 | ||||
Liberal hold | Swing | 10.1 | |||
Party | Candidate | Votes | % | ±% | |
---|---|---|---|---|---|
Liberal | Duncan Pirie | 4,238 | 65.3 | 21.9 | |
Conservative | Robert Williams | 2,251 | 34.7 | New | |
Majority | 1,987 | 30.6 | 43.8 | ||
Turnout | 6,489 | 64.6 | 13.5 | ||
Registered electors | 10,047 | ||||
Liberal hold | Swing | ||||
Party | Candidate | Votes | % | ±% | |
---|---|---|---|---|---|
Liberal | Duncan Pirie | 2,909 | 54.0 | 33.2 | |
Ind. Labour Party | Tom Mann | 2,479 | 46.0 | New | |
Majority | 430 | 8.0 | 66.4 | ||
Turnout | 5,388 | 57.1 | 6.0 | ||
Registered electors | 9,434 | ||||
Liberal hold | Swing | N/A | |||
Party | Candidate | Votes | % | ±% | |
---|---|---|---|---|---|
Liberal | William Hunter | 4,156 | 87.2 | 3.5 | |
Independent Labour | John Lincoln Mahon | 608 | 12.8 | New | |
Majority | 3,548 | 74.4 | 7.0 | ||
Turnout | 4,764 | 51.1 | 9.3 | ||
Registered electors | 9,318 | ||||
Liberal hold | Swing | N/A | |||
Party | Candidate | Votes | % | ±% | |
---|---|---|---|---|---|
Liberal | William Hunter | 4,462 | 83.7 | N/A | |
Liberal Unionist | Bremner Patrick Lee | 870 | 16.3 | New | |
Majority | 3,592 | 67.4 | N/A | ||
Turnout | 5,332 | 60.4 | N/A | ||
Registered electors | 8,832 | ||||
Liberal hold | Swing | N/A | |||
Party | Candidate | Votes | % | ±% | |
---|---|---|---|---|---|
Liberal | William Hunter | Unopposed | |||
Liberal hold | |||||
Party | Candidate | Votes | % | ±% | |
---|---|---|---|---|---|
Liberal | William Hunter | 4,794 | 81.8 | N/A | |
Conservative | Benjamin Scott Foster McGeagh | 894 | 15.2 | N/A | |
Independent Liberal | James Wallace Thom [54] | 177 | 3.0 | N/A | |
Majority | 3,900 | 66.6 | N/A | ||
Turnout | 5,865 | 71.0 | N/A | ||
Registered electors | 8,256 | ||||
Liberal win (new seat) |
Edinburgh South is a constituency of the House of Commons of the UK Parliament created in 1885. The constituency has been held by Scottish Labour since 1987, being represented by Ian Murray since 2010. Murray was the only Labour MP in Scotland to retain his seat at the 2015 and 2019 general elections and this is one of only three seats never held by the Scottish National Party (SNP).
Edinburgh West is a burgh constituency of the House of Commons of the Parliament of the United Kingdom, first contested at the 1885 general election.
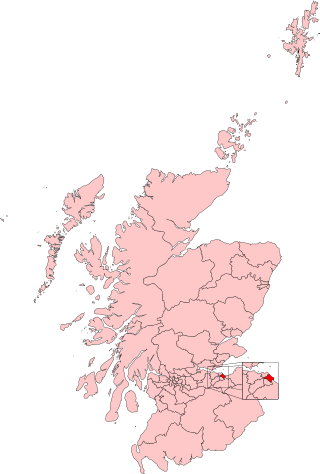
Edinburgh East is a burgh constituency of the House of Commons of the Parliament of the United Kingdom. It elects one Member of Parliament (MP) by the first past the post system of election.
Glasgow Central is a constituency of the House of Commons of the Parliament of the United Kingdom. In its current form, the constituency was first used at the 2005 general election, but there was also a Glasgow Central constituency that existed from 1885 to 1997. The sitting MP is Alison Thewliss of the Scottish National Party (SNP), who was first elected in May 2015. This constituency was also the seat of the former Conservative Prime Minister Bonar Law, who was the shortest-serving UK Prime Minister of the twentieth century.
Aberdeen South is a burgh constituency of the House of Commons of the Parliament of the United Kingdom and it elects one Member of Parliament (MP) by the first-past-the-post system of election.
West Aberdeenshire and Kincardine is a county constituency of the House of Commons of the Parliament of the United Kingdom of Great Britain and Northern Ireland (Westminster), which elects one Member of Parliament (MP) by the first past the post system of election. It was first used in the 1997 general election, but has undergone boundary changes since that date. West Aberdeenshire and Kincardine was re-created as a parliamentary constituency in 1997, having previously existed as Kincardine and Western Aberdeenshire from 1918 to 1950.
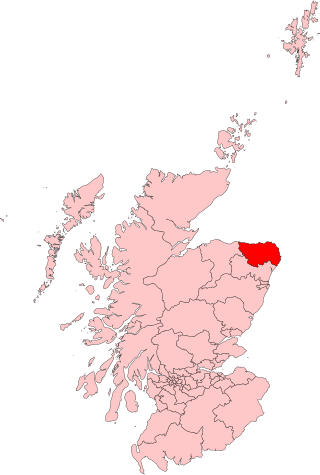
Banff and Buchan is a constituency of the House of Commons, located in the north-east of Scotland within the Aberdeenshire council area. It elects one Member of Parliament at least once every five years using the first-past-the-post system of voting.
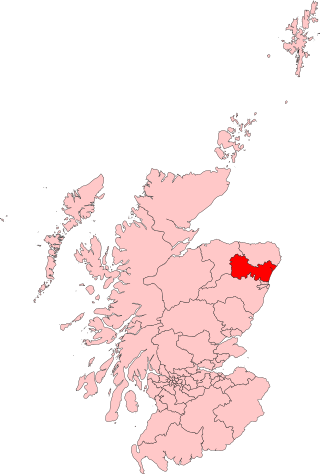
Gordon is a county constituency of the House of Commons of the Parliament of the United Kingdom (Westminster), which elects one member of Parliament (MP) by the first past the post system of election. The constituency was first contested at the 1983 UK general election; but has undergone boundary changes since then.
Edinburgh Central was a burgh constituency of the House of Commons of the Parliament of the United Kingdom from 1885 to 2005. It elected one Member of Parliament (MP) by the first past the post system of election.
Glasgow Govan was a parliamentary constituency in the Govan district of Glasgow. It was represented in the House of Commons of the Parliament of the United Kingdom for 120 years; from 1885 until 2005, returning one Member of Parliament (MP) elected by the first-past-the-post system.
Glasgow Shettleston was a burgh constituency represented in the House of Commons of the Parliament of the United Kingdom from 1918 until 2005. The Shettleston area's representation is now covered by Glasgow Central and Glasgow East.
Aberdeen and Kincardine Central, also known as Central Aberdeenshire, was a county constituency of the House of Commons of the Parliament of the United Kingdom from 1918 until 1950. It elected one Member of Parliament (MP) by the first past the post system of election.
EastAberdeenshire was a Scottish county constituency of the House of Commons of the Parliament of the United Kingdom from 1868 to 1918 and from 1950 to 1983. It elected one Member of Parliament (MP) by the first past the post system of election.
WestAberdeenshire was a Scottish county constituency of the House of Commons of the Parliament of the United Kingdom from 1868 to 1918 and from 1950 to 1983. It elected one Member of Parliament (MP) by the first past the post system of election.
Aberdeen Central is a burgh constituency of the Scottish Parliament (Holyrood) covering part of the Aberdeen City council area. It elects one Member of the Scottish Parliament (MSP) by the first past the post method of election. It is one of the ten constituencies in the North East Scotland electoral region, which elects seven additional members, in addition to ten constituency MSPs, to produce a form of proportional representation for the region as a whole.
The Politics of Aberdeen, Scotland have changed significantly in recent years. In 1996, under the Local Government etc. (Scotland) Act 1994, Grampian Regional Council and Aberdeen District Council were dissolved, creating the new unitary Aberdeen City Council to represent the city's council area.
Aberdeen Donside is a constituency of the Scottish Parliament (Holyrood) covering part of the Aberdeen City council area. It elects one Member of the Scottish Parliament (MSP) by the first past the post method of election. It is one of ten constituencies in the North East Scotland electoral region, which elects seven additional members, in addition to the ten constituency MSPs, to produce a form of proportional representation for the region as a whole.
Angus North and Mearns is a constituency of the Scottish Parliament (Holyrood) covering parts of the council areas of Angus and Aberdeenshire. It elects one Member of the Scottish Parliament (MSP) by the first past the post method of election. It is one of ten constituencies in the North East Scotland electoral region, which elects seven additional members, in addition to the ten constituency MSPs, to produce a form of proportional representation for the region as a whole.
Aberdeen South and North Kincardine is a constituency of the Scottish Parliament (Holyrood) covering part of the Aberdeen City council area and Aberdeenshire. It elects one Member of the Scottish Parliament (MSP) by the first past the post method of election. It is one of ten constituencies in the North East Scotland electoral region, which elects seven additional members, in addition to the ten constituency MSPs, to produce a form of proportional representation for the region as a whole.
Aberdeen and Kincardine East was a county constituency of the House of Commons of the Parliament of the United Kingdom from 1918 to 1950. The constituency elected one Member of Parliament (MP) by the first past the post system of election.