Orkney and Shetland | |
---|---|
County constituency for the House of Commons | |
Subdivisions of Scotland | Orkney and Shetland |
Electorate | 33,229 [1] |
Major settlements | Kirkwall, Lerwick |
Current constituency | |
Created | 1708 |
Member of Parliament | Alistair Carmichael (Liberal Democrats) |
Seats | One |
Created from | Orkney and Shetland |
Orkney and Shetland is a constituency of the House of Commons of the Parliament of the United Kingdom. It elects one Member of Parliament (MP) by the first past the post system of election. In the Scottish Parliament, Orkney and Shetland are separate constituencies. The constituency was historically known as Orkney and Zetland (an alternative name for Shetland).
In the 2014 Scottish independence referendum, 65.4% of the constituency's electors voted for Scotland to stay part of the United Kingdom. [2]
The British parliamentary constituency was created in 1708 following the Acts of Union, 1707 and replaced the former Parliament of Scotland shire constituency of Orkney & Zetland.
The constituency is made up of the two northernmost island groups of Scotland, Orkney and Shetland. A constituency of this name has existed continuously since 1708. However, before 1918 the town of Kirkwall (the capital of Orkney) formed part of the Northern Burghs constituency. It is the most northerly of the 650 UK Parliament constituencies.
The constituency is one of five "protected constituencies", the others being Na h-Eileanan an Iar, two on the Isle of Wight, and Ynys Môn, defined exclusively by geography rather than by size of electorate. [3] The constituency contains the areas of the Orkney Islands Council and the Shetland Islands Council. Before 2011 the constituency had been unique in having its boundaries protected by legislation. [4]
The constituency has the second smallest electorate of any UK parliamentary constituency, after Na h-Eileanan an Iar. [1]
The constituency has elected one Member of Parliament (MP) by the first past the post since its creation in 1707. [5] [6] [7] [8] [9] The constituency has remained largely unchanged since its creation. The town of Kirkwall was added in 1918, having previously been part of Wick Burghs.
The constituency has elected only Liberal and Liberal Democrat MPs since 1950; the longest run of any British parliamentary constituency. [10] [11] At each general election from 1955 until 1979, in 1987, 2010 and again in 2017 it was the safest Liberal Democrat seat in the UK. At the 2015 general election, it was the only seat in Scotland to return a Liberal Democrat MP. Two years later, in 2017, the Lib Dems gained three more seats in Scotland; increasing their Scottish seat tally to 4.
Party | Candidate | Votes | % | ±% | |
---|---|---|---|---|---|
Scottish Green | Alex Armitage [15] | ||||
Liberal Democrats | Alistair Carmichael [16] | ||||
Scottish National | Robert Leslie [17] | ||||
Conservative | Shane Painter [18] | ||||
Labour | Conor Savage | ||||
Majority | |||||
Turnout | |||||
Swing | |||||
Party | Candidate | Votes | % | ±% | |
---|---|---|---|---|---|
Liberal Democrats | Alistair Carmichael | 10,381 | 44.8 | −3.8 | |
Scottish National | Robert Leslie | 7,874 | 34.0 | +5.0 | |
Conservative | Jenny Fairbairn | 2,287 | 9.9 | +1.2 | |
Labour | Coilla Drake | 1,550 | 6.7 | −4.7 | |
Brexit Party | Robert Smith | 900 | 3.9 | New | |
Independent | David Barnard | 168 | 0.7 | New | |
Majority | 2,507 | 10.8 | −8.8 | ||
Turnout | 23,160 | 67.7 | −0.4 | ||
Liberal Democrats hold | Swing | −4.4 | |||
Party | Candidate | Votes | % | ±% | |
---|---|---|---|---|---|
Liberal Democrats | Alistair Carmichael | 11,312 | 48.6 | +7.2 | |
Scottish National | Miriam Brett | 6,749 | 29.0 | −8.8 | |
Labour | Robina Barton | 2,664 | 11.4 | +4.3 | |
Conservative | Jamie Halcro Johnston | 2,024 | 8.7 | −0.2 | |
UKIP | Robert Smith | 283 | 1.2 | −3.6 | |
Independent | Stuart Hill | 245 | 1.1 | New | |
Majority | 4,563 | 19.6 | +16.0 | ||
Turnout | 23,277 | 68.1 | +2.3 | ||
Liberal Democrats hold | Swing | +8.0 | |||
Party | Candidate | Votes | % | ±% | |
---|---|---|---|---|---|
Liberal Democrats | Alistair Carmichael [25] | 9,407 | 41.4 | −20.6 | |
Scottish National | Danus Skene | 8,590 | 37.8 | +27.2 | |
Conservative | Donald Cameron [26] | 2,025 | 8.9 | −1.6 | |
Labour | Gerry McGarvey | 1,624 | 7.1 | −3.6 | |
UKIP | Robert Smith [27] | 1,082 | 4.8 | −1.5 | |
Majority | 817 | 3.6 | −47.7 | ||
Turnout | 22,728 | 65.8 | +7.3 | ||
Liberal Democrats hold | Swing | −23.9 | |||
Party | Candidate | Votes | % | ±% | |
---|---|---|---|---|---|
Liberal Democrats | Alistair Carmichael | 11,989 | 62.0 | +10.5 | |
Labour | Mark Cooper | 2,061 | 10.7 | −3.5 | |
Scottish National | John Mowat | 2,042 | 10.6 | +0.3 | |
Conservative | Frank Nairn | 2,032 | 10.5 | −2.8 | |
UKIP | Robert Smith | 1,222 | 6.3 | +3.9 | |
Majority | 9,928 | 51.3 | +14.0 | ||
Turnout | 19,346 | 58.5 | +4.8 | ||
Liberal Democrats hold | Swing | +7.0 | |||
Party | Candidate | Votes | % | ±% | |
---|---|---|---|---|---|
Liberal Democrats | Alistair Carmichael | 9,138 | 51.5 | +10.2 | |
Labour | Richard Meade | 2,511 | 14.2 | −6.4 | |
Conservative | Frank Nairn | 2,357 | 13.3 | −5.4 | |
Scottish National | John Mowat | 1,833 | 10.3 | −4.5 | |
Scottish Socialist | John Aberdein | 992 | 5.6 | +1.0 | |
UKIP | Scott Dyble | 424 | 2.4 | New | |
Legalise Cannabis | Paul Cruickshank | 311 | 1.8 | New | |
Free Scotland Party | Brian Nugent | 176 | 1.0 | New | |
Majority | 6,627 | 37.3 | +16.6 | ||
Turnout | 17,742 | 53.7 | +1.3 | ||
Liberal Democrats hold | Swing | +8.3 | |||
Party | Candidate | Votes | % | ±% | |
---|---|---|---|---|---|
Liberal Democrats | Alistair Carmichael | 6,919 | 41.3 | −10.7 | |
Labour | Robert Mochrie | 3,444 | 20.6 | +2.3 | |
Conservative | John Firth | 3,121 | 18.7 | +6.5 | |
Scottish National | John Mowat | 2,473 | 14.8 | +2.1 | |
Scottish Socialist | Peter Andrews | 776 | 4.6 | New | |
Majority | 3,475 | 20.7 | −13.0 | ||
Turnout | 16,733 | 52.4 | −11.6 | ||
Liberal Democrats hold | Swing | −13.0 | |||
Party | Candidate | Votes | % | ±% | |
---|---|---|---|---|---|
Liberal Democrats | Jim Wallace | 10,743 | 52.0 | +5.6 | |
Labour | James Paton | 3,775 | 18.3 | −1.5 | |
Scottish National | Willie Ross | 2,624 | 12.7 | +1.5 | |
Conservative | Hope Anderson | 2,527 | 12.2 | −9.8 | |
Referendum | Francis Adamson | 820 | 4.0 | New | |
Natural Law | Christian Wharton | 116 | 0.6 | 0.0 | |
Independent | Arthur Robertson | 60 | 0.3 | New | |
Majority | 6,968 | 33.7 | +10.3 | ||
Turnout | 20,665 | 64.0 | −1.5 | ||
Liberal Democrats hold | Swing | +3.6 | |||
Party | Candidate | Votes | % | ±% | |
---|---|---|---|---|---|
Liberal Democrats | Jim Wallace | 9,575 | 46.4 | +4.7 | |
Conservative | Paul McCormick | 4,542 | 22.0 | −1.3 | |
Labour | John Aberdein | 4,093 | 19.8 | +1.1 | |
Scottish National | Frances McKie | 2,301 | 11.2 | New | |
Natural Law | Christian Wharton | 115 | 0.6 | New | |
Majority | 5,033 | 24.4 | +6.0 | ||
Turnout | 20,626 | 65.5 | −3.2 | ||
Liberal Democrats hold | Swing | +3.0 | |||
Party | Candidate | Votes | % | ±% | |
---|---|---|---|---|---|
Liberal | Jim Wallace | 8,881 | 41.7 | −4.2 | |
Conservative | Richard Jenkins | 4,959 | 23.3 | −2.3 | |
Labour | John Aberdein | 3,995 | 18.7 | +5.6 | |
Orkney and Shetland Movement | John Goodlad | 3,095 | 14.5 | New | |
Green | Grierson Collister | 389 | 1.8 | New | |
Majority | 3,922 | 18.4 | −1.9 | ||
Turnout | 21,319 | 68.7 | −0.1 | ||
Liberal hold | Swing | ||||
Party | Candidate | Votes | % | ±% | |
---|---|---|---|---|---|
Liberal | Jim Wallace | 9,374 | 45.9 | −10.5 | |
Conservative | David Myles | 5,224 | 25.6 | +4.3 | |
Scottish National | Winifred Ewing | 3,147 | 15.4 | +10.6 | |
Labour | Robina Goodlad | 2,665 | 13.1 | −4.3 | |
Majority | 4,150 | 20.3 | −14.8 | ||
Turnout | 20,410 | 67.8 | +0.6 | ||
Liberal hold | Swing | ||||
Party | Candidate | Votes | % | ±% | |
---|---|---|---|---|---|
Liberal | Jo Grimond | 10,950 | 56.4 | +0.2 | |
Conservative | Charles Donaldson | 4,140 | 21.3 | +7.1 | |
Labour | Robina Goodlad | 3,385 | 17.4 | +5.0 | |
Scottish National | Michael Spens | 935 | 4.8 | −12.4 | |
Majority | 6,810 | 35.1 | −3.9 | ||
Turnout | 19,410 | 67.2 | +0.4 | ||
Liberal hold | Swing | ||||
Party | Candidate | Votes | % | ±% | |
---|---|---|---|---|---|
Liberal | Jo Grimond | 9,877 | 56.2 | −5.8 | |
Scottish National | Howard Firth | 3,025 | 17.2 | New | |
Conservative | Raymond M. Fraser | 2,495 | 14.2 | −8.4 | |
Labour | Jonathan W. G. Wills | 2,175 | 12.4 | −3.1 | |
Majority | 6,852 | 39.0 | -0.4 | ||
Turnout | 17,572 | 66.8 | -4.3 | ||
Liberal hold | Swing | ||||
Party | Candidate | Votes | % | ±% | |
---|---|---|---|---|---|
Liberal | Jo Grimond | 11,491 | 62.0 | +15.0 | |
Conservative | John L. Firth | 4,186 | 22.6 | −9.3 | |
Labour | Jonathan W. G. Wills | 2,865 | 15.5 | −5.6 | |
Majority | 7,305 | 39.4 | +24.3 | ||
Turnout | 18,542 | 71.1 | +5.5 | ||
Liberal hold | Swing | ||||
Party | Candidate | Votes | % | ±% | |
---|---|---|---|---|---|
Liberal | Jo Grimond | 7,896 | 47.0 | −12.1 | |
Conservative | John L. Firth | 5,364 | 31.9 | +9.6 | |
Labour | William Macpherson Reid | 3,552 | 21.1 | +2.5 | |
Majority | 2,532 | 15.1 | -21.7 | ||
Turnout | 16,812 | 65.6 | +0.4 | ||
Liberal hold | Swing | ||||
Party | Candidate | Votes | % | ±% | |
---|---|---|---|---|---|
Liberal | Jo Grimond | 9,605 | 59.1 | −3.5 | |
Unionist | John L. Firth | 3,630 | 22.3 | +2.3 | |
Labour | Hugh Lynch | 3,021 | 18.6 | +1.2 | |
Majority | 5,975 | 36.8 | −5.8 | ||
Turnout | 16,256 | 65.2 | −7.5 | ||
Liberal hold | Swing | ||||
Party | Candidate | Votes | % | ±% | |
---|---|---|---|---|---|
Liberal | Jo Grimond | 11,604 | 62.6 | −1.5 | |
Unionist | John L. Firth | 3,704 | 20.0 | +1.5 | |
Labour | Ian MacInnes | 3,232 | 17.4 | ±0.0 | |
Majority | 7,900 | 42.6 | -3.0 | ||
Turnout | 18,540 | 72.7 | +1.4 | ||
Liberal hold | Swing | ||||
Party | Candidate | Votes | % | ±% | |
---|---|---|---|---|---|
Liberal | Jo Grimond | 12,099 | 64.1 | +0.3 | |
Unionist | Robert Hunter Wingate Bruce | 3,487 | 18.5 | −1.9 | |
Labour | Robert S. McGowan | 3,275 | 17.4 | +1.6 | |
Majority | 8,612 | 45.6 | +2.2 | ||
Turnout | 18,861 | 71.3 | +5.2 | ||
Liberal hold | Swing | ||||
Party | Candidate | Votes | % | ±% | |
---|---|---|---|---|---|
Liberal | Jo Grimond | 11,753 | 63.8 | +6.3 | |
Unionist | John W. Eunson | 3,760 | 20.4 | -6.2 | |
Labour | Edgar Ramsay | 2,914 | 15.8 | -0.4 | |
Majority | 7,993 | 43.4 | +12.1 | ||
Turnout | 18,427 | 66.1 | -2.9 | ||
Liberal hold | Swing | ||||
Party | Candidate | Votes | % | ±% | |
---|---|---|---|---|---|
Liberal | Jo Grimond | 11,745 | 57.5 | +10.7 | |
Unionist | Archibald Tennant | 5,354 | 26.2 | -5.7 | |
Labour | Magnus A. Fairnie | 3,335 | 16.2 | -3.1 | |
Majority | 6,391 | 31.3 | +16.4 | ||
Turnout | 20,434 | 69.0 | +1.4 | ||
Liberal hold | Swing | ||||
Party | Candidate | Votes | % | ±% | |
---|---|---|---|---|---|
Liberal | Jo Grimond | 9,237 | 46.8 | +12.6 | |
Unionist | Basil Neven-Spence | 6,281 | 31.9 | -4.1 | |
Labour | Harald Leslie | 3,335 | 21.3 | -8.5 | |
Majority | 2,956 | 14.9 | N/A | ||
Turnout | 19,716 | 67.7 | +12.2 | ||
Liberal gain from Unionist | Swing | ||||
Party | Candidate | Votes | % | ±% | |
---|---|---|---|---|---|
Unionist | Basil Neven-Spence | 6,304 | 36.0 | -21.6 | |
Liberal | Jo Grimond | 5,975 | 34.2 | -8.2 | |
Labour | Prophet Smith | 5,208 | 29.8 | New | |
Majority | 329 | 1.8 | -13.4 | ||
Turnout | 17,487 | 55.5 | +9.2 | ||
Unionist hold | Swing | ||||
General election 1939–40: Another general election was required to take place before the end of 1940. The political parties had been making preparations for an election to take place and by the Autumn of 1939, the following candidates had been selected;
Party | Candidate | Votes | % | ±% | |
---|---|---|---|---|---|
Unionist | Basil Neven-Spence | 8,406 | 57.6 | New | |
Liberal | Robert Hamilton | 6,180 | 42.4 | N/A | |
Majority | 2,226 | 15.2 | N/A | ||
Turnout | 14,586 | 46.3 | N/A | ||
Unionist gain from Liberal | Swing | ||||
Party | Candidate | Votes | % | ±% | |
---|---|---|---|---|---|
Liberal | Robert Hamilton | Unopposed | N/A | N/A | |
Liberal hold | Swing | N/A | |||
Party | Candidate | Votes | % | ±% | |
---|---|---|---|---|---|
Liberal | Robert Hamilton | 8,256 | 60.4 | N/A | |
Unionist | Basil Neven-Spence | 5,404 | 39.6 | New | |
Majority | 2,852 | 20.8 | N/A | ||
Turnout | 13,660 | 43.1 | N/A | ||
Liberal hold | Swing | ||||
Party | Candidate | Votes | % | ±% | |
---|---|---|---|---|---|
Liberal | Robert Hamilton | Unopposed | N/A | N/A | |
Liberal hold | Swing | N/A | |||
Party | Candidate | Votes | % | ±% | |
---|---|---|---|---|---|
Liberal | Robert Hamilton | 5,129 | 54.3 | +0.8 | |
Unionist | Robert Boothby | 4,318 | 45.7 | New | |
Majority | 811 | 8.6 | +1.6 | ||
Turnout | 9,447 | 39.1 | +1.7 | ||
Liberal hold | Swing | ||||
Party | Candidate | Votes | % | ±% | |
---|---|---|---|---|---|
Liberal | Robert Hamilton | 4,814 | 53.5 | N/A | |
National Liberal | Malcolm Smith | 4,189 | 46.5 | N/A | |
Majority | 625 | 7.0 | N/A | ||
Turnout | 9,003 | 37.4 | N/A | ||
Liberal gain from National Liberal | Swing | ||||
Party | Candidate | Votes | % | ±% | |
---|---|---|---|---|---|
C | Liberal | Malcolm Smith | Unopposed | ||
Liberal hold | |||||
Cindicates candidate endorsed by the coalition government. |
Party | Candidate | Votes | % | ±% | |
---|---|---|---|---|---|
C | Liberal | Cathcart Wason | Unopposed | ||
Liberal hold | |||||
Cindicates candidate endorsed by the coalition government. |
Party | Candidate | Votes | % | ±% | |
---|---|---|---|---|---|
Liberal | Cathcart Wason | Unopposed | |||
Liberal hold | |||||
Party | Candidate | Votes | % | ±% | |
---|---|---|---|---|---|
Liberal | Cathcart Wason | 4,117 | 80.6 | +1.6 | |
Liberal Unionist | Thomas William Hemsley | 994 | 19.4 | -1.6 | |
Majority | 3,123 | 61.2 | +3.2 | ||
Turnout | 5,111 | 71.8 | +8.5 | ||
Liberal hold | Swing | ||||
Party | Candidate | Votes | % | ±% | |
---|---|---|---|---|---|
Liberal | Cathcart Wason | 3,837 | 79.0 | +29.5 | |
Conservative | C. J. Dunlop | 1,021 | 21.0 | New | |
Majority | 2,816 | 58.0 | N/A | ||
Turnout | 4,858 | 63.3 | +8.4 | ||
Registered electors | 7,680 | ||||
Liberal gain from Liberal Unionist | Swing | +29.5 | |||
Party | Candidate | Votes | % | ±% | |
---|---|---|---|---|---|
Independent Liberal | Cathcart Wason | 2,412 | 46.8 | +46.8 | |
Liberal | McKinnon Wood | 2,001 | 38.8 | -10.7 | |
Liberal Unionist | Theodore Vivian Samuel Angier | 740 | 14.4 | -36.1 | |
Majority | 411 | 8.0 | N/A | ||
Turnout | 5,153 | 68.1 | +13.2 | ||
Registered electors | 7,572 | ||||
Independent Liberal gain from Liberal Unionist | Swing | ||||
Party | Candidate | Votes | % | ±% | |
---|---|---|---|---|---|
Liberal Unionist | Cathcart Wason | 2,057 | 50.5 | +10.4 | |
Liberal | Leonard Lyell | 2,017 | 49.5 | -10.4 | |
Majority | 40 | 1.0 | N/A | ||
Turnout | 4,074 | 54.9 | -1.0 | ||
Registered electors | 7,420 | ||||
Liberal Unionist gain from Liberal | Swing | +10.4 | |||
Party | Candidate | Votes | % | ±% | |
---|---|---|---|---|---|
Liberal | Leonard Lyell | 2,361 | 59.9 | -2.0 | |
Liberal Unionist | Ralph Wardlaw MacLeod Fullarton | 1,580 | 40.1 | +2.0 | |
Majority | 781 | 19.8 | -4.0 | ||
Turnout | 3,941 | 55.9 | -4.0 | ||
Registered electors | 7,053 | ||||
Liberal hold | Swing | -2.0 | |||
Party | Candidate | Votes | % | ±% | |
---|---|---|---|---|---|
Liberal | Leonard Lyell | 2,624 | 61.9 | -1.1 | |
Liberal Unionist | William Younger | 1,617 | 38.1 | +1.1 | |
Majority | 1,007 | 23.8 | -2.2 | ||
Turnout | 4,241 | 59.9 | +9.4 | ||
Registered electors | 7,075 | ||||
Liberal hold | Swing | -1.1 | |||
Party | Candidate | Votes | % | ±% | |
---|---|---|---|---|---|
Liberal | Leonard Lyell | 2,353 | 63.0 | -0.3 | |
Liberal Unionist | Henry Hoare [41] | 1,382 | 37.0 | New | |
Majority | 971 | 26.0 | -0.6 | ||
Turnout | 3,735 | 50.5 | -21.1 | ||
Registered electors | 7,394 | ||||
Liberal hold | Swing | -0.3 | |||
Party | Candidate | Votes | % | ±% | |
---|---|---|---|---|---|
Liberal | Leonard Lyell | 3,352 | 63.3 | +2.5 | |
Conservative | Cospatrick Thomas Dundas [42] | 1,940 | 36.7 | -2.5 | |
Majority | 1,412 | 26.6 | +5.0 | ||
Turnout | 5,292 | 71.6 | -14.9 | ||
Registered electors | 7,394 | ||||
Liberal hold | Swing | +2.5 | |||
Party | Candidate | Votes | % | ±% | |
---|---|---|---|---|---|
Liberal | Samuel Laing | 896 | 60.8 | N/A | |
Conservative | George Roy Badenoch [44] | 578 | 39.2 | New | |
Majority | 318 | 21.6 | N/A | ||
Turnout | 1,474 | 86.5 | N/A | ||
Registered electors | 1,704 | ||||
Liberal hold | Swing | N/A | |||
Party | Candidate | Votes | % | ±% | |
---|---|---|---|---|---|
Liberal | Samuel Laing | Unopposed | |||
Registered electors | 1,618 | ||||
Liberal hold | |||||
Party | Candidate | Votes | % | ±% | |
---|---|---|---|---|---|
Liberal | Samuel Laing | 646 | 51.0 | N/A | |
Liberal | Peter Tait [45] | 621 | 49.0 | N/A | |
Majority | 25 | 2.0 | −21.2 | ||
Turnout | 1,267 | 82.4 | +4.3 | ||
Registered electors | 1,537 | ||||
Liberal hold | Swing | N/A | |||
Party | Candidate | Votes | % | ±% | |
---|---|---|---|---|---|
Liberal | Frederick Dundas | 715 | 61.6 | N/A | |
Conservative | Henry Riddell [46] [47] | 446 | 38.4 | New | |
Majority | 269 | 23.2 | N/A | ||
Turnout | 1,161 | 78.1 | N/A | ||
Registered electors | 1,486 | ||||
Liberal hold | Swing | N/A | |||
Party | Candidate | Votes | % | ±% | |
---|---|---|---|---|---|
Liberal | Frederick Dundas | Unopposed | |||
Registered electors | 685 | ||||
Liberal hold | |||||
Party | Candidate | Votes | % | ±% | |
---|---|---|---|---|---|
Liberal | Frederick Dundas | Unopposed | |||
Registered electors | 621 | ||||
Liberal hold | |||||
Party | Candidate | Votes | % | ±% | |
---|---|---|---|---|---|
Whig | Frederick Dundas | Unopposed | |||
Registered electors | 615 | ||||
Whig hold | |||||
Party | Candidate | Votes | % | ±% | |
---|---|---|---|---|---|
Whig | Frederick Dundas | 227 | 53.9 | -46.1 | |
Conservative | John Inglis [48] | 194 | 46.1 | New | |
Majority | 33 | 7.8 | +1.2 | ||
Turnout | 421 | 64.7 | -0.7 | ||
Registered electors | 651 | ||||
Whig hold | Swing | ||||
Party | Candidate | Votes | % | ±% | |
---|---|---|---|---|---|
Whig | Arthur Anderson | 209 | 53.3 | N/A | |
Whig | Frederick Dundas | 183 | 46.7 | N/A | |
Majority | 26 | 6.6 | N/A | ||
Turnout | 392 | 65.4 | N/A | ||
Registered electors | 599 | ||||
Whig hold | Swing | N/A | |||
Party | Candidate | Votes | % | ±% | |
---|---|---|---|---|---|
Whig | Frederick Dundas | Unopposed | |||
Registered electors | 526 | ||||
Whig hold | |||||
Party | Candidate | Votes | % | ||
---|---|---|---|---|---|
Whig | Frederick Dundas | Unopposed | |||
Registered electors | 476 | ||||
Whig gain from Conservative |
Party | Candidate | Votes | % | ±% | |
---|---|---|---|---|---|
Conservative | Thomas Balfour | 114 | 57.6 | +12.3 | |
Whig | George Traill | 84 | 42.4 | −6.1 | |
Majority | 30 | 15.2 | N/A | ||
Turnout | 198 | 66.4 | −11.5 | ||
Registered electors | 298 | ||||
Conservative gain from Whig | Swing | +9.2 | |||
Party | Candidate | Votes | % | ||
---|---|---|---|---|---|
Whig | George Traill | 107 | 50.5 | ||
Tory | Samuel Laing | 96 | 45.3 | ||
Whig | Robert Hunter | 9 | 4.2 | ||
Majority | 11 | 5.2 | |||
Turnout | 212 | 77.9 | |||
Registered electors | 272 | ||||
Whig hold | |||||
Party | Candidate | Votes | % | ||
---|---|---|---|---|---|
Whig | George Traill | Unopposed | |||
Registered electors | 43 | ||||
Whig hold | |||||
Party | Candidate | Votes | % | ||
---|---|---|---|---|---|
Whig | George Traill | Unopposed | |||
Registered electors | 43 | ||||
Whig hold | |||||
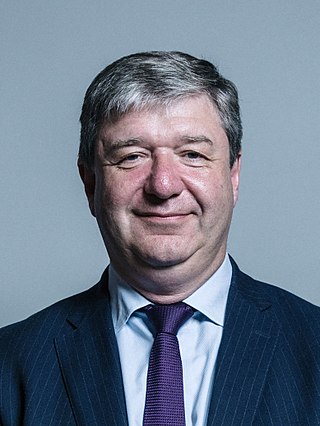
Alexander Morrison "Alistair" Carmichael is a British politician who has served as the Member of Parliament (MP) for Orkney and Shetland since 2001. A member of the Scottish Liberal Democrats, he currently serves as the Liberal Democrat Home Affairs, Northern Ireland and Justice spokesperson. He served as the Deputy Leader of the Scottish Liberal Democrats from 2012 to 2021.
Caithness and Sutherland was a county constituency of the House of Commons of the Parliament of the United Kingdom from 1918 to 1997. It elected one Member of Parliament (MP) by the first past the post system of election.
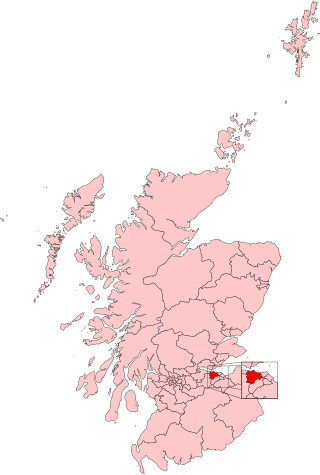
Edinburgh South is a constituency of the House of Commons of the UK Parliament created in 1885. The constituency has been held by Scottish Labour since 1987, being represented by Ian Murray since 2010. Murray was the only Labour MP in Scotland to retain his seat at the 2015 and 2019 general elections and this is one of only three seats never held by the Scottish National Party (SNP).
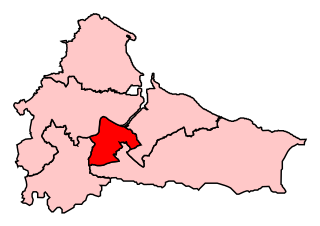
Edinburgh West is a burgh constituency of the House of Commons of the Parliament of the United Kingdom, first contested at the 1885 general election.
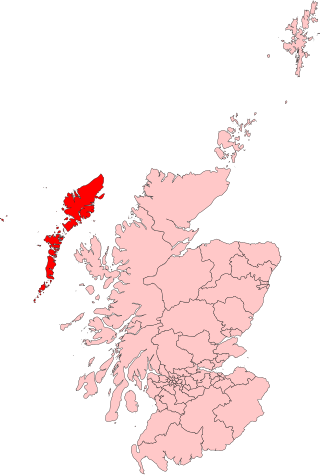
Na h-Eileanan an Iar, formerly Western Isles, is a constituency of the House of Commons of the Parliament of the United Kingdom, created in 1918. It elects one Member of Parliament (MP) by the first past the post system of election.
Bath is a constituency in the House of Commons of the Parliament of the United Kingdom represented by Wera Hobhouse of the Liberal Democrats.
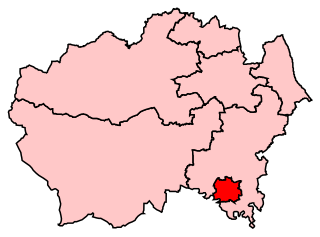
Montgomeryshire is a constituency in Wales represented in the House of Commons of the UK Parliament.
Lewes is a constituency in East Sussex represented in the House of Commons of the UK Parliament since 2015 by Maria Caulfield, a Conservative.
Burnley is a constituency centred on the town of Burnley in Lancashire which has been represented since 2019 by Antony Higginbotham, a Conservative.
Middlesbrough is a parliamentary constituency in the United Kingdom, recreated in 1974, and represented since 2012 in the House of Commons of the UK Parliament by Andy McDonald from the Labour Party. An earlier version of the seat existed between 1868 and 1918.
Darlington is the parliamentary constituency for the eponymous market town in County Durham in the North East of England. It is currently represented in the House of Commons of the UK Parliament by Peter Gibson of the Conservative Party, who was first elected in 2019.
Richmond (Yorks) is a constituency in North Yorkshire represented in the House of Commons of the UK Parliament since May 2015 by Rishi Sunak, the current Prime Minister of the United Kingdom and leader of the Conservative Party.
Newcastle-under-Lyme is a constituency in northern Staffordshire created in 1354 and represented in the House of Commons of the UK Parliament since 2019 by Aaron Bell of the Conservative Party. It was the last to be co-represented by a member of the Conservative Party when it was dual-member, before the 1885 general election which followed the Redistribution of Seats Act 1885 coupled with the Reform Act 1884. In 1919 the local MP, Josiah Wedgwood, shifted his allegiance from the Liberal Party — the Lloyd George Coalition Liberals allying with the Conservatives — to the Labour Party and the seat elected the Labour candidate who has stood at each election for the next hundred years, a total of 29 elections in succession. Labour came close to losing the seat in 1969, 1986, 2015 and 2017, and eventually lost the seat in 2019.
North Shropshire is a constituency in the county of Shropshire, represented in the House of Commons of the UK Parliament by Helen Morgan of the Liberal Democrats after a by-election on 16 December 2021. The former MP, Owen Paterson of the Conservatives, resigned his seat on 5 November 2021 when faced with suspension from the Commons for a breach of advocacy rules and the consequent possibility of a recall petition. The seat had previously been a safe seat for the Conservatives.
Worcester is a borough constituency represented in the House of Commons of the Parliament of the United Kingdom. Since 1885 it has elected one Member of Parliament (MP) by the first past the post system of election; from 1295 to 1885 it elected two MPs.
Winchester is a constituency in Hampshire represented in the House of Commons of the UK Parliament since 2010 by Steve Brine, a Conservative.
Reigate is a constituency in Surrey represented in the House of Commons of the UK Parliament since 1997 by Crispin Blunt, originally of the Conservative Party, but as of October 2023, sitting as an Independent, after having the whip suspended.
Shetland is a constituency of the Scottish Parliament (Holyrood) covering the council area of Shetland. It elects one Member of the Scottish Parliament (MSP) by the first past the post method of election. It is also one of eight constituencies in the Highlands and Islands electoral region, which elects seven additional members, in addition to the eight constituency MSPs, to produce a form of proportional representation for the region as a whole.
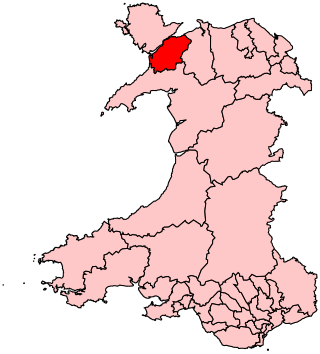
Arfon is a constituency in Wales represented in the House of Commons of the UK Parliament at Westminster. Although it is relatively large by geographical area, the constituency is a predominantly urban rather than rural seat, with the majority of the population living in the two towns of Bethesda and Caernarfon, as well as in the city of Bangor, on which the constituency is based. "Arfon" is a historical name for the area, meaning "facing Anglesey"; it is also the name of the former district council. This seat was created by the Welsh Boundary Commission in time for the 2010 general election; it replaced the old seat of Caernarfon. Bangor was in the old seat of Conwy. The same boundaries were used for the Arfon Welsh Assembly constituency in the 2007 Welsh Assembly election.
Grantham was a Parliamentary constituency in Lincolnshire, England.
{{cite web}}
: CS1 maint: archived copy as title (link)