Colorado's 4th congressional district

Last updated

Colorado's 4th congressional district
Interactive map of district boundaries since January 3, 2023
Representative
 Vacant
Distribution
  • 72.9% urban [1]
  • 27.1% rural
Population (2022)748,891 [2]
Median household
income
$108,087 [3]
Ethnicity
Cook PVI R+13 [4]

Colorado's 4th congressional district is a congressional district in the U.S. state of Colorado. Located in the eastern part of the state, the district encompasses most of the rural Eastern Plains as well as portions of the Colorado Front Range including Loveland, Highlands Ranch, Castle Rock, and Parker.

Contents

The district is currently vacant and was last represented by Republican Ken Buck. With a Cook Partisan Voting Index rating of R+13, it is the most Republican district in Colorado. [4] No Democrat has received more than 40% of the vote as a U.S. House candidate in the district since 2010.

History

1990s

Following the 1990 U.S. census and associated realignment of Colorado congressional districts, the 4th congressional district consisted of Baca, Bent, Cheyenne, Crowley, Elbert, Kiowa, Kit Carson, Larimer, Las Animas, Lincoln, Logan, Morgan, Otero, Phillips, Prowers, Sedgwick, Washington, Weld and Yuma counties, as well as portions of Adams and Arapahoe counties.

2000s

Following the 2000 U.S. census and associated realignment of Colorado congressional districts, the 4th congressional district consisted of Baca, Bent, Cheyenne, Crowley, Kiowa, Kit Carson, Larimer, Lincoln, Logan, Morgan, Phillips, Prowers, Sedgwick, Washington, Weld and Yuma counties, as well as portions of Boulder, and Otero counties.

2010s

Following the 2010 U.S. census and associated realignment of Colorado congressional districts, the 4th congressional district consisted of Baca, Bent, Cheyenne, Crowley, Elbert, Kiowa, Kit Carson, Las Animas, Lincoln, Logan, Morgan, Otero, Phillips, Prowers, Sedgwick, Washington, Weld and Yuma counties. The district also includes portions of Adams, Arapahoe, Boulder and Douglas counties and very little portions of Larimer County.

Characteristics

This district consists mainly of the area of Colorado that is part of the Great Plains region of the United States. It is largely rural. The only large populated places in the district are Loveland, Highlands Ranch, Castle Rock, and Parker. Until the 2010s redistricting, Fort Collins was the largest city in the district and provided a large Democratic base, making the district somewhat competitive: before the 2020 redistricting, Greeley was the largest city in the district but has since been moved to the 8th district.

While the 4th takes in some suburbs of the Democratic-leaning Denver metropolitan area, the 4th takes in Douglas County, the most Republican region in the area. However, it is still far more friendly to the Democrats than the other counties in the district (especially in blue-leaning Highlands Ranch and Lone Tree) and is the only area in the district with any Democratic support of real significance. On the other hand, the district takes in some of the most Republican counties in Colorado, such as Washington, Kit Carson, and Logan, where Democrats rarely exceed even 20 percent of the vote.

Historically, the district has been Republican-leaning, though Marilyn Musgrave won relatively narrow victories in 2004 and 2006 due to her Democratic opponents' strength in Fort Collins. Musgrave had to rely on strong performances in more conservative Greeley to hold onto her seat. In 2008, Musgrave lost reelection to Betsy Markey, who became the first Democrat to represent the district since the early 1970s. Markey was defeated in 2010 by Republican Cory Gardner, and the district was made more Republican in redistricting due to the removal of Fort Collins; no Democratic nominee has won more than 40% of the vote since she left office.

George W. Bush received 58% of the vote in this district in 2004. John McCain narrowly carried the district in 2008 with 50% of the vote.

Composition

#CountySeatPopulation
1 Adams Brighton 533,365
5 Arapahoe Littleton 656,061
9 Baca Springfield 3,344
11 Bent Las Animas 5,681
17 Cheyenne Cheyenne Wells 1,727
25 Crowley Ordway 5,636
35 Douglas Castle Rock 383,906
39 Elbert Kiowa 28,806
41 El Paso Colorado Springs 744,215
61 Kiowa Eads 1,384
63 Kit Carson Burlington 6,994
69 Larimer Fort Collins 370,771
73 Lincoln Hugo 5,480
75 Logan Sterling 20,619
87 Morgan Fort Morgan 29,524
95 Phillips Holyoke 4,476
99 Prowers Lamar 11,751
115 Sedgwick Julesburg 2,299
121 Washington Akron 4,855
123 Weld Greeley 359,442
125 Yuma Wray 9,862

Cities of 10,000 people or more

2,500 – 10,000 people

Voting

Election results from presidential races [5]

Election results
YearOfficeResults
2000 President Bush 57–37%
2004 President Bush 58–41%
2008 President McCain 50–49%
2012 President Romney 59–40%
2016 President Trump 57–34%
Senate Glenn 57–38%
2018 Governor Stapleton 57.7–38.1%
2020 President Trump 57–41%
Senate Gardner 59–39%
2022 Governor Ganahl 55–43%
Senate O'Dea 57–40%

List of members representing the district

MemberPartyTerm durationCong
ress(es)
Electoral historyDistrict location
District created March 4, 1915
TAYLOR, EDWARD T. REPRESENTATIVE LCCN2016861347 (cropped).jpg
Edward T. Taylor
(Glenwood Springs)
Democratic March 4, 1915 –
September 3, 1941
64th
65th
66th
67th
68th
69th
70th
71st
72nd
73rd
74th
75th
76th
77th
Redistricted from the at-large district and re-elected in 1914.
Re-elected in 1916.
Re-elected in 1918.
Re-elected in 1920.
Re-elected in 1922.
Re-elected in 1924.
Re-elected in 1926.
Re-elected in 1928.
Re-elected in 1930.
Re-elected in 1932.
Re-elected in 1934.
Re-elected in 1936.
Re-elected in 1938.
Re-elected in 1940.
Died.
VacantSeptember 3, 1941 –
December 9, 1941
77th
Robert F. Rockwell (Colorado Congressman).jpg
Robert F. Rockwell
(Paonia)
Republican December 9, 1941 –
January 3, 1949
77th
78th
79th
80th
Elected to finish Taylor's term.
Re-elected in 1942.
Re-elected in 1944.
Re-elected in 1946.
Lost re-election.
Wayne N. Aspinall.jpg
Wayne N. Aspinall
(Palisade)
Democratic January 3, 1949 –
January 3, 1973
81st
82nd
83rd
84th
85th
86th
87th
88th
89th
90th
91st
92nd
Elected in 1948.
Re-elected in 1950.
Re-elected in 1952.
Re-elected in 1954.
Re-elected in 1956.
Re-elected in 1958.
Re-elected in 1960.
Re-elected in 1962.
Re-elected in 1964.
Re-elected in 1966.
Re-elected in 1968.
Re-elected in 1970.
Lost renomination.
Jim Johnson Colorado.png
Jim Johnson
(Fort Collins)
Republican January 3, 1973 –
January 3, 1981
93rd
94th
95th
96th
Elected in 1972.
Re-elected in 1974.
Re-elected in 1976.
Re-elected in 1978.
Retired.
HankBrown.jpg
Hank Brown
(Greeley)
Republican January 3, 1981 –
January 3, 1991
97th
98th
99th
100th
101st
Elected in 1980.
Re-elected in 1982.
Re-elected in 1984.
Re-elected in 1986.
Re-elected in 1988.
Retired to run for U.S. Senator.
Wayne Allard, official photo portrait 2.jpg
Wayne Allard
(Loveland)
Republican January 3, 1991 –
January 3, 1997
102nd
103rd
104th
Elected in 1990.
Re-elected in 1992.
Re-elected in 1994.
Retired to run for U.S. Senator.
Bob Schaffer.jpg
Bob Schaffer
(Fort Collins)
Republican January 3, 1997 –
January 3, 2003
105th
106th
107th
Elected in 1996.
Re-elected in 1998.
Re-elected in 2000.
Retired.
Marilynmusgrave.jpg
Marilyn Musgrave
(Fort Morgan)
Republican January 3, 2003 –
January 3, 2009
108th
109th
110th
Elected in 2002.
Re-elected in 2004.
Re-elected in 2006.
Lost re-election.
2003–2013
US-Congressional-District-CO-4.PNG
Rep Betsy Markey Portrait.JPG
Betsy Markey
(Fort Collins)
Democratic January 3, 2009 –
January 3, 2011
111th Elected in 2008.
Lost re-election.
Cory Gardner, Official Portrait, 112th Congress.jpg
Cory Gardner
(Yuma)
Republican January 3, 2011 –
January 3, 2015
112th
113th
Elected in 2010.
Re-elected in 2012.
Retired to run for U.S. Senator.
2013–2023
Colorado US Congressional District 4 (since 2013).tif
Ken Buck official congressional photo (cropped 2).jpg
Ken Buck
(Windsor)
Republican January 3, 2015 –
March 22, 2024
114th
115th
116th
117th
118th
Elected in 2014.
Re-elected in 2016.
Re-elected in 2018.
Re-elected in 2020.
Re-elected in 2022.
Resigned.
2023–present
Colorado's 4th congressional district (since 2023) (new version).svg
VacantMarch 22, 2024 –
present
118th New member to be elected in 2024 to finish the term.

Election results

1914 1916 1918 1920 1922 1924 1926 1928 1930 1932 1934 1936 1938 1940 1941 (Special) 1942 1944 1946 1948 1950 1952 1954 1956 1958 1960 1962 1964 1966 1968 1970 1972 1974 1976 1978 1980 1982 1984 1986 1988 1990 1992 1994 1996 1998 2000 2002 2004 2006 2008 2010 2012 2014 2016 2018 2020 2022

1914

1914 United States House of Representatives elections [6]
PartyCandidateVotes%
Democratic Edward T. Taylor (Incumbent) 26,562 57.83
Republican H.J. Baird15,01532.69
Socialist George Kunkle4,3539.48
Total votes45,930 100.0
Democratic win (new seat)

1916

1916 United States House of Representatives elections [7]
PartyCandidateVotes%
Democratic Edward T. Taylor (Incumbent) 30,926 65.78
Republican H.J. Baird13,39728.49
Socialist Emery D. Cox2,6955.73
Total votes47,018 100.0
Democratic hold

1918

1918 United States House of Representatives elections [8]
PartyCandidateVotes%
Democratic Edward T. Taylor (Incumbent) 22,423 65.72
Republican Straud M. Logan11,69534.28
Total votes34,118 100.0
Democratic hold

1920

1920 United States House of Representatives elections [9]
PartyCandidateVotes%
Democratic Edward T. Taylor (Incumbent) 25,994 55.32
Republican Merle D. Vincent20,99144.68
Total votes46,985 100.0
Democratic hold

1922

1922 United States House of Representatives elections [10]
PartyCandidateVotes%
Democratic Edward T. Taylor (Incumbent) 30,331 64.26
Republican Merle D. Vincent16,87035.74
Total votes47,201 100.0
Democratic hold

1924

1924 United States House of Representatives elections [11]
PartyCandidateVotes%
Democratic Edward T. Taylor (Incumbent) 33,262 65.54
Republican Webster S. Whinnery17,48634.46
Total votes50,748 100.0
Democratic hold

1926

1926 United States House of Representatives elections [12]
PartyCandidateVotes%
Democratic Edward T. Taylor (Incumbent) 32,093 66.75
Republican Webster S. Whinnery15,99033.25
Total votes48,083 100.0
Democratic hold

1928

1928 United States House of Representatives elections [13]
PartyCandidateVotes%
Democratic Edward T. Taylor (Incumbent) 30,142 58.84
Republican William P. Dale21,08941.16
Total votes51,231 100.0
Democratic hold

1930

1930 United States House of Representatives elections [14]
PartyCandidateVotes%
Democratic Edward T. Taylor (Incumbent) 34,536 66.95
Republican Webster S. Whinnery17,05133.05
Total votes51,587 100.0
Democratic hold

1932

1932 United States House of Representatives elections [15]
PartyCandidateVotes%
Democratic Edward T. Taylor (Incumbent) 40,736 65.99
Republican Richard C. Callen20,99334.01
Total votes61,729 100.0
Democratic hold

1934

1934 United States House of Representatives elections [16]
PartyCandidateVotes%
Democratic Edward T. Taylor (Incumbent) 39,747 67.30
Republican Harry McDevitt17,23429.18
Veterans' PartyGustavis A. Billstrom1,6252.75
Independent O.W. Daggett4570.77
Total votes59,063 100.0
Democratic hold

1936

1936 United States House of Representatives elections [17]
PartyCandidateVotes%
Democratic Edward T. Taylor (Incumbent) 42,010 65.45
Republican John S. Woody22,17534.55
Total votes64,185 100.0
Democratic hold

1938

1938 United States House of Representatives elections [18]
PartyCandidateVotes%
Democratic Edward T. Taylor (Incumbent) 43,596 63.74
Republican John S. Woody24,80536.26
Total votes68,401 100.0
Democratic hold

1940

1940 United States House of Representatives elections [19]
PartyCandidateVotes%
Democratic Edward T. Taylor (Incumbent) 44,095 59.41
Republican Paul W. Crawford30,12640.59
Total votes74,221 100.0
Democratic hold

1941 (Special)

1941 Colorado's 4th congressional district special election [20]
PartyCandidateVotes%
Republican Robert F. Rockwell 19,918 54.04
Democratic Frank Delaney16,94145.96
Total votes36,859 100.0
Republican gain from Democratic

1942

1942 United States House of Representatives elections [21]
PartyCandidateVotes%
Republican Robert F. Rockwell (Incumbent) 28,460 58.75
Democratic Elizabeth E. Pellet19,97941.25
Total votes48,439 100.0
Republican hold

1944

1944 United States House of Representatives elections [22]
PartyCandidateVotes%
Republican Robert F. Rockwell (Incumbent) 38,671 61.67
Democratic John L. Heuschkel24,03938.33
Total votes62,710 100.0
Republican hold

1946

1946 United States House of Representatives elections [23]
PartyCandidateVotes%
Republican Robert F. Rockwell (Incumbent) 28,894 58.75
Democratic Thomas Matthews20,29041.25
Total votes49,184 100.0
Republican hold

1948

1948 United States House of Representatives elections [24]
PartyCandidateVotes%
Democratic Wayne Aspinall 34,695 51.86
Republican Robert F. Rockwell (Incumbent)32,20648.14
Total votes66,901 100.0
Democratic gain from Republican

1950

1950 United States House of Representatives elections [25]
PartyCandidateVotes%
Democratic Wayne Aspinall (Incumbent) 35,797 57.30
Republican Jack Evans26,67442.70
Total votes62,471 100.0
Democratic hold

1952

1952 United States House of Representatives elections [26]
PartyCandidateVotes%
Democratic Wayne Aspinall (Incumbent) 39,676 50.02
Republican Howard M. Shults39,64749.98
Total votes79,323 100.0
Democratic hold

1954

1954 United States House of Representatives elections [27]
PartyCandidateVotes%
Democratic Wayne Aspinall (Incumbent) 34,294 53.49
Republican Charles E. Wilson29,81846.51
Total votes64,112 100.0
Democratic hold

1956

1956 United States House of Representatives elections [28]
PartyCandidateVotes%
Democratic Wayne Aspinall (Incumbent) 48,489 61.76
Republican Hugh Caldwell30,02638.24
Total votes78,515 100.0
Democratic hold

1958

1958 United States House of Representatives elections [29]
PartyCandidateVotes%
Democratic Wayne Aspinall (Incumbent) 43,785 63.61
Republican J.R. "Dick" Wells25,04836.39
Total votes68,833 100.0
Democratic hold

1960

1960 United States House of Representatives elections [30]
PartyCandidateVotes%
Democratic Wayne Aspinall (Incumbent) 58,731 68.54
Republican Charles P. Casteel26,96031.46
Total votes85,691 100.0
Democratic hold

1962

1962 United States House of Representatives elections [31]
PartyCandidateVotes%
Democratic Wayne Aspinall (Incumbent) 42,462 58.65
Republican Leo L. Sommerville29,94341.35
Total votes72,405 100.0
Democratic hold

1964

1964 United States House of Representatives elections [32]
PartyCandidateVotes%
Democratic Wayne Aspinall (Incumbent) 106,685 63.02
Republican Edwin S. Lamm62,61736.98
Total votes169,302 100.0
Democratic hold

1966

1966 United States House of Representatives elections [33]
PartyCandidateVotes%
Democratic Wayne Aspinall (Incumbent) 84,107 58.61
Republican James Paul Johnson 59,40441.39
Total votes143,511 100.0
Democratic hold

1968

1968 United States House of Representatives elections [34]
PartyCandidateVotes%
Democratic Wayne Aspinall (Incumbent) 92,680 54.69
Republican Fred E. Anderson76,77645.31
Total votes169,456 100.0
Democratic hold

1970

1970 United States House of Representatives elections [35]
PartyCandidateVotes%
Democratic Wayne Aspinall (Incumbent) 76,244 55.08
Republican Bill Gossard62,16944.92
Total votes138,413 100.0
Democratic hold

1972

1972 United States House of Representatives elections [36]
PartyCandidateVotes%
Republican James Paul Johnson 94,994 51.03
Democratic Alan Merson91,15148.97
Total votes186,145 100.0
Republican gain from Democratic

1974

1974 United States House of Representatives elections [37]
PartyCandidateVotes%
Republican James Paul Johnson (Incumbent) 82,982 52.05
Democratic John Carroll76,45247.95
Total votes159,434 100.0
Republican hold

1976

1976 United States House of Representatives elections [38]
PartyCandidateVotes%
Republican James Paul Johnson (Incumbent) 119,458 54.05
Democratic Daniel Ogden76,99534.84
Independent Dick Davis20,3989.23
Independent Henry Thiel4,1671.89
Total votes221,018 100.0
Republican hold

1978

1978 United States House of Representatives elections [39]
PartyCandidateVotes%
Republican James Paul Johnson (Incumbent) 103,121 61.18
Democratic Morgan Smith65,42138.82
Total votes168,542 100.0
Republican hold

1980

1980 United States House of Representatives elections [40]
PartyCandidateVotes%
Republican Hank Brown 178,221 68.42
Democratic Polly Baca 76,84929.50
Libertarian Cynthia Molson-Smith5,4212.08
Total votes260,491 100.0
Republican hold

1982

1982 United States House of Representatives elections [41]
PartyCandidateVotes%
Republican Hank Brown (Incumbent) 105,550 69.76
Democratic Charles "Bud" Bishopp45,75030.24
Total votes151,300 100.0
Republican hold

1984

1984 United States House of Representatives elections [42]
PartyCandidateVotes%
Republican Hank Brown (Incumbent) 146,469 71.13
Democratic Mary Fagan Bates56,46227.42
Libertarian Randy Fitzgerald2,9991.45
Total votes205,930 100.0
Republican hold

1986

1986 United States House of Representatives elections [43]
PartyCandidateVotes%
Republican Hank Brown (Incumbent) 117,089 69.80
Democratic David Sprague50,67230.20
Total votes167,761 100.0
Republican hold

1988

1988 United States House of Representatives elections [44]
PartyCandidateVotes%
Republican Hank Brown (Incumbent) 156,202 73.08
Democratic Charles S. Vigil57,55226.92
Total votes213,754 100.0
Republican hold

1990

1990 United States House of Representatives elections [45]
PartyCandidateVotes%
Republican Wayne Allard 89,285 54.05
Democratic Richard R. "Dick" Bond75,90145.95
Total votes165,186 100.0
Republican hold

1992

1992 United States House of Representatives elections [46]
PartyCandidateVotes%
Republican Wayne Allard (Incumbent) 139,884 57.84
Democratic Tom Redder101,95742.16
Total votes241,841 100.0
Republican hold

1994

1994 United States House of Representatives elections [47]
PartyCandidateVotes%
Republican Wayne Allard (Incumbent) 136,251 72.30
Democratic Cathy Kipp52,20227.70
Total votes188,453 100.0
Republican hold

1996

1996 United States House of Representatives elections [48]
PartyCandidateVotes%
Republican Bob Schaffer 137,012 56.14
Democratic Guy Kelley92,83738.04
American Wesley Paul "Wes" McKinley7,4283.04
Natural Law Cynthia Parker6,7902.78
Total votes244,067 100.0
Republican hold

1998

1998 United States House of Representatives elections [49]
PartyCandidateVotes%
Republican Bob Schaffer (Incumbent) 131,318 59.34
Democratic Susan Kirkpatrick89,97340.66
Total votes221,291 100.0
Republican hold

2000

2000 United States House of Representatives elections [50]
PartyCandidateVotes%
Republican Bob Schaffer (Incumbent) 209,078 79.50
Natural Law Dan Sewell Ward19,7217.50
Libertarian Kordon L. Baker19,7137.50
Constitution Leslie J. Hanks9,9553.77
Write-in4,5391.73
Total votes263,006 100.0
Republican hold

2002

2002 United States House of Representatives elections [51]
PartyCandidateVotes%
Republican Marilyn Musgrave 115,359 54.95
Democratic Stan Matsunaka 87,49941.68
Libertarian John Volz7,0973.37
Total votes209,955 100.0
Republican hold

2004

2004 United States House of Representatives elections [52]
PartyCandidateVotes%
Republican Marilyn Musgrave (Incumbent) 155,958 51.05
Democratic Stan Matsunaka 136,81244.78
Green Bob Kinsey12,7394.17
Total votes305,509 100.0
Republican hold

2006

2006 United States House of Representatives elections [53]
PartyCandidateVotes%
Republican Marilyn Musgrave (Incumbent) 109,732 45.61
Democratic Angie Paccione 103,74843.11
Reform Eric Eidsness 27,13311.28
Total votes240,613 100.0
Republican hold

2008

2008 United States House of Representatives elections [54]
PartyCandidateVotes%
Democratic Betsy Markey 187,348 56%
Republican Marilyn Musgrave (Incumbent)146,03044%
Total votes333,378 100%
Democratic gain from Republican

2010

2010 United States House of Representatives elections [55]
PartyCandidateVotes%
Republican Cory Gardner 138,634 52%
Democratic Betsy Markey (Incumbent)109,24941%
Constitution Doug Aden12,3125%
No partyKen "Wasko" Waszkiewicz3,9862%
Total votes264,181 100%
Republican gain from Democratic

2012

2012 United States House of Representatives elections [55]
PartyCandidateVotes%
Republican Cory Gardner (Incumbent) 200,006 59%
Democratic Brandon Shaffer128,80037%
Libertarian Josh Gilliland10,6823%
Constitution Doug Aden5,8481%
Total votes345,336 100%
Republican hold

2014

2014 United States House of Representatives elections [55]
PartyCandidateVotes%
Republican Ken Buck 185,292 65%
Democratic Vic Meyers83,72729%
Libertarian Jess Loban9,4723%
Independent Grant Doherty8,0163%
Total votes286,507 100%
Republican hold

2016

2016 United States House of Representatives elections [55]
PartyCandidateVotes%
Republican Ken Buck (incumbent) 248,230 63.5%
Democratic Bob Seay123,64231.7%
Libertarian Bruce Griffith18,7614.8%
Total votes390,633 100%
Republican hold

2018

2018 United States House of Representatives elections [56]
PartyCandidateVotes%
Republican Ken Buck (incumbent) 224,038 60.61%
Democratic Karen McCormick145,54439.38%
Write-in 380.01%
Total votes369,620 100%
Republican hold

2020

2020 United States House of Representatives elections [57]
PartyCandidateVotes%
Republican Ken Buck (incumbent) 285,606 60.1%
Democratic Ike McCorkle173,94536.6%
Libertarian Bruce Griffith11,0262.3%
Unity Laura Ireland4,5301.0%
Total votes475,107 100%
Republican hold

2022

2022 United States House of Representatives elections [58]
PartyCandidateVotes%
Republican Ken Buck (incumbent) 216,024 60.9%
Democratic Ike McCorkle129,61936.6%
American Constitution Ryan McGonigal8,8702.5%
Total votes354,513 100%
Republican hold

Historical district boundaries

2003-2013 US-Congressional-District-CO-4.PNG
2003–2013
2013-2023 Colorado US Congressional District 4 (since 2013).tif
2013–2023

See also

Related Research Articles

<span class="mw-page-title-main">Job Adams Cooper</span> American politician

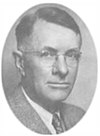
Job Adams Cooper was a U.S. Republican Party politician. He served as the sixth governor of the State of Colorado from 1889 to 1891.

<span class="mw-page-title-main">Colorado's 2nd congressional district</span> U.S. House district for Colorado

Colorado's 2nd congressional district is a congressional district in the U.S. state of Colorado. The district is located in the north-central part of the state and encompasses the northwestern suburbs of Denver including Boulder and Fort Collins. The district also includes the mountain towns of Vail, Granby, Steamboat Springs, and Idaho Springs. Redistricting in 2011 moved Larimer County, including the cities of Fort Collins and Loveland, to the 2nd from the 4th district. Meanwhile, redistricting in 2021 moved Loveland back to the 4th district and Broomfield and western Jefferson County to the 7th district.

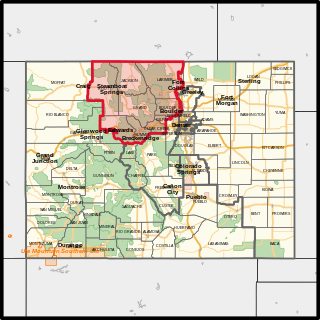
Colorado's 3rd congressional district is a congressional district in the U.S. state of Colorado. It takes in most of the rural Western Slope in the state's western third portion, with a wing in the south taking in some of the southern portions of the Eastern Plains. It includes the cities of Grand Junction, Durango, Aspen, Glenwood Springs, Ignacio, and Pueblo. The district has been represented by Republican Lauren Boebert since 2021.

<span class="mw-page-title-main">Colorado's 5th congressional district</span> U.S. House district for Colorado

Colorado's 5th congressional district is a congressional district in the U.S. state of Colorado. The district lies in the center of the state and comprises Colorado Springs and its suburbs including Cimarron Hills and Fort Carson.

The politics of Colorado, United States, are that of a blue state. Once considered a swing state that used to be Republican-leaning, Colorado has been trending Democratic since the early part of the 21st century due to changing demographics and a rising number of the large unaffiliated bloc of voters leaning Democratic. The growing shift of the state's Republican Party towards social and religious conservatism along with shifting further to the right has also been cited as reasons for the changing voting patterns of Colorado.

<span class="mw-page-title-main">2008 United States presidential election in Colorado</span> Election in Colorado

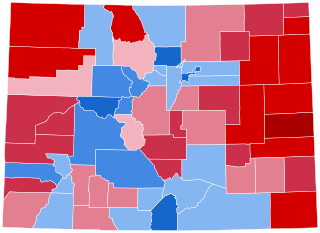
The 2008 United States presidential election in Colorado took place on November 4, 2008, as a part of the 2008 United States presidential election throughout all 50 states and the District of Columbia. Voters chose nine representatives, or electors to the Electoral College, who voted for president and vice president.

<span class="mw-page-title-main">2010 Colorado gubernatorial election</span> Gubernatorial election in Colorado, United States

The 2010 Colorado gubernatorial election was held on Tuesday, November 2, 2010 to elect the Governor of Colorado, who would serve a four-year term that began in January 2011. One-term incumbent Democrat Bill Ritter announced that he would not run for re-election in 2010. Dan Maes, backed by the Tea Party movement, won the Republican nomination in the primary with 50.6% of the vote and a 1.3% margin over rival Scott McInnis. In claiming victory, Maes called on former representative Tom Tancredo, running as the Constitution Party's nominee to "stop your campaign tonight." Denver mayor John Hickenlooper was unopposed for the Democratic nomination. Hickenlooper won the race with over 50% of the vote.

Colorado district courts are the state trial courts of general jurisdiction in the U.S. state of Colorado.

<span class="mw-page-title-main">2014 Colorado gubernatorial election</span>

The 2014 Colorado gubernatorial election was held on November 4, 2014, to elect the Governor and Lieutenant Governor of Colorado, concurrently with the election to Colorado's Class II U.S. Senate seat, as well as other elections to the United States Senate in other states and elections to the United States House of Representatives and various state and local elections.

<span class="mw-page-title-main">2018 Colorado gubernatorial election</span> Election of Jared Polis as the 43rd governor of Colorado

The 2018 Colorado gubernatorial election took place on November 6, 2018, to elect the next governor of Colorado. Incumbent Democratic governor John Hickenlooper was term-limited and could not seek a third consecutive term. The primary election was held on June 26.

<span class="mw-page-title-main">1968 United States presidential election in Colorado</span> Election in Colorado

The 1968 United States presidential election in Colorado took place on November 5, 1968, as part of the 1968 United States presidential election. State voters chose six representatives, or electors, to the Electoral College, who voted for president and vice president.

<span class="mw-page-title-main">1964 United States presidential election in Colorado</span> Election in Colorado

The 1964 United States presidential election in Colorado took place on November 3, 1964, as part of the 1964 United States presidential election. State voters chose six representatives, or electors, to the Electoral College, who voted for president and vice president.

<span class="mw-page-title-main">Colorado's 1st Senate district</span> American legislative district

Colorado's 1st Senate district is one of 35 districts in the Colorado Senate. It has been represented by Republican Byron Pelton since 2023. Prior to redistricting the district was represented by Republicans Jerry Sonnenberg and Greg Brophy.

<span class="mw-page-title-main">Colorado's 15th Senate district</span> American legislative district

Colorado's 15th Senate district is one of 35 districts in the Colorado Senate. It has been represented by Democrat Janice Marchman since 2023. Prior to redistricting the district was represented by Republicans Rob Woodward and Kevin Lundberg.

<span class="mw-page-title-main">Colorado's 35th Senate district</span> American legislative district

Colorado's 35th Senate district is one of 35 districts in the Colorado Senate. It has been represented by Republican Rod Pelton since 2023. Prior to redistricting the district was represented by Republicans Cleave Simpson and Larry Crowder.

Richard Holtorf is an American politician and rancher serving as a member of the Colorado House of Representatives from 63rd district, which includes all or part of Logan, Morgan, Phillips, Sedgwick, Washington, Weld, and Yuma counties, including the communities of Sterling, Fort Morgan, Brush, Yuma, and Wray. Prior to 2023 and reapportionment, Holtorf represented the 64th house district. He assumed office on December 28, 2019.

<span class="mw-page-title-main">Mike Lynch (Colorado politician)</span> American politician

Michael Spencer Lynch is a state representative from Wellington, Colorado. A Republican, Lynch represents Colorado House of Representatives District 65, which includes parts of Weld and Larimer counties, including the communities of Windsor, Wellington, Severance, Tinmath, and Eaton. Prior to 2020 reapportionment, he represented District 49, which included portions of Larimer and Weld counties in northern Colorado.

<span class="mw-page-title-main">Ty Winter</span> American politician

Ty Winter is a state representative from Las Animas County, Colorado. A Republican, Winter represents Colorado House of Representatives District 47, which includes all of Baca, Bent, Crowley, Kiowa, Las Animas, Otero, and Prowers counties and parts of Huerfano and Pueblo counties in southern Colorado. Some of the cities and towns in the district are Pueblo West, Trinidad, Lamar, La Junta, and Rocky Ford.

References

  1. "Congressional Districts Relationship Files (state-based)". www.census.gov. US Census Bureau Geography.
  2. "My Congressional District". www.census.gov. Center for New Media & Promotion (CNMP), US Census Bureau.
  3. "My Congressional District".
  4. 1 2 "2022 Cook PVI: District Map and List". Cook Political Report. Retrieved January 10, 2023.
  5. Presidential Election Results, by district, swingstateproject.com
  6. "Our Campaigns - CO District 4 Race - Nov 03, 1914". www.ourcampaigns.com.
  7. "Our Campaigns - CO District 4 Race - Nov 07, 1916". www.ourcampaigns.com.
  8. "Our Campaigns - CO District 4 Race - Nov 05, 1918". www.ourcampaigns.com.
  9. "1920 Election Results" (PDF). house.gov.
  10. "1922 Election Results" (PDF). house.gov.
  11. "1924 Election Results" (PDF). house.gov.
  12. "1926 Election Results" (PDF). house.gov.
  13. "1928 Election Results" (PDF). house.gov.
  14. "1930 Election Results" (PDF). house.gov.
  15. "1932 Election Results" (PDF). house.gov.
  16. "1934 Election Results" (PDF). house.gov.
  17. "1936 Election Results" (PDF). house.gov.
  18. "1938 Election Results" (PDF). house.gov.
  19. "1940 Election Results" (PDF). house.gov.
  20. "Our Campaigns - CO District 4 - Special Election Race - Dec 09, 1941". www.ourcampaigns.com.
  21. "1942 Election Results" (PDF). house.gov.
  22. "1944 Election Results" (PDF). house.gov.
  23. "1946 Election Results" (PDF). house.gov.
  24. "1948 Election Results" (PDF). house.gov.
  25. "1950 Election Results" (PDF). house.gov.
  26. "1952 Election Results" (PDF). house.gov.
  27. "1954 Election Results" (PDF). house.gov.
  28. "1956 Election Results" (PDF). house.gov.
  29. "1958 Election Results" (PDF). house.gov.
  30. "1960 Election Results" (PDF). house.gov.
  31. "1962 Election Results" (PDF). house.gov.
  32. "1964 Election Results" (PDF). house.gov.
  33. "1966 Election Results" (PDF). house.gov.
  34. "1968 Election Results" (PDF). house.gov.
  35. "1970 Election Results" (PDF). house.gov.
  36. "1972 Election Results" (PDF). house.gov.
  37. "1974 Election Results" (PDF). house.gov.
  38. "1976 Election Results" (PDF). house.gov.
  39. "1978 Election Results" (PDF). house.gov.
  40. "1980 Election Results" (PDF). house.gov.
  41. "1982 Election Results" (PDF). house.gov.
  42. "1984 Election Results" (PDF). house.gov.
  43. "1986 Election Results" (PDF). house.gov.
  44. "1988 Election Results" (PDF). house.gov.
  45. "1990 Election Results" (PDF). house.gov.
  46. "1992 Election Results" (PDF). house.gov.
  47. "1994 Election Results" (PDF). house.gov.
  48. "1996 Election Results" (PDF). house.gov.
  49. "1998 Election Results" (PDF). house.gov.
  50. "2000 Election Results" (PDF). house.gov.
  51. "2002 Election Results" (PDF). house.gov.
  52. "2004 Election Results" (PDF). house.gov.
  53. "2006 Election Results" (PDF). house.gov.
  54. "2008 Election Results" (PDF). house.gov.
  55. 1 2 3 4 "2010 Election Results". state.co.us. Archived from the original on November 29, 2010. Retrieved July 24, 2011.
  56. "2018 Colorado general election results" . Retrieved June 21, 2019.
  57. "2020 General Election - Official Compiled Results". Colorado Secretary of State. Retrieved December 6, 2020.
  58. "Certificate & Results - General Election Statewide Abstract of Votes Cast" (PDF). Colorado Secretary of State.

39°04′15″N103°24′50″W / 39.07083°N 103.41389°W / 39.07083; -103.41389