Boundaries
1868–1885
Under the Reform Act 1867, the proposed contents of the new parliamentary borough were defined as the townships of Darlington, Haughton-le-Skerne, and Cockerton. [2] However, this was amended under the Boundary Act 1868, with the boundary defined as being coterminous with the Municipal Borough of Darlington. [4]
See map on Vision of Britain website. [5]
1885-1918
As defined in 1868 with minor amendments. [6]
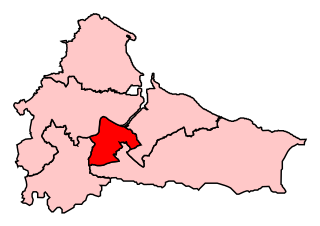
1918–1983
The County Borough of Darlington. [7]
The boundaries were adjusted in 1918, 1950 and 1973 to reflect changes to the boundaries of the county borough.
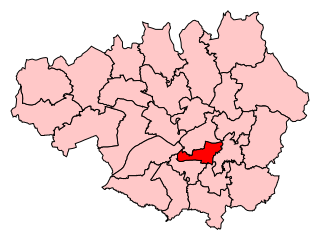
1983–2010
The Borough of Darlington wards of Bank Top, Central, Cockerton East, Cockerton West, college, Eastbourne North, Eastbourne South, Harrowgate Hill, Haughton East, Haughton West, Hummersknott, Lascelles, Lingfield, Mowden, Northgate North, Northgate South, North Road, Park East, Park West, and Pierremont. [8] [9]
No change to boundaries.
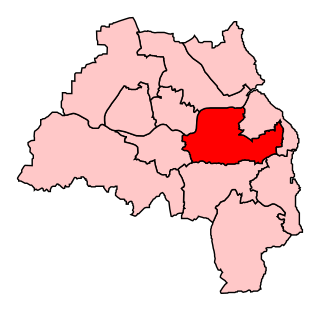
2010–2015

Map of present boundaries
The Borough of Darlington wards of Bank Top, Central, Cockerton East, Cockerton West, College, Eastbourne, Faverdale, Harrowgate Hill, Haughton East, Haughton North, Haughton West, Hummersknott, Lascelles, Lingfield, Mowden, Northgate, North Road, Park East, Park West, and Pierremont. [10]
Minor change to reflect new ward boundaries.
2015–present
The Borough of Darlington wards of Bank Top and Lascelles, Brinkburn and Faverdale, Cockerton, College, Eastbourne, Harrowgate Hill, Haughton and Springfield, Hummersknott, Mowden, Northgate, North Road, Park East, Park West, Pierremont, Red Hall and Lingfield, Stephenson, and Whinfield.
Following a further change to the ward boundaries of Darlington Borough in 2015, the contents of the seat are currently as above. No change to boundaries.
Proposed
Further to the 2023 Periodic Review of Westminster constituencies, enacted by the Parliamentary Constituencies Order 2023, from the 2024 general election, the constituency will be composed of the following wards of the Borough of Darlington (as they existed on 1 December 2020):
Bank Top & Lascelles; Brinkburn & Faverdale; Cockerton; College; Eastbourne; Harrowgate Hill; Haughton & Springfield; Heighington & Coniscliffe; Hummersknott; Mowden; North Road; Northgate; Park East; Park West; Pierremont; Red Hall & Lingfield; Stephenson; Whinfield. [11]
The constituency will be expanded slightly to bring the electorate within the permitted range, by adding the rural ward of Heighington & Coniscliffe from the (to be abolished) constituency of Sedgefield.
This page is based on this
Wikipedia article Text is available under the
CC BY-SA 4.0 license; additional terms may apply.
Images, videos and audio are available under their respective licenses.